Absorption-line Detections of 105-6 K Gas in Spiral-Rich Groups of Galaxies 111Based on observations with the NASA/ESA Hubble Space Telescope, obtained at the Space Telescope Science Institute, which is operated by AURA, Inc., under NASA contract NAS 5-26555.
Abstract
Using the Cosmic Origins Spectrograph (COS) on the Hubble Space Telescope (HST) the COS Science Team has conducted a high signal-to-noise survey of 14 bright QSOs. In a previous paper (Savage et al. 2014) these far-UV spectra were used to discover 14 “warm” (T 105 K) absorbers using a combination of broad Ly and broad O VI absorptions. A reanalysis of a few of this new class of absorbers using slightly relaxed fitting criteria finds as many as 20 warm absorbers could be present in this sample. A shallow, wide spectroscopic galaxy redshift survey has been conducted around these sightlines to investigate the warm absorber environment, which is found to be spiral-rich groups or cluster outskirts with radial velocity dispersions = 250-750 km s-1. While 2 evidence is presented favoring the hypothesis that these absorptions are associated with the galaxy groups and not with the individual, nearest galaxies, this evidence has considerable systematic uncertainties and is based on a small sample size so it is not entirely conclusive. If the associations are with galaxy groups, the observed frequency of warm absorbers ( = 3.5–5 per unit redshift) requires them to be very extended as an ensemble on the sky ( 1 Mpc in radius at high covering factor). Most likely these warm absorbers are interface gas clouds whose presence implies the existence of a hotter (T 106.5 K), diffuse and probably very massive ( 1011 M⊙) intra-group medium which has yet to be detected directly.
Subject headings:
cosmological parameters—cosmology: observations—intergalactic medium—quasars: absorption lines—galaxies:halos—galaxies:spiral—galaxies:structure—ultraviolet: general1. Introduction
On the basis of theoretical and observational considerations (e.g., Spitzer, 1956; McGaugh et al., 2000; Pagel, 2008) and numerical simulations (Klypin et al., 2001) a massive halo of gas is expected around every luminous late-type galaxy, otherwise these systems would be baryon deficient relative to dark matter (Klypin et al., 2001; Stocke et al., 2013). If present in spiral galaxy halos, these as yet undetected baryons could add considerably to the overall baryon inventory at 0, which has not yet been finalized (Fukugita, Hogan, & Peebles, 1998; Bregman, 2007; Shull et al., 2012). Additionally, while cosmological simulations find that the amount of gas accretion, both cold and hot, has declined by an order of magnitude since redshifts of 2–4 (Keres̆ & Hernquist, 2009), there still needs to be sufficient infall in recent times to satisfy the constraints of the “G-dwarf problem” (Larson, 1972; Pagel, 2008) and to maintain the high star-formation-rates (SFR) in current day, massive spiral galaxies (Binney & Tremaine, 1987; Chomiuk & Povich, 2011).
On a larger scale, our Milky Way and virtually all large spirals are members of small groups of galaxies which may or may not be bound entities (Pisani, Ramella & Geller, 2003; Berlind et al., 2006). Detailed studies of the Local Supercluster by Tully et al. (2009) concluded that there are virtually no isolated galaxies although more recently a few relatively isolated dwarfs have been located (Karachentseva, Karachentsev & Sharina, 2010). Almost all galaxies in the Local Supercluster can be identified as members of bound groups and clusters or possibly unbound associations. Therefore, it is likely that the distinction between individual galaxy halos and a larger, intra-group medium in spiral-rich groups may be largely semantic; i.e., individual galaxy halos may merge to form a larger gas reservoir that could fill much or all of the volume of the group. Numerical simulations (Cen & Ostriker, 1999; Davé et al., 1999) suggest that metal-enriched gas escaping from galaxies by supernova- and AGN-driven winds reaches distances of 1 Mpc and observations find that O VI absorbers (the most sensitive tracer of metal-enriched gas at low-) extend 1 Mpc from the nearest L∗ galaxy (Tumlinson & Fang, 2005; Stocke et al., 2006). However, the ultimate source, physical conditions and extent of this low-metallicity, halo/intra-group gas has not yet been identified and characterized.
On the other hand, large reservoirs of low-metallicity ( -0.5 solar) hot gas already are detected via thermal bremsstrahlung X-ray emission in groups and clusters of early-type galaxies (Sarazin, 1988; Mulchaey, 2000). The intra-cluster and intra-group gas contains a greater number of baryons than in the member galaxies and raises the baryon-to-dark matter ratio in groups and clusters to the cosmic mean (1:5; White et al., 1993). This suggests that these systems are “closed boxes” from an evolutionary perspective. However, only those clusters and groups sufficiently evolved dynamically to contain giant elliptical galaxies at or near their centers are detected in soft X-ray emission (Mulchaey, 2000). Since no spiral-rich groups were detected in their large ROSAT survey of nearby groups of galaxies, Mulchaey et al. (1996) suggested that the intra-group gas in these systems is too cool to emit X-rays in sufficient numbers and energy to be detectable using current instruments. Using the observed scaling-relation between the X-ray determined gas temperature Tx and the group velocity dispersion , a factor of 5–30 cooler gas temperatures are predicted for spiral-rich groups based on their lower observed galaxy radial velocity dispersions of =100-300 km s-1 (Zabludoff & Mulchaey, 1998; Mulchaey & Zabludoff, 1998). Indeed, some of these groups may not even be fully gravitationally-bound much less virialized. Instead, Mulchaey et al. (1996) suggested that this 106 K gas would be most easily detected using absorption-line spectroscopy of background UV-bright sources. Given the expected temperature range for spiral group gas, the UV absorption doublet of O VI 1032, 1038 Å would be the most sensitive indicator. However, the fraction of oxygen which is in the quintuply-ionized state is small (10%) in T 106 K gas with most of the oxygen being in more highly-ionized states (O VII and O VIII), which are detectable in soft X-ray absorption lines. If imaging such sources of diffuse, very soft X-ray emitting gas were possible, then their physical extents, covering factors, densities, metallicities and temperatures could be measured. But this is not currently possible. Following Savage et al. (2014, Paper 1 hereafter) we will term this potential reservoir “warm gas” (T 105-6 K), in contrast to cool (T 104 K), photo-ionized gas and hot (T 106 K) intra-group and cluster gas.
Since the original proposal of Bahcall & Spitzer (1969), it has been suspected that many of the multitude of absorption lines seen in the spectra of high- QSOs are due to galaxy halos. The discovery of the low- Ly “forest” (Morris et al., 1991; Bahcall et al., 1991) with the Hubble Space Telescope (HST) offers us an opportunity to test these theoretical predictions for spiral galaxies and their environments. An FUV QSO absorption-line method for detecting this warm gas is feasible: Broad Ly Absorbers (BLAs) with b-values 40 km s-1 corresponding to 105.0 K (Richter et al., 2004; Lehner et al., 2007; Danforth, Stocke & Shull, 2010; Narayanan, Wakker & Savage, 2009; Savage et al., 2010, and Paper 1) and the O VI 1032,1038 Å absorption doublet associated with these BLAs. But BLAs are very difficult to detect in low or even modest signal-to-noise (S/N) spectra (e.g., S/N 15) obtained with the Goddard High Resolution Spectrograph (GHRS) or the Space Telescope Imaging Spectrograph; (STIS; Lehner et al., 2007; Danforth, Stocke & Shull, 2010; Tilton et al., 2012). Currently, HST’s Cosmic Origins Spectrograph (COS; Green et al., 2012; Osterman et al., 2011) is routinely returning S/N 20 18,000 far-ultraviolet (FUV) spectra in the 1150-1750 Å band.
The COS Science Team has obtained S/N 20 FUV spectra of 14 bright QSOs for the purpose of conducting a sensitive spectroscopic survey, including searching for O VI absorption and BLAs (Paper 1 and Savage et al., 2010, 2011a, 2011b) that could be associated with warm gas. Starting with 54 detected O VI absorption systems containing 85 individual O VI components, Paper 1 identified 54 possibly aligned O VI and Ly components, out of which temperature measurements were possible for 45 of the 54. Of these forty-five, 31 (69%) show association with cool, photo-ionized gas; the remaining 14 aligned components have observed -values which are indicative of T105 K gas and are most likely collisionally-ionized. The O VI in the misaligned O VI components could be produced in warm collisionally-ionized or in cool photoionized-ionized gas. HST/COS is our first opportunity to study these unusual absorbers in some detail; for the most part the warm absorbers studied here are detected at too low a contrast to have been discovered and studied previously (but see Narayanan et al., 2010; Savage et al., 2010, 2011a, 2011b, for early reports from this survey). Despite very high S/N ground-based optical spectra, similar BLA detections have not been made at 2 owing to the density of the photo-ionized Ly forest absorptions at those redshifts.
HST/STIS and COS already have provided the first detailed look at the cooler, metal-enriched clouds in galaxy halos at low redshift using H I absorption with log N 14.0 cm-2 (all column densities herein will be quoted in cm-2) and b-values of 20-30 km s-1 (all b-values will be quoted in km s-1) and metal ion absorption in species such as C II, Si II, Si III, C III, Si IV, C IV, N V and O VI. Targeting specific galaxy halos at 0.2 with COS, Tumlinson et al. (2011) discovered log N 14.3 O VI absorption out to 150 kpc radius around late-type galaxies at high covering factor. While ion states lower than O VI are well-modeled as being in photo-ionization equilibrium (e.g., Werk et al., 2014), the ionization source for the O VI absorption associated with these cool clouds remains controversial (Tripp et al., 2008; Danforth & Shull, 2008; Davé & Oppenheimer, 2007). Stocke et al. (2006), Wakker & Savage (2009) and Prochaska et al. (2011a, b) used STIS archival spectra to make galaxy halo detections serendipitously. These studies showed that O VI absorption extends much further away from galaxies than the lower ions, as much as 1 Mpc away from galaxies, much farther than the virial radius of an L∗ galaxy (see Stocke et al. 2013 for the luminosity-determined virial radius values used herein). These stronger O VI systems are more readily detected in lower S/N COS spectra (e.g., Tumlinson et al., 2011) than the broad, shallow O VI associated with BLAs in the warm absorbers studied here and in Paper 1 in higher-S/N spectra. Often the much stronger, photo-ionized absorbers are present in the same absorber complex with BLAs and aligned O VI. It is the presence of the cooler clouds which ultimately sets the detectability of the warm absorbers in many cases rather than the raw S/N of the spectra.
Werk et al. (2013, 2014); Stocke et al. (2013); Keeney et al. (2013, 2014) and others have studied these cooler clouds using simple photo-ionization modeling to determine approximate physical conditions in cool halo clouds: 104 K; log nHI = -3 to -4 cm-3 and metallicities ranging from 1% solar to slightly super solar. These cloud conditions are inferred by assuming single phase, uniform density clouds in photo-ionization equilibrium with the extragalactic ionizing radiation field. Given the very high covering factors observed for the H I and metal-line absorption ( 100% inside the virial radius of late-type, 0.1L∗ galaxies; Prochaska et al., 2011a; Stocke et al., 2013), these clouds must be quite numerous with a very large total mass. Stocke et al. estimate a total mass in these clouds approaching 1010 M⊙ for L∗ galaxies, comparable to the mass in the parent galaxy disk. Werk et al. (2014) suggest an even larger mass in the photo-ionized clouds.
The O VI absorption lines usually are not included as constraints in this modeling because the O VI may not be photo-ionized in all cases (Davé & Oppenheimer, 2007; Tripp et al., 2008; Danforth & Shull, 2008; Smith et al., 2011; Shull et al., 2012). If the ubiquitous O VI absorption discovered by Tumlinson et al. (2011) is a shock-heated interface between these cool clouds and a hotter medium, then what is the nature of the hotter medium, its physical conditions, extent, total mass, metallicity and source? Based on the few, early warm absorber detections and the properties of the cool clouds, Stocke et al. (2013) hypothesized that this warm reservoir of halo gas could contain 1011 M⊙ of gas. If this is correct, then, as with more virialized groups and clusters of galaxies, this warm halo gas could contain most of the baryons in the system.
Following the lead of Paper 1 (see also Savage et al., 2010, 2011a, 2011b) we use BLA plus O VI absorption to investigate this warm halo gas in the light of the group gas hypothesis. In Section 2 and Appendix A we reanalyze a small fraction of the O VI plus H I absorbers presented in Paper 1 to determine a plausible maximum number of warm absorbers. The detailed component model fits for these few warm absorber candidates are shown in the Appendix A, for which a summary of results is provided at the end of Section 2.
In Section 3 the galaxy environment of the low- warm absorbers is presented. Since the data in-hand comes from wide-field multi-object spectroscopy (MOS) on 4m-class telescopes, it is not exceptionally deep, limiting discussions of warm absorber environments to 0.15. A comparison between warm absorber environments and those in which cooler, photo-ionized absorbers are found also is presented. Sections 3.4 and 3.5 provide a summary of the inferences from the galaxy group analysis. Section 4 describes the major pieces of evidence that favor the hypothesis that these warm absorbers are the detection of a massive reservoir of gas in spiral galaxy groups. Section 5 summarizes the main results of this study. Throughout this paper we use the WMAP-9 cosmology with H0= 70 km s-1 Mpc-1 (Hinshaw et al., 2013).
2. Broad Lyman Alpha in Warm Gas at K
Paper 1 presented an investigation of all 14 high-S/N COS FUV spectra obtained by the COS Science Team’s Guaranteed Time Observations (GTO). These 14 sightlines were chosen to provide the highest quality FUV spectra in the shortest observing time. In these spectra Paper 1 identified 14 potential warm absorbers defined as having inferred temperatures T 105 K based on their Ly and O VI thermal line widths in systems for which the H I and O VI absorptions are aligned in velocity. The thermal (T) and non-thermal (NT) widths of these absorption lines were determined from the observed H I and O VI line widths by assuming that the NT width is independent of species while the T width is inversely proportional to the square root of atomic weight. Also these different species must arise in the same parcel of gas, an assumption allowed for but not demanded by their alignment in velocity. For this type of analysis to be robust, several species, not just H I and O VI, are required, but are generally not available.
One physical source of line-broadening not specifically addressed in Paper 1 is Hubble flow broadening. Because later in this paper we will propose that these warm absorbers might be associated with groups of galaxies requiring their physical extents to be 1 Mpc, significant Hubble flow broadening could be present if the associated galaxy groups are not gravitationally-bound. As with other NT broadening mechanisms, if Hubble flow were important it would require near equality of H I and O VI b-values (as well as for other species detected) and so would be taken into account in the analysis of Paper 1. A few of the identified “warm absorber” systems do have significant values, which could be Hubble broadening but this does not alter the temperature determinations found herein.
Paper 1 also identifies two broad O VI absorbers without associated Ly absorption, PKS 0405-123/0.16716 (Savage et al., 2010) and PHL 1811/0.13280 (Paper 1; Figure 10d) which are likely warm absorbers (throughout this paper we identify a particular absorber by its sightline/redshift). Although they do not meet the selection criteria adopted in Paper 1 because a BLA is not detected, their inferred T 105 K makes these probable warm absorbers. Except for the few potential warm absorbers described here and reanalyzed in Appendix A, we adopt the classification of the other 30 H I O VI absorbers from Paper 1 as “cool” photo-ionized absorbers and “misaligned” H I Ly/O VI absorbers.
| Sight Line | aligned? | new fit | Comments | |
|---|---|---|---|---|
| PKS 2155304 | 0.05722 | NO | NO | Ly complex; possible O VIII absorption |
| 3C 273 | 0.09010 | NO | Fig. 12 | probable red wing to Ly |
| PG 1116215 | 0.13850 | YES | Fig. 13 | suggested by Paper 1 |
| PHL 1811 | 0.17651 | NO | NO | |
| H 1821643 | 0.17036 | NO | NO, Fig. 15 | O VI absorption very weak |
| Ton 236 | 0.19457 | YES | Fig. 16 | broad absorber location uncertain |
| HE 01534520 | 0.40052 | YES | NO | |
| PKS 0405123 | 0.09657 | YES | NO | O VI association with broad or narrow H I ? |
| PKS 0405123 | 0.29770 | YES | Fig. 17 | |
| 3C 263 | 0.11389 | NO | NO | BLAs without associated O VI |
Here we adopt a complementary tactic in reanalyzing a few of the Paper 1 potential warm absorbers by starting with the O VI line profile and width, which is often less confused by lower temperature (i.e., cool, photo-ionized) absorption than the BLA. If the O VI data comes from COS, then the S/N is usually sufficient to determine if the profile is symmetrical enough to be well-fit with a single Gaussian profile. In some cases where H I Ly is detected by COS at low-redshift ( 0.12), the O VI lines are in the spectroscopic band covered by the Far Ultra-violet Spectroscopic Explorer (FUSE) satellite; for these 14 very bright targets FUSE spectra often possess the quality to permit such an assessment as well. We do not reanalyze those absorbers with complex O VI line profiles, arguing that in these cases there is ample evidence for considerable turbulent or component motion. However, for those O VI absorbers well-fit with a single, smooth Gaussian component, we assume that the observed O VI width is almost entirely thermal. While this is not guaranteed, it would be quite unlikely (but not impossible) for turbulent or component motion to mimic a single Gaussian profile. We then determine whether the Ly profile is consistent with a broader, thermal Gaussian profile at a velocity consistent with the O VI thermal width. An alignment between the BLA and the O VI absorption and log T(K) 5.0 are required for an absorber identification as “warm”. In some cases the S/N is insufficient to make this determination while in others a symmetric Gaussian is not a good fit to the O VI profile or the O VI does not align with the BLA. In these cases we do not attempt a reanalysis and we adopt the spectral fits presented in Paper 1 as final. In fact, all line-fits derived in Paper 1 are fully acceptable but, owing to blends of broad, shallow components and saturated cool components, the Ly line widths and velocity centroids are uncertain in some cases.
We emphasize that the Ly line fits, whether in Paper 1 or herein, are inherently uncertain due to the complex superposition of “warm” and “cool” components to the absorption. And in some cases the uncertainties in the temperature estimates are large, although almost all absorbers classified as “warm” are unambiguously at log T(K) 5.0.
Scrutiny of the O VI absorbers in Paper 1 finds only seven cases where a reanalysis is suggested by the O VI line profile (see Table 1). In these cases the O VI absorption profile is symmetric but Paper 1 identified a large proportion of the line width as NT or did not find a corresponding Ly component aligned with the O VI. Table 1 contains the identification of these seven absorbers by sightline and redshift, listing b-values, whether the Ly and O VI components are aligned in velocity as determined in Paper 1, whether a new fit is presented herein and whether a new warm absorber is proposed. The intent of these reanalyses is to determine if more warm absorbers could be present in this sample if a different approach to the line-fitting is performed. These reanalyses were performed by an independent set of co-authors (JTS, CWD) from the analysis in Paper 1.
To this list we have added three absorbers which were not classified as broad, symmetric and aligned by Paper 1, PKS 2155-304/0.05722, PG 1116+215/0.13850 and 3C 263/0.11389. The former absorber has a tentative O VIII absorption detection in a Chandra ACIS/LETG grating spectrum (Fang, Canizares, & Yao, 2007) indicative of warm gas if the O VIII absorption is real. The second absorber possesses a very symmetric O VI line profile and weak broad wings to Ly, which were ascribed to non-thermal motion in Paper 1. The third absorber has a BLA that appears to be consistent in its large -value between Ly and Ly but has no associated O VI. The detailed reanalysis of each of these absorbers can be found in Appendix A, from which we now summarize the results.
Our reanalysis found that in six cases there was no reasonable alternative to the model solutions found by Paper 1, so that for these six absorbers and all others not reanalyzed, we adopt the model solutions presented in Paper 1 (see Table 2 and Paper 1, Table 5 for a list of the warm absorbers in order of their quality). An updated solution is suggested only for four absorbers, which are presented in Table 3 and summarized below.
(1) In the case of 3C 273/0.09010 a fourth Ly component aligned with the O VI was added but
with poorly constrained -values. For our best-fit result, the -values derived suggest that a
warm absorber probably is present.
(2) For PG 1116+215/0.13850 our reanalysis finds that a much broader fit to
Ly is plausible, which is a better match to the broad, symmetric O VI profile. This new
solution obviates the need for an absorber model which is dominated by NT
motions despite having O VI 1032, 1038 Åline profiles which are demonstrably smooth and symmetric to
the limits of the COS signal-to-noise. In this new model the broad absorber has line profiles which
are dominated by thermal broadening and a high value of log T(K)=5.6.
(3) For Ton 236/0.19457 a viable, alternative fit is suggested which does not differ
significantly from the results of Paper 1 and the presence of a single “warm absorber” is confirmed
but with a hotter temperature (log T(K)=5.8) than the Paper 1 solution.
(4) For PKS 0405-123/0.29770 we have found that a very broad Ly absorber aligned with the
broad O VI absorption can be fit to the data. Thus, we consider the existence of this warm absorber
at log T(K)=5.7 as probable.
| Sight Line | ||||||
|---|---|---|---|---|---|---|
| (cm-2) | (km s-1) | (cm-2) | (km s-1) | (K) | ||
| HE 01534520 | 0.22600 | |||||
| Mrk 290 | 0.01027 | |||||
| H1821643 | 0.26656 | |||||
| 3C 263 | 0.14072 | |||||
| PKS 0405123 | 0.49507 | |||||
| Mrk 876 | 0.00315 | |||||
| 3C 273 | 0.00336 | |||||
| PHL 1811 | 0.15785 | |||||
| HE 02264110 | 0.20701 | |||||
| H 1821643 | 0.22497 | |||||
| H 1821643 | 0.12141 | |||||
| PHL 1811 | 0.07773 | |||||
| HE 02381904 | 0.47204 | |||||
| H 1821643 | 0.17035 | |||||
| PKS 0405123 | 0.16716 | aaHI non-detection | ||||
| PHL 1811 | 0.13280 | bbMarginally detected |
| Sight Line | ||||||
|---|---|---|---|---|---|---|
| (cm-2) | (km s-1) | (cm-2) | (km s-1) | (K) | ||
| 3C 273 | 0.09010 | |||||
| PG 1116215 | 0.13850 | |||||
| Ton 236 | 0.19457 | |||||
| PKS 0405123 | 0.29770 |
| Sight Line | ||||||
|---|---|---|---|---|---|---|
| (cm-2) | (km s-1) | (cm-2) | (km s-1) | (K) | ||
| PG 0953+414 | 0.00212 | |||||
| HE 0226-4110 | 0.01750 | |||||
| H 1821+643 | 0.02443 | |||||
| PG 1259+593 | 0.04625 | |||||
| PG 1259+593 | 0.04625 | |||||
| PG 1116+215 | 0.05897 | |||||
| PG 0953+414 | 0.06808 | |||||
| 3C 273 | 0.12007 | |||||
| PG 0953+414 | 0.14231 | |||||
| PG 0953+414 | 0.14213 | |||||
| HE 0153-4520 | 0.14887 |
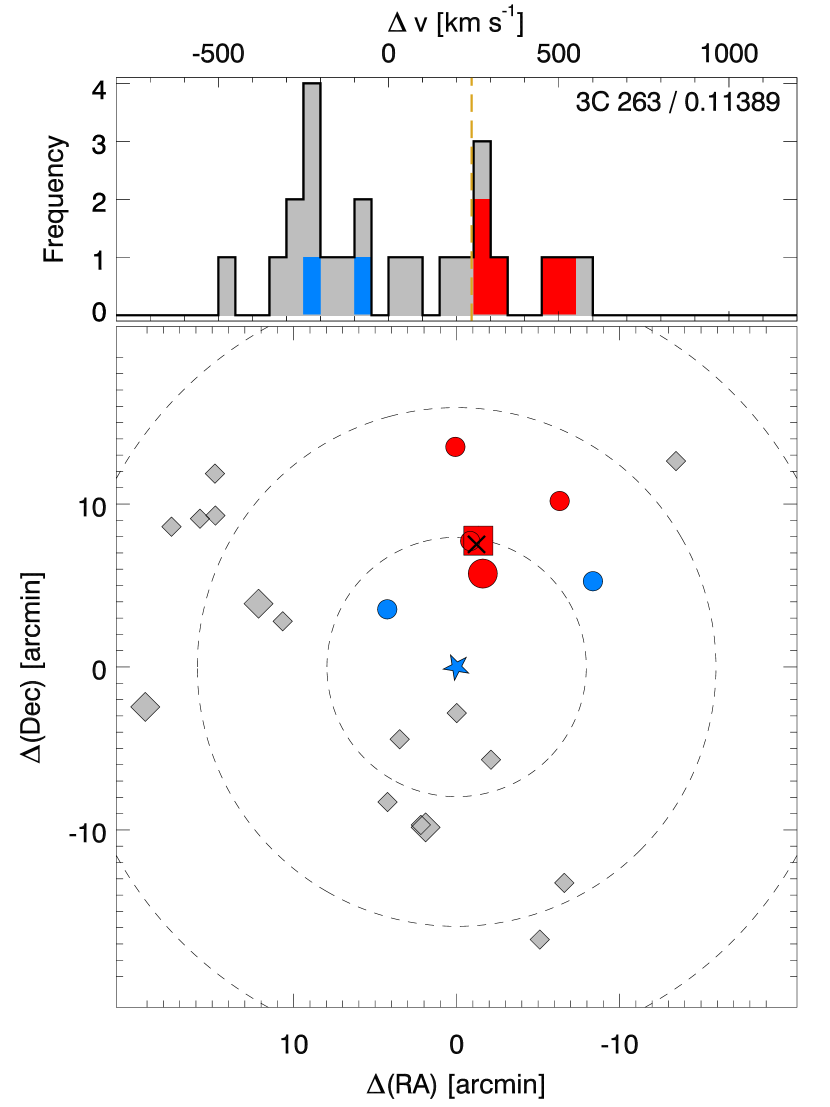
In addition, for the 3C 263/0.11389 absorber we confirm the detailed fits in Paper 1 but also find that a warm absorber is possibly present based on a smooth, symmetric BLA detected consistently in Ly (i.e., both line-fits yield consistent column densities and -values). There is no detection of O VI absorption coincident with this BLA.
With these revisions there is a net gain of three warm absorbers to the BLA broad O VI list. By including the two O VI-only absorbers from Paper 1 (PHL 1811/0.13280 and PKS 0405-123/0.16716) as also being probably warm, a total of as many as 20 warm absorbers can be present in this sample. (The possible warm absorber, 3C 263/0.11389, is not included in this tally). The distribution of temperature values for the 20 members of the COS/GTO warm absorber sample is shown in Figure 1. Unlike the initial discovery of the O VI-only system PKS 0405-123/0.16716 (Savage et al., 2010), most of the derived temperatures are below T106 K. Tables 2 and 3 provide the basic observational data for all of the warm absorbers in this sample. Table 2 compiles the spectral data from Paper 1 for the warm absorbers for which we have adopted the Paper 1 line-fits. Table 3 lists the same information for the warm absorbers for which this paper supplies revised line-fits (see Appendix A). Table 4 provides the same observational data for the sample of low- “cool”, photo-ionized absorbers which are used for statistical purposes herein (11 from Paper 1 and two, PG 1259+593/0.04625a and b, added from another high-S/N COS spectrum and which is described in Danforth et al. (2014)).

Due largely to the presence of narrow Ly and O VI components that are plausibly cool halo clouds and their shocked interfaces (Tumlinson et al., 2011; Stocke et al., 2013) and due somewhat to the limited S/N of the COS spectra, we cannot dismiss the possibility that very low contrast, very broad ( 100 km s-1) Ly lines are present in some of these absorber complexes. We can state that their presence is neither required by the constraints of the O VI and Ly line fits of Paper 1 nor by the reanalysis in the Appendix. But as the very high S/N COS spectra of 3C 273, PKS 2155-304 and PKS 0405-123 show, it is the presence of the cooler component absorption, not the S/N, which is the major hindrance in discovering more warm absorber systems. These limitations are difficult to quantify, so we make no attempt to do so. Rather we determine the total pathlength for discovering warm absorbers using a simplified calculation set by the S/N of the COS spectra alone.
The pathlength (z) for warm absorber discovery is estimated using the entire redshift path of the 14 QSOs observed in this program minus the obscuration created by the Galactic damped Ly line plus the high and low ionization metal lines that arise in the Galactic disk or halo. In this case we obtain a z= 4.0 (see Danforth et al., 2014) and the number of warm absorbers per unit redshift, = 3.5–5 based on the range in the number of warm absorbers in these 14 sightlines: 14 proposed by Paper 1; 20 by this paper. This is approximately 4 times the for Mg II/Lyman limit system absorbers, which are thought to be optically-thick clouds in extended galaxy halos of radius 100 kpc with high covering factors (Steidel, 1995; Churchill et al., 2000; Kacprzak et al., 2010, 2011). If the warm absorbers also are associated only with luminous galaxies similar to the Mg II absorbers, their numbers suggest an absorber size of 200 kpc, comparable to the virial radius of an L∗ galaxy. As with the class of Mg II absorbers this inference needs to be confirmed by detecting galaxies associated with these warm absorbers. Luckily the combination of HST/COS and FUSE UV spectroscopy provides some detections at very low redshift by historical absorption line standards (i.e., 0.15) whose fields can be searched for associated galaxies.
3. Galaxy Groups Associated with O VI Absorbers
In order to determine the galaxy environment of the warm and cool absorbers (see Tables 2, 3 & 4 for a summary of observed properties of the warm and cool absorbers considered here), we have used a combination of large-area redshift surveys like the Sloan Digital Sky Survey (SDSS) and the 2dF survey done at the Anglo-Australian Telescope (AAT) and our own multi-object spectroscopy (MOS) program centered on the sightlines observed by the COS Science Team. Stocke et al. (2006, 2013) contains a description of our use of the large-area sky survey redshift catalog, which includes targeted observations made by others of specific sightlines in this survey (e.g., Morris et al., 1993; Tripp et al., 1998; Chen & Mulchaey, 2009; Prochaska et al., 2011b; Johnson, Chen & Mulchaey, 2013). Our new observations include all but one of the 14 sightlines in Paper 1 and extend –3 magnitudes deeper than the SDSS (Keeney et al., 2014); the H 1821+643 field has not yet been observed by our survey because the target was observed with COS only recently (the only galaxy redshift observations in this region were reported by Tripp et al. (1998) and have a somewhat uncertain depth and breadth reported). For these 14 sightlines spectra and redshifts were obtained mostly at the Wisconsin-Indiana-Yale-NOAO (WIYN) 3.5-m telescope using the HYDRA MOS. Additional observations of southern targets were obtained at the Cerro-Tololo Inter-American Observatory’s (CTIO) 4m Blanco Telescope using the version of HYDRA available there. A few additional southern targets were observed at the AAT using the AAOmega MOS system. Occasional long-slit spectra of galaxies nearest to absorbers were obtained at the Apache Point Observatory (APO) 3.5m telescope using the Dual-Imaging Spectrograph (DIS). Individual galaxy redshifts from this survey have typical velocity errors of 30 km s-1.
| Sight Line | |||||||||||||
|---|---|---|---|---|---|---|---|---|---|---|---|---|---|
| () | (kpc) | () | () | (kpc) | () | () | () | () | |||||
| Mrk 876 | 0.00315 | 0.25 | 188 | 1.65 | 0.30 | 4 | 279 | 0.93 | 90 | 104 | 0.019 | ||
| 3C 273 | 0.00336aaThe closest group galaxy to the QSO sight line is a galaxy at kpc (), but it has a large velocity separation of with respect to (Stocke et al., 2004). | 0.021 | 77 | 1.20 | 32 | 161 | 525 | 0.37 | 537 | 491 | |||
| Mrk 290 | 0.01027 | 1.7 | 434 | 2.00 | 6.0 | 24 | 814 | 1.00 | 302 | 282 | 0.011 | ||
| PHL 1811 | 0.07773bbThe closest group galaxy to the QSO sight line is a galaxy at kpc (), but it has a large velocity separation of with respect to (Jenkins et al., 2003). | 0.94 | 310 | 1.75 | 55 | 126 | 410 | 0.24 | 333 | 591 | 0.060 | ||
| H 1821+643 | 0.12141 | 2.3 | 158 | 0.65 | 34 | 0.19 (659) / 1.2 | |||||||
| PHL 1811 | 0.13280 | 3.0 | 227 | 0.87 | 26 | 30 | 1114 | 0.85 | 568 | 458 | 0.19 | ||
| PG 1116+215 | 0.13850 | 1.5 | 138 | 0.67 | 3.8 | 4 | 568 | 0.81 | 50 | 242 | 0.33 | ||
| 3C 263 | 0.14072 | 1.7 | 620 | 2.88 | 39 | 0.34 |
| Sight Line | |||||||||||||
|---|---|---|---|---|---|---|---|---|---|---|---|---|---|
| () | (kpc) | () | () | (kpc) | () | () | () | () | |||||
| PG 0953+414 | 0.00212 | 0.025 | 227 | 3.44 | 1.5 | 13 | 722 | 1.40 | 179 | ||||
| HE 0226–4110 | 0.01750 | 2.8 | 596 | 2.32 | 98 | 25 | 21 | 911 | 0.69 | 456 | 0.003 (643) / 0.15 | ||
| H 1821+643 | 0.02443 | 1.7 | 1255 | 5.75 | 40 | 3.7 | 4 | 1260 | 1.82 | 72 | 240 | 241 | 0.008 (148) / 0.048 (891) / 1.2 |
| PG 1259+593 | 0.04625 | 0.50 | 138 | 0.96 | 9.6 | 23 | 352 | 0.37 | 34 | 329 | 0.032 (1095) / 0.24 | ||
| PG 1116+215 | 0.05897 | 0.13 | 131 | 1.40 | 297 | 9.3 | 16 | 334 | 0.36 | 340 | 326 | 0.053 (1376) / 0.49 | |
| PG 0953+414 | 0.06808 | 0.88 | 607 | 3.50 | 306 | 8.4 | 14 | 913 | 1.01 | 318 | 316 | 0.072 (1572) / 0.63 | |
| 3C 273 | 0.12007 | 6.2 | 2119 | 6.36 | 11 | 4 | 2009 | 2.10 | 19 | 80 | 346 | 0.42 (1306) / 2.0 | |
| PG 0953+414 | 0.14231 | 4.7 | 438 | 1.43 | 128 | 9.5 | 6 | 331 | 0.35 | 123 | 270 | 329 | 0.35 |
| HE 0153–4520 | 0.14887 | 2.5 | 1081 | 4.37 | 227 | 3.5 | 3 | 1084 | 1.60 | 210 | 145 | 235 | 0.24 |
| Sight Line | |||||||||||||
|---|---|---|---|---|---|---|---|---|---|---|---|---|---|
| () | (kpc) | () | () | (kpc) | () | () | () | () | |||||
| Mrk 876 | 0.01169 | 0.10 | 266 | 3.03 | 11 | 0.26 | |||||||
| PKS 2155–304 | 0.05422aaThis absorber and the absorber at in the PKS 2155–304 sight line are associated with the same group of galaxies. The closest galaxy to the higher redshift absorber is the galaxy with the smallest impact parameter from this absorber, but it has a large velocity difference of . | 3.7 | 544 | 1.95 | 17 | 8 | 380 | 0.33 | 648 | 403 | 0.087 (636) / 0.13 | ||
| PKS 2155–304 | 0.05722 | 3.0 | 429 | 1.65 | 17 | 8 | 380 | 0.33 | 403 | 0.097 (669) / 0.14 | |||
| 3C 263 | 0.06342 | 0.21 | 63 | 0.58 | 0.062 (1472) / 0.30 | ||||||||
| 3C 273 | 0.09010 | 1.9 | 478 | 2.14 | 24 | 13 | 1833 | 1.43 | 89 | 445 | 0.24 (1014) / 1.1 | ||
| PKS 0405–123 | 0.09192 | 0.020 | 72 | 1.14 | 104 | 0.41 | 5 | 115 | 0.35 | 210 | 115 | 0.004 (500) / 0.14 | |
| 3C 263 | 0.11389 | 1.2 | 982 | 5.08 | 318 | 4.8 | 7 | 958 | 1.27 | 245 | 270 | 262 | 0.21 |
The MOS grating setup was selected to obtain good throughput just long-ward of 4000 Å so that Ca II H & K might be detectable even for faint and diffuse targets at low redshift. At WIYN the field-of-view (FoV) corresponds to 6.7 Mpc at and so is excellent for determining the large-scale environment of low- absorbers. The FoVs at the CTIO 4m ( Mpc at ) and at the AAT ( Mpc at ) are also good matches to this goal. The % completeness magnitude for our observations at WIYN/HYDRA (in approximately two-hour exposure times) is . The 90% completeness limit at AAT/AAOmega is , but CTIO’s HYDRA system is less efficient than its counterpart at WIYN, with the CTIO observations being 90% complete to . A mag limit corresponds to at and at . Since it is necessary to find other associated galaxies at least 2 magnitudes fainter than in order to determine with some confidence if a small galaxy group is present or not, this 4m MOS survey is excellent for determining details of the galaxy environments only at . And it will provide some preliminary information for , but little detail in most cases at . Details of the wide-angle 4-m galaxy survey work can be found in Keeney et al. (2014).
3.1. Procedure for Defining Groups of Galaxies Associated with Absorbers
In this discussion and throughout this paper we use the term “galaxy group” to describe the large-scale (2-5 Mpc) galaxy environment of the absorbers studied here. We have defined these groups entirely by the observational properties provided by individual galaxy redshifts and sky locations using a “friends-of-friends” (FoF) approach similar to that employed by Berlind et al. (2006, 2008) using the SDSS data; i.e., we do not require detections of soft X-ray bremsstrahlung, which occurs only in elliptical-dominated groups (Mulchaey, 2000), nor a theoretically-inferred dark matter halo mass threshold. Indeed, most of the groups we have found do not contain early-type galaxies nor are they known sources of diffuse, soft X-ray emission but rather these groups are similar in galaxy content to spiral-rich groups found in the Local Supercluster (e.g., the M101/M51 group or the M96 group; see Section 3.2). Our use of the term “galaxy group” does not necessarily imply that these physical entities are either bound or virialized. Using standard crossing time arguments (Pisani, Ramella & Geller, 2003; Berlind et al., 2006), the velocity dispersions measured for these groups are sufficient for only one or two crossing times in a Hubble time. Further, many of these groups do not have Gaussian-distributed velocity distributions and physical locations required for such arguments to be robust (see the velocity distributions and galaxy locations for these groups in Figures 2, 3 & 4). Therefore, by using the term “galaxy group”, we imply only that these absorbers are surrounded by large and small galaxies in their vicinity, for which we have measured velocity distributions whose dispersions provide characteristic kinetic energies to which the gas kinetic energies can be compared using the COS-observed line-widths. Deeper spectroscopic observations for many of these groups are underway to further characterize the group memberships and velocity distributions; present observations limit a detailed discussion of group properties to all absorbers at and a few others out to 0.15, based on the depth to which galaxy surveys have been completed in those regions.
Tables 5, 6 & 7 list the basic characteristics of nearest galaxies and galaxy groups found around the QSO sightlines at the redshifts of the absorbers. For each absorber in these tables the galaxy group was identified and its membership defined using an FoF analysis (e.g., Berlind et al., 2006). Table 5 lists the galaxy environment data for the warm absorbers at . Similar data are shown in Table 6 for absorbers judged to be in photo-ionization equilibrium (i.e., “cool” absorbers at ) and Table 7 for absorbers whose and O VI absorption lines are “misaligned” so that no unambiguous model can be constructed for these absorbers (see Paper 1 for details). Information in these Tables includes (in columns 1 & 2) the sightline and absorber redshift; (3) the nearest galaxy luminosity (Lng) in L∗ units; (4) the impact parameter () to the nearest galaxy in kpc; (5) the impact parameter as a fraction of the virial radius of the nearest galaxy (Rvir). The virial radii for the nearest galaxies are calculated using the “halo matching” scaling between luminosity and virial radius due to Moster et al. (2013) as shown in Figure 1 of Stocke et al. (2013); (6) the velocity difference between the absorber and the nearest galaxy (vng) in km s-1 ( 30 km s-1); (7) the integrated group luminosity using all group galaxies observed (Lgrp) in L∗ units; (8) the number of galaxies in the group (Ngrp); (9) the impact parameter () to the group centroid in kpc; (10) the group impact parameter in units of the virial radius (Rvir). The virial radii for the galaxy groups were calculated using in solar units, which is close to the mean value for groups of the richness found (see discussion below); (11) the velocity difference between the absorber and the group mean velocity (vgrp) in km s-1 ( 30 km s-1); (12) the group velocity dispersion ( and its associated error; see detailed discussion below) in km s-1. Values and errors are listed for all groups with 8. Single valued estimates are made for groups with 3 (see detailed discussion below); (13) a second estimate of the group velocity dispersion assuming that the observed group is virialized using the procedure of Bryan & Norman (1998, see detailed discussion below); and (14) the galaxy survey 90% completeness limit (Lcomp) in L∗ units at the absorber redshift out to 2 Mpc radius from the sightline.
The velocity differences between absorbers and galaxies (column 6) or groups (column 11) are computed as follows: . Due to the range in redshifts and the variation in galaxy survey work along these sightlines, the completeness limits (column 14) can vary substantially. In some cases the completeness luminosity is a function of impact parameter; e.g., the H 1821+643/0.12141 field has deeper MMT/MOS close to the sightline as reported by Tripp et al. (1998). In these cases the completeness luminosity is listed with its associated impact parameter (in kpc) in parentheses and the narrow/deep survey limit separated from the broad/shallow survey limit by a “/” in column (14).
Our group finding algorithm has several steps. In each case we start with a catalog of all galaxies within of the absorber redshift with impact parameters Mpc from the QSO sight line. Then we use an FoF algorithm to search for galaxies associated with the closest galaxy to the QSO sight line. In our FoF algorithm each galaxy has individualized linking lengths equal to on the sky and five times larger than that in velocity space to match the relative scalings between the plane-of-the-sky linking length and the redshift linking length ( and ) from Berlind et al. (2006). In order to make sure that we have investigated a large enough volume around the absorber to locate all group members, we proceed as follows. We assume that all of our potential groups have in solar units, which provides a scaling relation between a group’s luminosity and its radius and velocity dispersion (this mass-to-light ratio is close to the median value for the groups we have found (see analysis associated with Figure 1 in Stocke et al., 2013)). Using the preliminary group luminosity, Lgrp, we then estimate the “virialized” group radius and velocity dispersion using:
| (1) | ||||
| (2) |
where we have assumed (Hinshaw et al., 2013), (Bryan & Norman, 1998), and (Shull et al., 2012). Since all of our groups have , we ignore any evolution of or with redshift. While we make no correction in this calculation to account for galaxies with luminosities below our completeness limit, such a correction is small in all cases for which there are sufficient group galaxies identified to quote reliable velocity disperisons (N 8). Values calculated using equation (2) above are listed in column (13) of Tables 5, 6 and 7. After the values of and are calculated, we check to ensure that our search volume is large enough to include from the group redshift and from the group center. If it is not, then we expand the search volume, determine a new FoF group with updated values of and , and iterate until our search volume satisfies these criteria.
Once this process is complete we use the FoF group as the first step in an iterative procedure within the final search volume to define the final group membership. At each step we determine the group’s center on the sky and in redshift space and identify all galaxies (i.e., not just those identified as members in the previous step) within of the group redshift and of the group center as being group members. We then repeat this process until the group membership does not change from one iteration to the next. Usually the group membership converges in iterations.
We have utilized the robust statistics described in Beers, Flynn & Gebhardt (1990) to minimize the effect of potentially spurious group members on the physical quantities of interest for our groups. The geometric center of the group on the sky and the group redshift are determined using the bi-weight location estimator, and the group’s velocity dispersion () is calculated using the “gapper” scale estimator (Beers, Flynn & Gebhardt, 1990), which involves ordering the recession velocities from smallest to largest and defining weights, , and gaps, , such that:
| (3) | ||||
The rest-frame velocity dispersion of the group is then:
| (4) |
These values are listed in column (12) in Tables 5, 6 and 7.
Our group finding procedure must indicate that a putative group has more than two members for us to quote any group properties. For groups with 3–7 members we list tentative group properties with approximate velocity dispersions (see column 12 for listings without formal error estimates). When a group has members we estimate the 90% confidence interval of the velocity dispersion with an “ out of ” bootstrap method using 10,000 resamplings of size , where is chosen using the prescription of Bickel & Sakov (2008). When a group has members we quote the dispersion returned by the gapper estimator without error bars because we have too few samples of the parent distribution to generate reliable confidence intervals. These 90% confidence errors are much greater than the typical uncertainty of our galaxy redshifts ( ). The measured velocity dispersion, , usually agrees remarkably well with that predicted solely from the group’s luminosity, (see Equation 2), and for groups with members is within the 90% confidence interval of for all but one case, PG 1116+215/0.05897, whose values differ by an amount just greater than the estimated 90% confidence interval. We take the general agreement between these two values as an indication that our group identifications are relatively secure and that most of these systems are close to being virialized.
Associated groups with 8 members may have significantly larger dispersions than we have calculated (Beers, Flynn & Gebhardt, 1990; Zabludoff & Mulchaey, 1998; Osmond & Ponman, 2004; Helsdon, Ponman & Mulchaey, 2005); for this reason we have not quoted errors on these values. Deeper observations are required to characterize these groups adequately since both their group boundaries and memberships and also their velocity dispersions can change appreciably with the discovery of a few new group members. Basic galaxy identifiers, sky positions and redshifts for all group members shown in Figures 2, 3 and 4 ( 8) can be found in Appendix B. Full galaxy redshift results from our on-going survey along these and other COS sightlines can be found in Keeney et al. (2014).
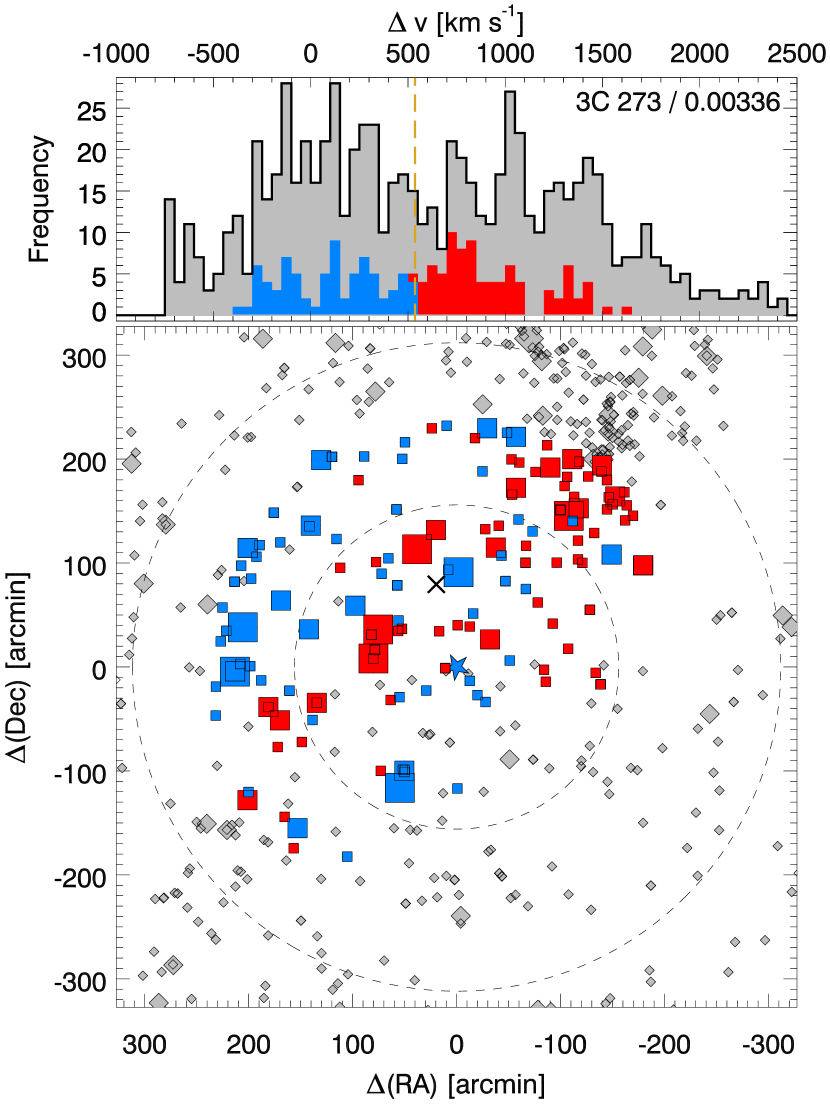
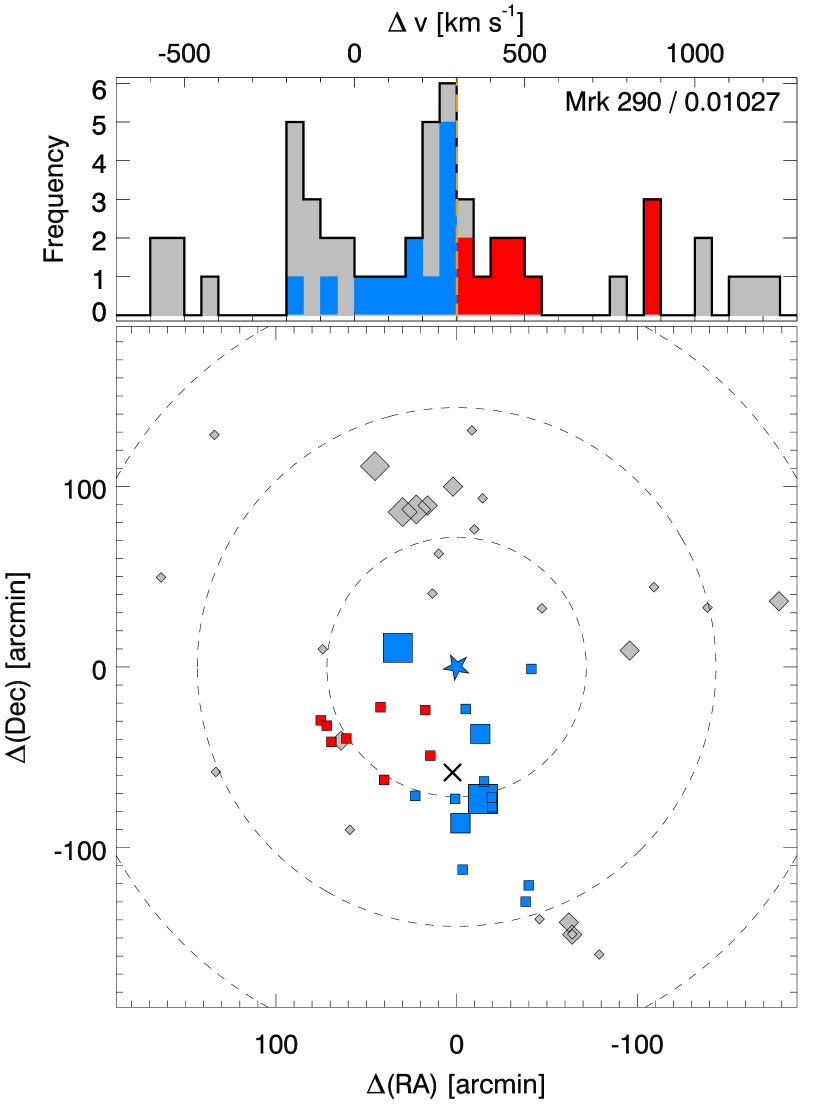
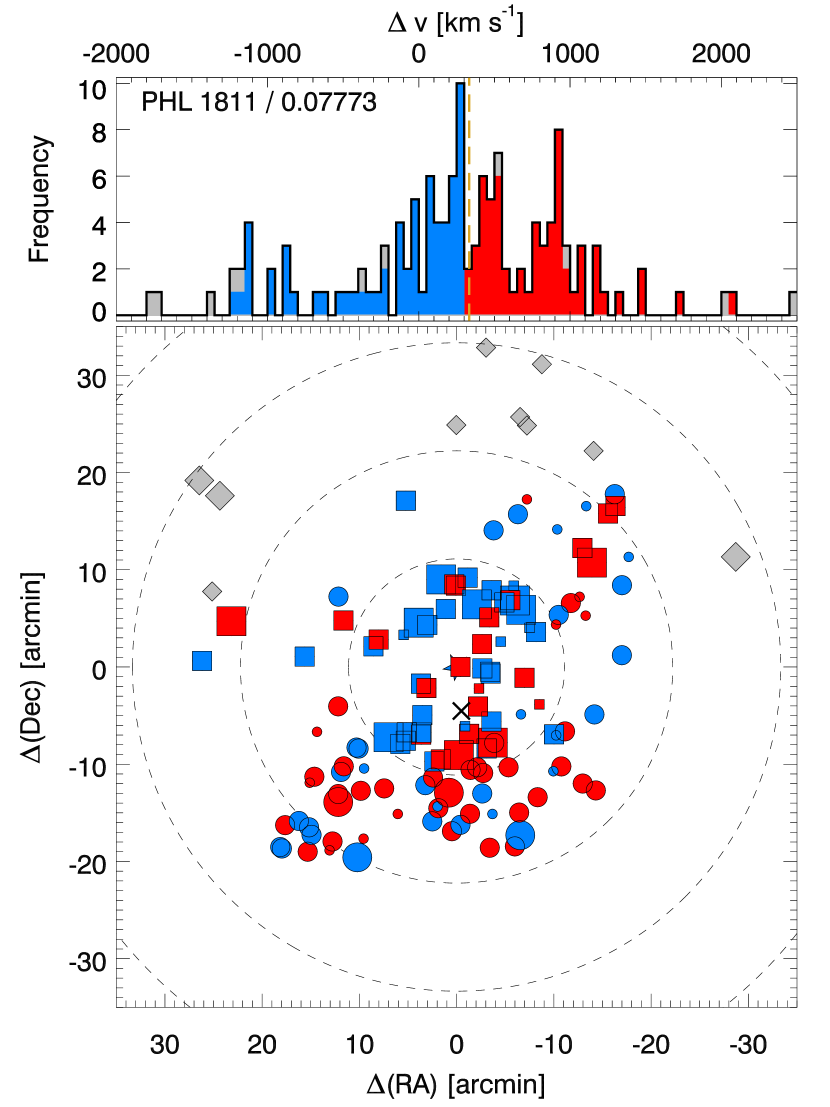
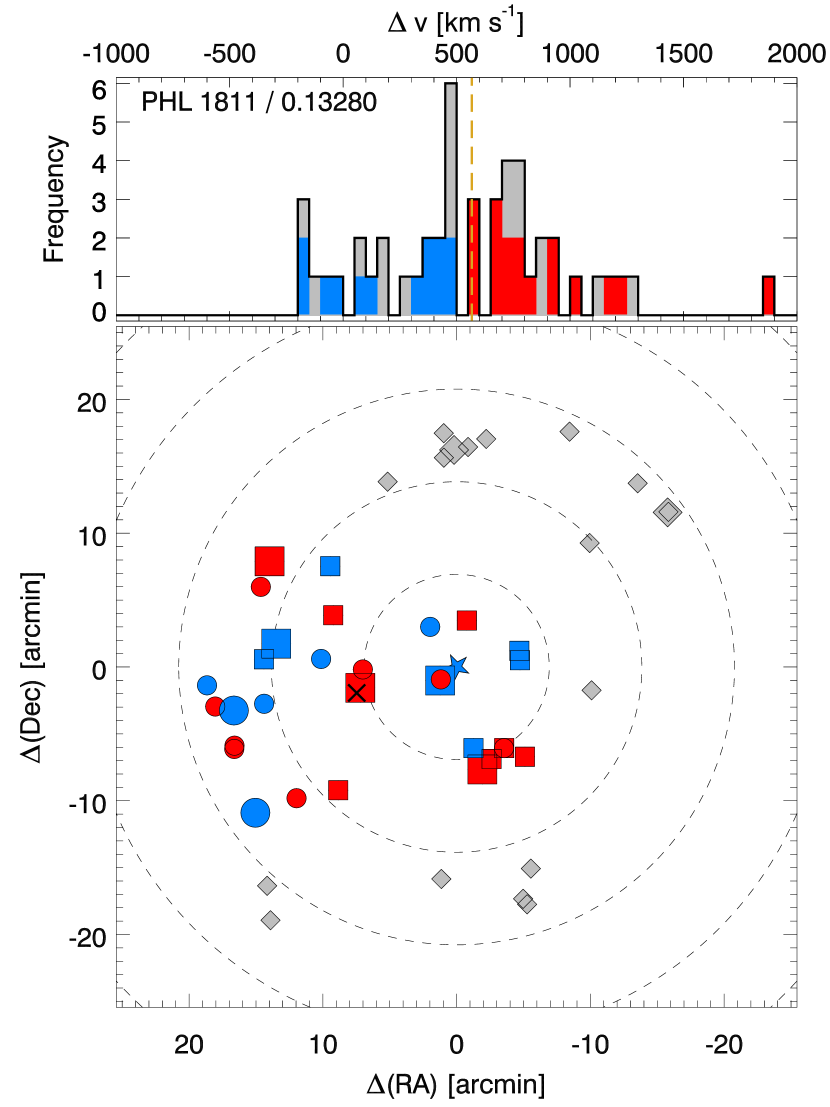

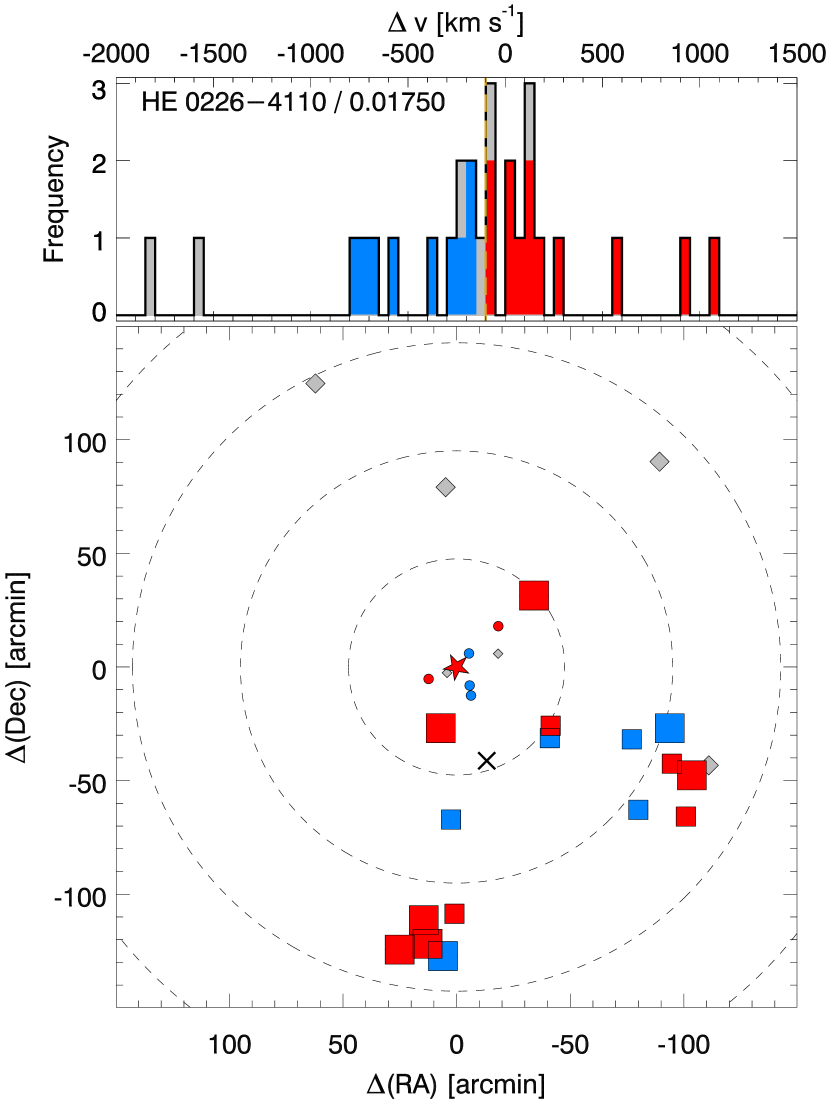

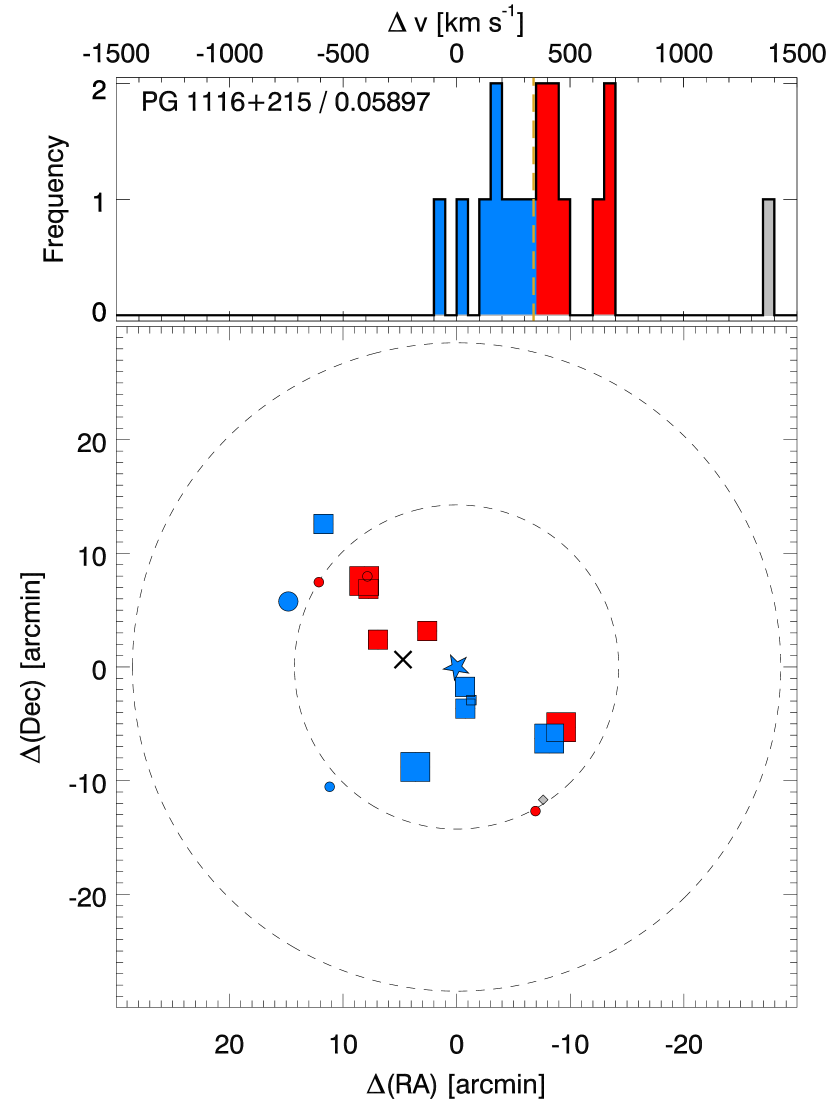

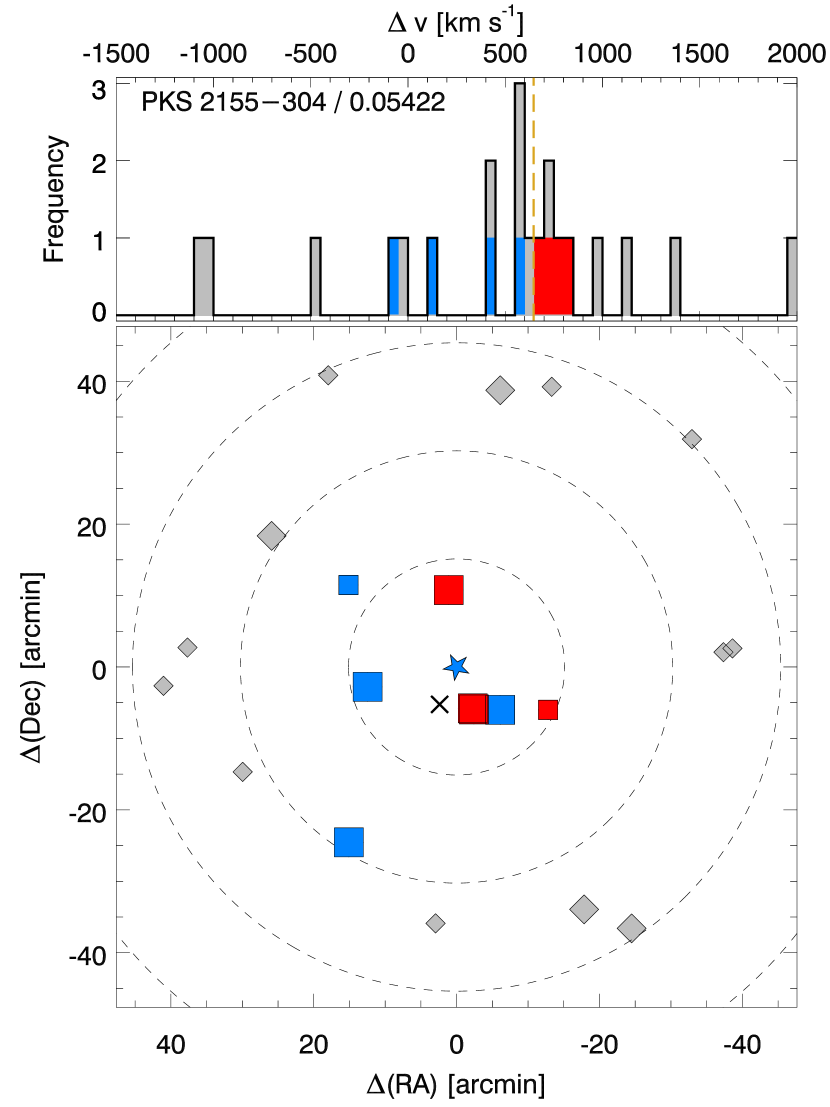
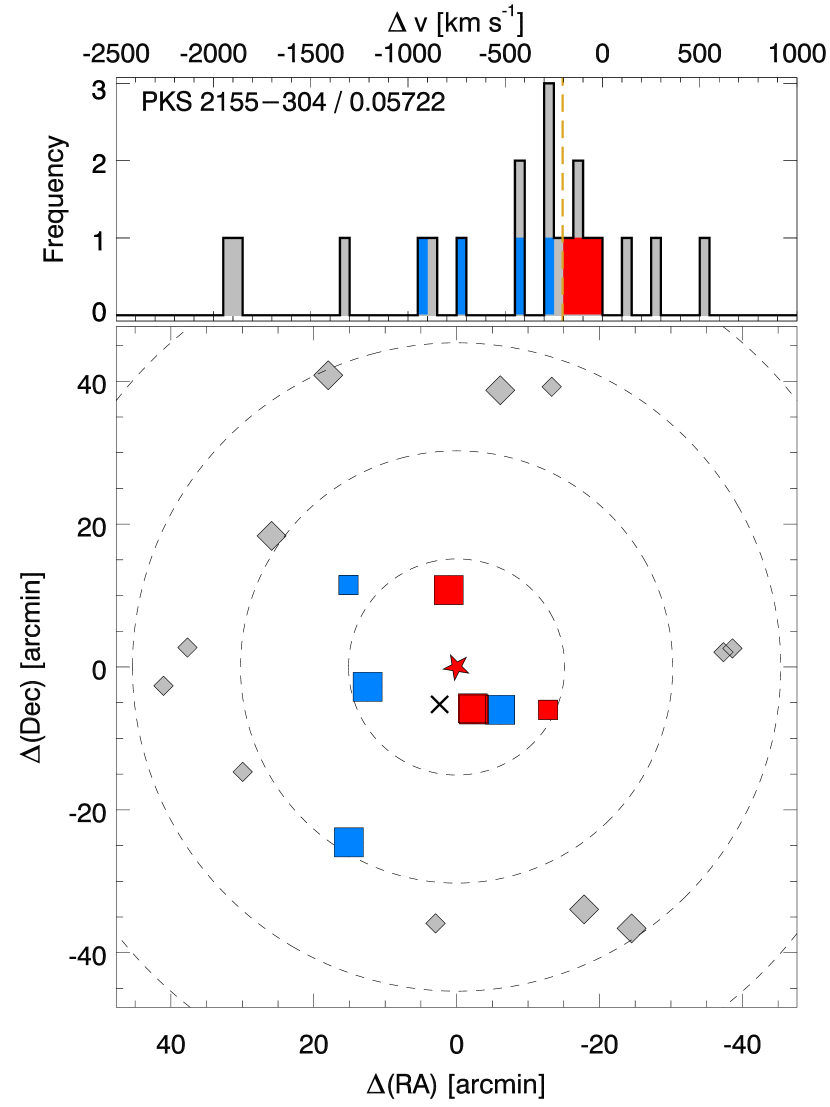

Figures 2 (warm absorbers), 3 (cool absorbers) and 4 (misaligned absorbers) show all groups in this study for which 8 group members were identified by the group finding analysis described above. These figures show group members as colored circles or squares with non-group members in the same regions as grey triangles. The presence of grey triangle galaxies within the search region for virtually all these groups indicates that the group memberships are limited by the linking length criteria not the imposed boundaries of the search. However, two of these “groups” may extend beyond the initial search regions; these two groups are also much richer than the others in this study and contain luminous elliptical galaxies:
1. 3C273/0.00336 (Tripp et al., 2002; Rosenberg et al., 2003; Stocke et al., 2004; Yoon et al., 2012) is in the southern outskirts of the Virgo Cluster (see Figure 2). When left unrestricted the FoF technique includes nearly 1000 galaxies in this group, including luminous ellipticals near the Virgo Cluster center 5 Mpc away. However, in an effort to better characterize the more local environment of this absorber, we have decreased the linking lengths by a factor of two and restricted the search region to 1 Mpc from the absorber. The resulting values are still unusually large among warm absorber associations both in galaxy numbers ( 150) and also in total group luminosity ( 32 L∗). While the FoF algorithm identifies only a fraction of the galaxies in this restricted region as group members (colored vs. grey symbols in the 3C 273/0.00336 panel in Figure 2), inclusion of all of the grey-symboled galaxies (mostly dwarfs) as group members does not change the calculated velocity dispersion by an amount more than the quoted 90% confidence error range. The agreement between and in this case (see Table 5) are suggestive that our restrictive approach has defined a warm absorber group within a larger supercluster region.
2. The other very rich group found around warm absorber locations (PHL 1811/0.07773) is between two rich clusters, Abell 2402 and SDSS-C4 2012. However, the algorithm does identify a group confined within the search region with a few non-group members present within the region (see Figure 2). We conclude that this is a well-defined group with a well-defined velocity dispersion (see the approximately Gaussian velocity distribution in Figure 2) within a larger supercluster region.
Three other fields deserve some brief comments with regard to the FoF group membership algorithm. In the case of the cool absorber group PG 0953+414/0.00212 (see Figure 3) the FoF analysis finds a fairly isolated group even though a higher redshift group ( 400 km s-1) is also present between 1 and 2 Mpc to the south (concentration of grey points to the south of the absorber and at higher radial velocities in the v histogram). However, many small galaxies which might be included in the cool absorber group are excluded by the FoF analysis (grey symbols in the spatial plot and histogram mixed in with the identified group members). If those excluded galaxies are instead included, this group increases from 1.5L∗ to 3.0L∗ in total luminosity but the velocity dispersion remains nearly identical to the value reported in Table 6. Therefore, despite potential differences in group membership accounting, the characteristics of this group are fairly robust.
The warm absorber group Mrk 290/0.01027 shown in Figure 2 has been pointed out previously by Narayanan et al. (2010), who describe this group as being in a “filament” of galaxies. Indeed, the FoF analysis links to galaxies out to 3 Mpc from the absorber but we truncate our analysis at 1.5 and 3. While either the group or filament descriptions seem valid, we retain the values shown in Table 2 for this warm absorber group for this analysis.
There are two anomalies created by the procedure of group identification above (see table notes to Table 5). For the PHL 1811/ 0.07773 absorber, a 100 member group is identified which is well-centered around the absorber on the plane of the sky but offset in velocity (vgrp = 330 km s-1) and with a very large velocity dispersion ( = 630 km s-1). In this case there is an 0.7 L∗ group member which is closer on the sky to the absorber (0.22 Rvir away) than a similarly bright galaxy, which is 1.75 Rvir away (as listed in Table 5). However, this proximate galaxy has a v = 904 km s-1 relative to the absorber, which greatly exceeds our adopted maximum velocity difference of 400 km s-1 to be associated with the absorber. This same galaxy has been identified as the one associated with a slightly higher redshift LLS absorber in the PHL 1811 FUV spectrum (Jenkins et al., 2003). Similarly, in the 3C 273/0.00336 absorber region there is an extreme dwarf ( 1% L∗) quite close to the sightline ( = 46 kpc) but at substantial v = 610 km s-1; this dwarf is associated with a slightly higher redshift absorber in this same sightline (Stocke et al., 2004).
3.2. Spiral-Rich Galaxy Groups Associated with Warm Absorbers at 0.15
For the four warm absorbers at 0.10 our 4m survey is more than adequate to supply a good description of their associated galaxy groups; all but one (Mrk 876/0.00315) have 10 group members for galaxy survey completeness levels deeper than 0.1 L∗. A fifth absorber, PHL 1811/0.13280, has also been surveyed deeply enough to establish the presence of a rich group. These four have velocity dispersions 250–650 and total group luminosities of 5–50 L∗. These numbers correspond to significant (4–100+) overdensities in galaxies.
While the richness, total luminosity and velocity dispersion of the Mrk876/0.00315 group would be much larger if many of the dwarfs in its region were included in this group by the FoF analysis, its listed (Table 5) values are less than the Local Group, dominated by a single 0.25L∗ galaxy. If we were to include all the 22 galaxies in the original search volume as group members, this “group” would have a total group luminosity of 2L∗ and a velocity dispersion 250 km s-1, which would make it comparable to the Local Group and only slightly poorer but with a velocity dispersion comparable to the Mrk 290/0.01027 group. The lack of sufficient group members to provide a robust velocity dispersion leads us to discard this group from the statistical analysis despite having a warm absorber at log T(K) = 5.14 (Paper 1).
The two richest absorber environments have velocity dispersions comparable to many elliptical-dominated groups of galaxies (see Table 2 and Zabludoff & Mulchaey, 1998; Mulchaey, 2000). The richest “group”, associated with 3C 273/0.00336, is in the southern outskirts of the Virgo Cluster with a couple of luminous early-type galaxies (NGC 4636, a 2L∗ E0 and NGC 4643, a 1.6L∗ SB0) 0.8 Mpc away from the sightline. The 5L∗ Sbc spiral M61 is the most luminous galaxy in the region. Similarly the PHL 1811/0.07773 group is also in the vicinity of richer galaxy regions and has a total group luminosity (55 L∗) and velocity dispersion of 600 km s-1, very large for an isolated spiral-rich group (see Table 5, Figure 2 and Zabludoff & Mulchaey, 1998; Mulchaey, 2000). This group also contains several early-type galaxies including 2MASX J21551727-0917517 (see also Jenkins et al., 2003), a 2L∗ elliptical 0.6 Mpc from the sightline. Given its large velocity dispersion and approximately Gaussian-distributed positions and velocities (comparable to many poor clusters of galaxies), this group should be searched for diffuse soft X-ray emission. Evidently, warm absorbers can be found either in small spiral-rich groups, in richer galaxy groups within filaments or in regions on the outskirts of clusters of galaxies.
A fifth nearby group is associated with the possible warm absorber, 3C 263/0.11389 (listed as a “misaligned absorber” by Paper 1 but see Appendix A for a reanalysis of this possible warm absorber). This absorber region has been surveyed for galaxies to , has 7 identified group members and a velocity dispersion of 270 . The three other low- warm absorbers in Table 5 have regions surveyed to 0.2–0.3L∗ and only 4 group members identified. While an extrapolation from these few galaxy identifications using a standard luminosity function (Montero-Dorta & Prada, 2009) suggests the presence of groups comparable in richness to Mrk 290/0.01027, deeper MOS is required to characterize them more precisely. Therefore, based on the eight absorbers in Table 5 and a ninth, possible warm absorber in Table 7 (3C 263/0.11389), the warm absorber environment is usually spiral-rich galaxy groups with total luminosities of 2–20L∗ (assuming the larger value for the Mrk 876/0.00315 group) and velocity dispersions of 250–450 km s-1. A couple of absorbers are found within richer groups and in cluster outskirts with larger total luminosities and velocity dispersions. These conclusions are all based on a small size sample and need to be confirmed by discovering many more warm absorbers at very low redshifts, where galaxy groups can be characterized in detail. It will be particularly important to target groups with well-defined properties, selected consistently from large galaxy databases (e.g., SDSS Berlind et al., 2008) to verify the diversity of groups associated with these “warm absorbers”.
3.3. Galaxy Groups Associated with Cool and Misaligned Absorbers
Table 6 lists all the lower temperature O VI + absorbers at z 0.15 from Paper 1. Generally the cool absorbers are in groups of galaxies with slightly lower total luminosities ( = 1.5–25 L∗) and velocity dispersions ( 130–500 ) than the warm absorber groups. These small differences between warm and cool absorber environments are not due to these fields having a brighter completeness luminosity as all but three absorbers (3C 273/0.12007; PG 0953+414/0.14231 and HE 0153-4520/0.14887; i.e., the three highest redshift absorbers in Table 6) have been surveyed well below . Due to the dearth of cool absorbers with good galaxy data we have added PG 1259+593/0.04625 to Table 6. This QSO has a high-S/N (36:1) COS spectrum and has been well-surveyed for galaxies using the same galaxy redshift database and WIYN/HYDRA MOS described in Section 3.1 despite not being a sightline included in Paper 1. A detailed analysis of this absorber complex is presented in Appendix A. See Figure 3 for the galaxy distributions around cool absorbers with 8 group members identified.
Interestingly, despite having similarly faint completeness limits, galaxy redshift surveys fail to find many galaxies around the misaligned absorbers (see Table 7). Only three misaligned absorber groups have sufficient numbers of identified group galaxies to quote a firm velocity dispersion (i.e., N 8). The three well-sampled groups associated with misaligned absorbers are shown in Figure 4 along with the Ngrp = 7 group associated with 3C 263/0.11389, which may contain a “warm absorber” (see Appendix A).
3.4. Statistical Properties of Galaxy Groups Associated with Warm Absorbers
In this Sub-section we explore the possible differences between the nearest galaxies and the galaxy groups surrounding warm and cool absorbers. Since the COS spectroscopy provides only single probes through this gas, it is not obvious whether these absorbers are small ( 20 kpc) and more closely related to an individual galaxy or are large ( 100 kpc) and are associated with an entire group of galaxies. We perform three observational tests to determine which of these two possibilities is more likely: (1). Do nearest galaxy properties or galaxy group properties differ between warm and cool absorbers? (2). Do the observed absorber line-widths and inferred gas temperature values correlate with the kinetic energy in the group as measured by the group velocity dispersion? and (3). Which potential association, nearest galaxy or galaxy group, provides an absorber size which better matches the observed impact parameters shown in columns (4) and (9) of Table 5? This third test will be presented in the next sub-Section.
Each of these tests is limited both by the small sample size and by the statistical and systematic errors in the absorber and group measurements. While the O VI line widths offer the most unambiguous measurement of the temperature of the warm or cool gas, the O VI line profiles also may include some contribution from unresolved components, turbulence or Hubble flow motions (see Paper 1 and Appendix A). For example, the PG 0953+414/0.14231 absorber includes two O VI components with =197 and 294 km s-1, but from which similar gas temperatures (log T(K) 4.25 and log T(K) = 4.21) are derived when the O VI and H I -values are used together. Secondly, the Ly line-widths are derived from best-fits to multiple components within a complicated line profile (see Appendix A and Paper 1). This makes the Ly -values less reliable than b due to the presence of strong, photo-ionized absorption in Ly, which creates both statistical and systematic errors. Finally, gas temperatures are derived from a combination of the measured O VI and Ly -values and so have the greatest statistical uncertainties. But this procedure does allow for the removal of other contributors to the line widths that otherwise would create large systematic errors in log T. This makes the temperatures the most reliable of these three measures since the systematical uncertainties are minimized, so that the statistical errors are a good measurement of the total uncertainties in log T. Further, the number of group members defined by the FoF algorithm is modest in most cases analyzed, making both the statistical and the systematic errors in the velocity dispersion values potentially quite large. Of particular concern are the non-Gaussian distributed velocities and sky locations of the group galaxies (see Figures 2, 3 and 4). At issue is not only the detailed methodology for computing velocity dispersions for small numbers of galaxies (Beers, Flynn & Gebhardt, 1990) but also the robustness of the group membership algorithms (Berlind et al., 2006), including our choice of “linking lengths”. However, our tests in Section 3.1 show that the velocity dispersions computed from group membership agree to within the errors with the group velocity dispersion computed from total group galaxy luminosities under the assumption that the group is virialized. This agreement provides some confirmation for the group definition process we have used, but it may be that a combination of systematic and statistical errors in measuring absorber and group properties (Tabs, , etc) may actually obscure any real correlations that are present.
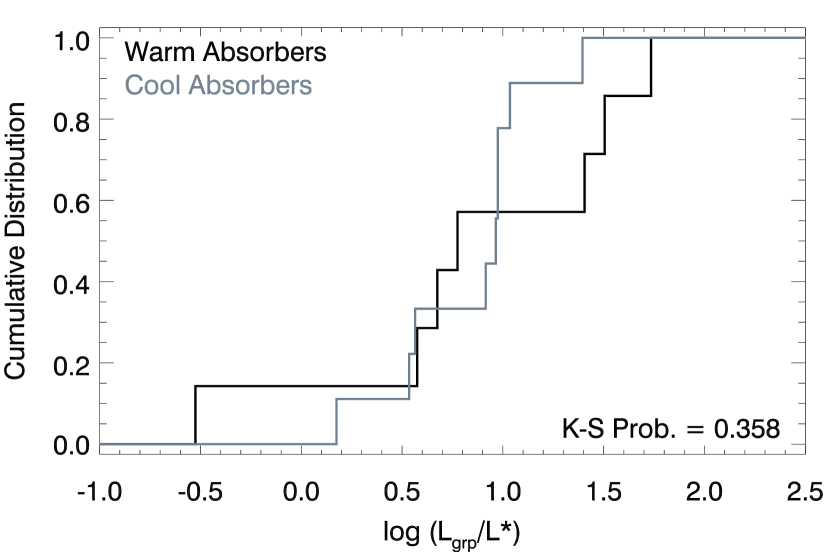
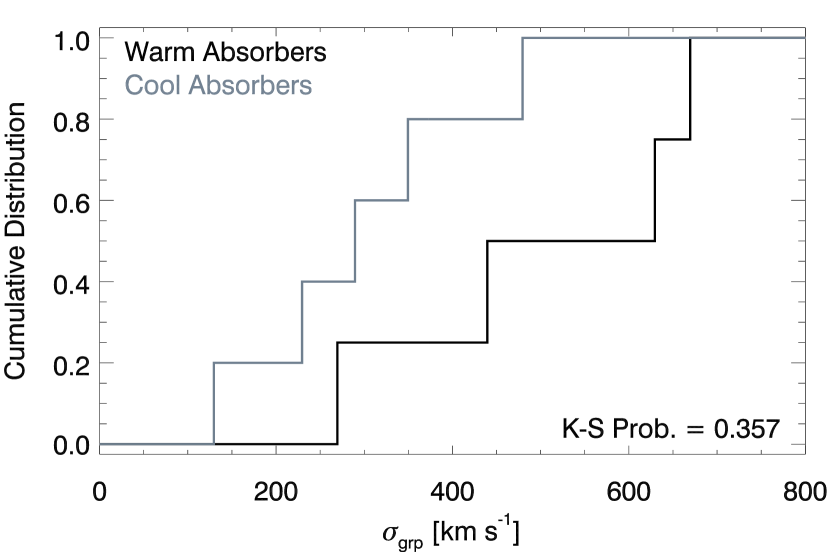
With these caveats in mind, the very slight systematic differences in galaxy group environments between the warm and cool absorbers in this sample are shown not to be significant in Figures 5 and 6. The warm absorbers are found in galaxy groups which are both slightly richer (marginally greater total luminosity; K-S test probability of chance occurrence 36%) and which possess systematically larger velocity dispersions (K-S test probability of chance occurrence 36%). For Figure 5 we have used all warm absorbers in Table 5 (plus the possible warm absorber 3C 263/0.11389 from Table 7) and cool absorbers in Table 6, judging that all of these fields have been surveyed deeply enough to find most of the total luminosity of the groups. For Figure 6 we have used only those groups in Tables 5 and 6 which have members surveyed, so that a velocity dispersion with estimated errors is quoted. Including all groups with N 3 (i.e., all values in Tables 5, 6 & 7 where a value is quoted) decreases the K-S test probability for chance occurrence to 10%, but this comparison simply requires more groups before it can be judged to show a significant difference or not. Thus, using the most secure velocity dispersion data, we find only a very slight difference (1 level) that the warm absorber groups have a larger velocity dispersion and higher total luminosities.
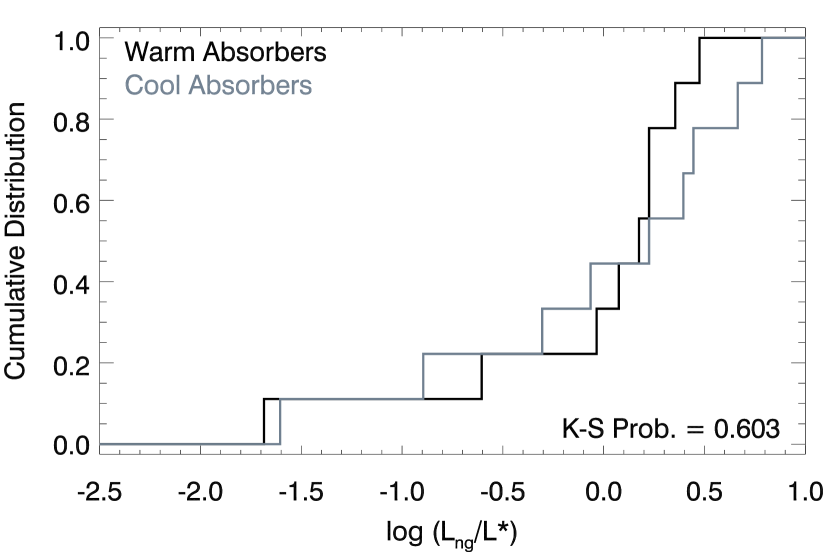
Figure 7 shows that there is no dichotomy at all between the warm and cool absorbers if the luminosity of the nearest associated galaxy is plotted. In this case we have used all the absorbers in Tables 5 and 6 because the two samples have a comparable range of completeness luminosities close to their sightlines. A K-S Test yields a probability of 60% that these two distributions have been drawn from the same parent population. These comparisons offer no strong support for or against an association between these absorbers and either their nearest galaxy neighbors or the groups in which they are imbedded.
Dividing the full galaxy groups sample by absorber temperature may actually obscure a more conclusive result for test (1) above because the statistical uncertainties in the measured temperature for some absorbers are so large. Therefore, in test (2) we use the raw line-width data as well as the derived temperature values, but taking the uncertainties explicitly into account. In Figure 8 we show a plot of O VI -values versus . No correlation between these quantities is present. A weak correlation ( 50% probability of chance occurrence) may be present between the Ly line width and (Figure 9) but its existence depends entirely on the one point associated with PHL 1811/0.07773. While any real correlation between these quantities could be masked by the potentially large systematic errors in the line-fitting, these plots offer no substantial support for or against a group origin for this gas.
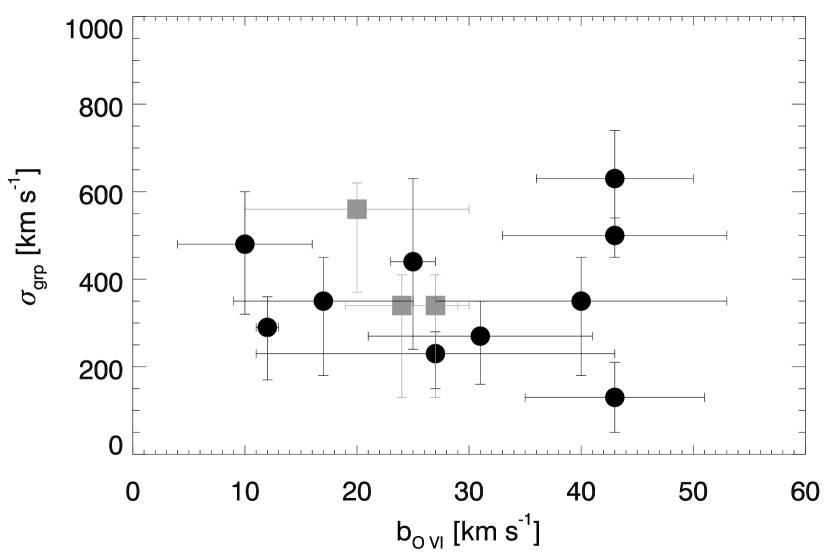

However, some support for a group origin for the warm and cool O VI gas detected spectroscopically by COS is shown in Figures 10 & 11 (n.b., these plots are not fully independent since group luminosities and velocity dispersions correlate). These plots use the inferred absorber gas temperatures (Tables 2, 3 & 4) and the group velocity dispersions and luminosities (Tables 5, 6 & 7) to determine whether there is a relationship between the energy in the gas and in the galaxies as would be expected if they trace the same gravitational potential. All absorbers with reasonably robust velocity dispersions ( 8 members) have been included in Figures 10 & 11 as filled black symbols. These data result in a correlation between these two variables at the 95% level ( 2) using various statistical tests (e.g., Kendall and Spearman rank correlation coefficients). These possible correlations are far from compelling due to the small sample size and requires new observations to be confirmed (e.g., two groups, H 1821+643/0.12141 and 3C 263/0.14072, which do not appear in Figures 10 & 11 and which have log T (K) 5.5 are in regions not yet surveyed deeply for galaxies). However, the derived temperatures may provide a better indication of the specific energy in the gas compared to the raw line widths due to the removal of non-thermal contributions to and .
Also, as a follow-up to the possible correlation between group luminosity and absorber temperature, it will be important to conduct a quantitative comparison between the galaxy morphologies in warm and cool groups. While such an analysis is beyond the scope of this paper, it may provide important insights into the dynamical evolution of these groups and will be presented at a later time (Keeney et al., 2014).


3.5. Inferred Sizes of Warm Absorbers
The third test for discriminating between nearest galaxy or galaxy group associations with warm absorbers uses the number density = 3.5–5 per unit redshift as a discriminator (see Section 2). The bounds on the value above refer to the number of warm absorbers found in Paper 1 (14 plus 2 O VI-only absorbers) and herein (20 in total, including those same two O VI-only absorbers). We use = 41 per unit redshift for this analysis as a compromise value between the results of Paper 1 and the results in Section 2 and Appendix A herein. Note that this value is several times less than the for all O VI absorbers (Danforth & Shull, 2008). Here, by using a mean space density of associated objects (galaxies of varying luminosities and galaxy groups) we can use the observed value to compute a characteristic size for the absorber assuming an 100% covering fraction. These characteristic sizes can then be compared with the observed impact parameters to determine if an association with each object class is viable.
Previously this type of analysis had been conducted for photo-ionized absorbers, which have been found to be associated with individual galaxy halos at at high covering factors (Tumlinson et al., 2011; Prochaska et al., 2011a; Stocke et al., 2013). These studies find near unity covering fractions around galaxies at . Stocke et al. (2013) also finds substantial covering fractions around dwarfs at . Among the warm absorption complexes studied in detail here (i.e., those in Table 5), only two absorbers (PHL 1811/0.07773 and PG 1116+215/0.13850) have low metal ions (e.g., Si II, Si III, etc) present, which are associated with the narrow Ly component in the absorption complex. These are photo-ionized clouds that may or may not be associated physically with the warm absorber. As has been found by the three studies referenced above, these two are at low impact parameter (0.22 and 0.67 Rvir) from the nearest galaxy in the group. The remainder in Table 5 have only H I + O VI present and are found at larger impact parameters (typically at ) from the nearest galaxy in the groups.
| Galaxy Luminosity Range | ) | Required Absorber Radius | Max Observed Impact | Sample Size | Percent with |
|---|---|---|---|---|---|
| () | ( 10-3 Mpc-3) | Rabs (Mpc) | Parameter (Mpc) | ||
| 1.0 | 2.0 | 9 | 45% | ||
| 0.1 | 0.62 | 4 | 50% | ||
| 0.03 | 0.43 | 3 | 33% | ||
| 0.01 | 0.43 | 2 | 50% | ||
| Galaxy Groups | 0.30 | 1.11 | 10 | 90% |
Here we use the SDSS luminosity function of Montero-Dorta & Prada (2009) to determine the space density of galaxies using our assumed value (see Table 8). Recently Berlind et al. (2006, 2008) have undertaken a census of nearby galaxy groups using the SDSS. Using their median catalog of groups converted to yields . Pisani, Ramella & Geller (2003) used a different approach which nets approximately the same space density for a group velocity dispersion of 200 km s-1, which appears to be a reasonable lower limit to use in this estimate based on the warm absorber group values in Table 5. An earlier study by Girardi & Giuricin (2000) found a slightly larger value for the space density of groups, 4.5 to 6.5 10-4 Mpc-3, but included lower mass groups that are not as good a match to the current sample of warm absorbers groups.
The Berlind et al. value (), which will be used here for the space density of galaxy groups (see Table 8), is ten times less than the space density of galaxies, . The Berlind et al. catalog of galaxy groups are dominated by small (3–5 L L∗, members), spiral-rich groups, % of which are found to be virialized on the basis of crossing times 0.3 Hubble times. Almost all of these groups are significantly richer and with higher velocity dispersions than the Local Group and so are similar to the warm absorber groups found here.
Using the observed = 41 (Poisson error) of warm absorbers and assuming a unity covering factor, the required absorber sizes listed in Table 8 (column 3) were computed using the Montero-Dorta & Prada (2009) luminosity function integrated from the lower bound (Llow) in column (1) to infinity. The quoted errors in column (3) are the quadrature addition of the Poisson error and the errors in in column (2). The inferred sizes obtained by this calculation are half-again larger than the virial radii of Llow galaxies but much less than the maximum impact parameter observed between the warm absorbers and the nearest galaxies at L Llow. If the covering factor of these absorbers is 1 then the required absorbers sizes are larger still and so must be much larger than the virial radii of the nearest galaxies to provide a plausible association. For the 8 warm absorbers in our small sample (9 including the possible warm absorber 3C 263/0.11389 in Table 7), we find a maximum impact parameter to the nearest galaxy of 2 Mpc and a range of nearest L galaxy neighbors of 140 kpc to 2 Mpc. Lower luminosity bins have similar discrepancies. The last column in Table 8 shows that for all galaxy luminosities the percentage of cases where the observed impact parameter () is less than the required maximum absorber size (Rabs) is small. Unless the covering factors of these absorbers are 1 and their gaseous extents are Rvir, an association between warm absorbers and individual galaxies appears unlikely. However, caution involving this conclusion is required with respect to a possible association between warm absorbers and dwarf galaxies due to the very small numbers of absorbers (3 or 2) which have been surveyed to 0.03 or 0.01L∗ completeness levels. Deeper observations of many of these groups are required.
On the other hand, the largest observed impact parameter between the warm absorbers and their associated galaxy group’s centroid is 1.11 Mpc (PHL 1811/0.13280), with a spread in values of 0.24–1.27 (see column 10 in Table 5 and the last row of values in Table 7). Unlike for the individual galaxies, these values fit closely with the 1 Mpc required absorber radius in Table 8. Additionally, these numbers suggest that the warm absorbers are found approximately within the virial radius of the galaxy group. If only a fraction of spiral-galaxy groups contain warm absorbers and/or if the covering factor of these absorbers is significantly less than unity, an even larger size than 1 Mpc is required for the gas in these groups to account for the observed value. Note well, that this size is a statistically-determined extent of the ensemble of these absorbers at high covering factor, not the physical size of any one absorbing cloud.
In summary, small galaxy groups or groups in cluster outskirts with velocity dispersions of 250-650 km s-1 are typical warm absorber environments. While simple comparisons between warm absorber groups and groups associated with cooler, photo-ionized O VI absorbers find little difference between these two samples, the sample sizes are small and systematics in the observables can be large. However, using the absorber temperature rather than the O VI and H I line widths results in modest (95% confidence, 2) correlations between log T and group luminosity and log T and group velocity dispersion. These marginal differences are suggestive, but not conclusive, that the warm absorbers found in high-S/N COS spectra are detections of diffuse gas in small, spiral-rich galaxy groups. But, using the observed absorber and the impact parameters found for these absorbers relative to the galaxy group centroid finds support for a group association. The rather substantial 4 per unit redshift requires these absorbers to be extended over 1 Mpc in radius at high covering factor. This large extent is consistent with the observed impact parameters between the QSO sightlines and the foreground group centroids.
4. Discussion
The existence of a massive circum-galactic medium (CGM) or gaseous halo around individual late-type galaxies is now well-established. Several recent studies (Prochaska et al., 2011a; Tumlinson et al., 2011; Stocke et al., 2013; Tumlinson et al., 2013; Werk et al., 2014) have discovered and investigated cool, photo-ionized galaxy halo clouds found within the virial radii of large and small galaxies. These studies used STIS and COS spectroscopy to detect photo-ionized Ly and metal lines at very high covering factor out to at least the virial radius from the nearest, usually star-forming galaxy. The presence of similar clouds around early-type galaxies has been proposed but is still controversial (Thom et al., 2012). Where sufficient ions were available to provide good constraints on photo-ionization modeling, single-phase, homogeneous models were used to calculate cloud temperatures and densities from which sizes and masses were inferred (Stocke et al., 2013; Werk et al., 2014; Keeney et al., 2014). The resulting sizes (diameters of 0.1 - 30 kpc) and masses (101-8 M⊙) of these halo clouds are consistent with estimates for high-velocity-clouds (HVCs) in the Milky Way (e.g., Wakker et al., 2007, 2008). Estimates of the ensemble mass of the cool, photo-ionized clouds around a super-L∗ galaxy exceeds 1011 M⊙ (Stocke et al., 2013; Werk et al., 2014). Computing internal pressures for these clouds based on the derived temperatures and densities from the photo-ionization modeling finds 10 cm-3 K ( 0.5 dex) (Stocke et al., 2013).
Surprisingly, Stocke et al. (2013) found no evidence for a declining pressure while Werk et al. (2014) finds 2.3 evidence for a shallow decrease in density (/Rvir)-0.8. In either case the density decline in the halo is unexpectedly slight. It is important to be cautious in this interpretation since it rests on data from single sightline probes past many galaxies as indicative of the CGM around any single galaxy in the sample. This conclusion also assumes that the gaseous halo is centered on the nearest galaxy, which would not necessarily be the case if the confining medium were related to an entire group of galaxies. If this result is interpreted in the context of pressure equilibrium between these clouds and a hotter, more diffuse medium, the absence of a rapid decrease in cool cloud pressure with increasing impact parameter is unexpected if these clouds (and any surrounding intra-cloud medium) are related exclusively to an individual galaxy (Anderson & Bregman, 2010, 2011).
The discovery of the 20 warm absorbers studied here may be related to the existence of the hotter gas whose presence is suggested by the cool, photoionized cloud pressures. It is important to recall that the absorbers found by Paper 1 and studied herein are too shallow and broad to have been detected in the lower S/N COS and STIS spectra published earlier. The strong O VI absorbers previously studied by Tumlinson et al. (2011); Prochaska et al. (2011a); Werk et al. (2013); Stocke et al. (2013); Werk et al. (2014) are found well within of the nearest galaxy’s halo and appears associated in some way with the cool, photoionized clouds. As found in the previous section, these “warm absorbers” are located on average much farther from their nearest galaxy neighbor (i.e., typically at ) but within the confines of a galaxy group containing that nearest galaxy. Most of these warm absorbers do not contain lower ions within the absorption complex which differs from the higher column density O VI systems found by Tumlinson et al. (2011).
While simple correlation studies fail to show strong evidence for this proposed absorber/group association, modest ( 2) correlations between absorber temperature and group luminosity and velocity dispersion were found (n.b., these are not independent correlations). Also, the observed impact parameters to the nearest galaxy appear much too large (i.e., in most cases) to explain an individual galaxy association with these absorbers unless the gas is extremely patchy. An association with group gas is more likely based on a match between the observed absorber impact parameters from group centroids and the required cloud sizes. While suggestive, the current data are too sparse to warrant a claim that the warm absorbers are the first solid detections of an intra-group medium in spiral-rich galaxy groups. While this is a possibility, the 105-6 K temperatures of these absorbers are an order of magnitude too low to be the intra-group medium if these groups are virialized. Most likely these absorbers mark the transition regions between the hot, intra-group gas and cooler, photo-ionized absorbers (Smith et al., 2011; Shull et al., 2012; Cen, 2013).
Figure 11 in the previous Section showed the T- absorber/group data with extrapolations from hotter temperature groups and clusters shown as solid and dashed lines. The dashed line indicates the extrapolation of the best-fit power-law from Wu, Xue & Fang (1999, as shown in Mulchaey 2000, Figure 4) for clusters and groups into the T- domain of the spiral groups studied here. It is on the basis of an extrapolation like this that M96 predicted that a typical spiral-rich group with =100 km s-1 would possess an intra-group gas with log T(K)=6.3. When Savage et al. (2010) discovered a broad O VI-only absorber in the COS spectrum of PKS 0405-123 whose -value and absence of associated H I Ly strongly suggested log T(K)=6.1, it was natural to associate this absorption line detection of warm gas with the prediction of M96. However, as shown in Figures 1 & 11 the observed (absorption-line determined) temperatures in spiral-rich groups presented herein are at least an order of magnitude lower than as predicted by the velocity dispersions of spiral-rich groups if an extrapolation of the Wu, Xue & Fang (1999) rich cluster and group data is appropriate.
More recently Osmond & Ponman (2004) constructed a large group catalog using the ROSAT all-sky X-ray survey and a number of nearby group catalogs. The resulting log T vs log correlation found for these groups compared to a sample of rich clusters is shown in Osmond & Ponman (2004, see their Figure 16). What is most apparent is that the groups have a much larger spread in velocity dispersion at a given log Tx than the rich clusters. It is controversial whether a single power-law fits both the cluster and group data or whether the slope steepens in the group regime (e.g., Mulchaey, 2000; Osmond & Ponman, 2004; Helsdon, Ponman & Mulchaey, 2005). But neither the cluster plus group best-fit slope (0.71), nor the group-only best-fit slope (1.15), predicts the gas temperatures that we observe for the spiral-rich groups. An extrapolation of a single power-law which fits both the clusters and the most X-ray luminous, hottest groups (but not the lower Lx E-dominated groups) and is theoretically motivated by equipartition of energy between gas and galaxies; i.e., = 1 (Osmond & Ponman, 2004) is shown in Figure 11 as a solid line.
While the solid-line extrapolation comes closer to predicting the temperatures for the warm absorbers, even the = 1 extrapolation falls well below the spiral data points from this study, indicating that there is proportionately more energy in the galaxies than in the warm absorber gas. If a group is still in the process of virializing, it is possible that the galaxy motions have not had the time required to heat the gas to a virial equilibrium temperature in the case that the gas has been ejected from the galaxies only recently. But it is also possible that the O VI + H I warm absorbers are sensitive only to that portion of the intra-group gas closest to the temperature where the fraction of oxygen in the O VI ion maximizes (log T(K) 5.5) and that these warm absorbers indirectly trace the presence of even hotter gas, to which the HST/COS spectra are not sensitive. At T 106 K the neutral fraction of hydrogen is f 10-7 (Danforth et al., 2010) and the fraction of oxygen which is in the O VI ion is 10% (Bregman, 2007). If the bulk of the intra-group gas is at temperatures much hotter than 106 K, the warm absorbers could be interfaces with or cooler portions of this hotter gas and the bulk of the intra-group gas has not been detected directly as yet.
It is also reasonable to consider the possibility that the warm absorbers are a diffuse, high filling-factor gas in these groups as a limiting case; i.e., while not yet in equilibrium with the energy in the galaxies, these warm absorbers are nevertheless the bulk of the intra-group medium. To illustrate the consequences of this possibility, we assume pressure balance between the cool, photo-ionized clouds ( 10 cm-3 K) and a “warm” diffuse medium with T 105.5 K based on our warm absorber detections (see Figure 1). This constrains the density of this diffuse gas to be 10-4.5 cm-3 over a region with a minimum radius of 300 kpc. These density and minimum size estimates yield a minimum warm mass reservoir of 1011 M⊙. An even larger gas extent at high covering factor is required by the of the warm absorbers ( 1 Mpc in radius; see Section 3.5). Assuming a standard -model (Mulchaey & Zabludoff, 1998) with = 0.67 for the warm gas density profile with a 300 kpc core radius, a maximum gas radius of 1 Mpc and a central gas density of 3 10-5 cm-3 yields a total warm gas mass of 1012 . However, the large extent of this diffuse gas would create unacceptably large line widths for the O VI and Ly absorption. We estimate that the required velocity dispersions in such large structures would create line widths at least 2–3 times larger than what we find for these absorbers (see Table 2) either from Hubble flow broadening (unbound case) or from the substantial velocity dispersions of these groups (bound case). Also gas at the temperatures of these warm absorbers has a very short cooling time and so is unlikely to be the dominant gas reservoir around late-type galaxies and in their groups (Shull et al., 2012; Cen, 2013). Smith et al. (2011) find that in the present epoch, most of the gas at log T(K) = 5.0-6.0 has recently cooled from hotter gas that is the dominant WHIM reservoir at 0.
In order to satisfy the observations of nearly constant pressure over a minimum impact parameter of 300 kpc as well as the likely, but not firm, association of the warm absorbers with galaxy groups rather than individual galaxies, a diffuse hot medium is still required. Using Figure 11 as a guide, a reasonable temperature for the intra-group medium in groups with = 250-450 km s-1 is T 106.5 K. Pressure balance then requires a central gas density of 3 10-6 cm-3 and a total hot gas mass of 1011 (see previous paragraph). The core radius (300 kpc) and full extent (1 Mpc) we assume are similar to what is found in elliptical-dominated groups (Mulchaey, 2000) but the total mass is significantly less. While we have assumed a value of comparable to that found for clusters of galaxies, Osmond & Ponman (2004) find evidence for a somewhat smaller value of in groups which leads to a shallower density profile and a greater mass. Truncating the mass distribution at 1 Mpc may also be artificial and a substantial gas reservoir could be present farther away than 1 Mpc ( Rvir) as in the rich clusters (Simionescu et al., 2011). Therefore, the bulk of the evidence presented herein suggests that the warm absorbers are an indirect, not a direct detection of a massive baryon reservoir of hot gas in small, spiral-rich groups of galaxies at T 106.5 K.
5. Summary of Conclusions
The Cosmic Origin Spectrograph (COS) Science Team has conducted a high-S/N (20:1), high resolution (R 18,000) far-UV spectroscopic survey of 14 bright QSOs. Paper 1 reported some of the results from this survey concentrating on the absorbers detected in O VI. Specifically, Paper 1 identified a new class of broad, shallow O VI and Ly absorbers which are demonstrably hot enough to be fully in the collisionally-ionized regime; we term these “warm absorbers” in Paper 1 and herein (see Figure 1). As a class these warm absorbers have not been detected or studied heretofore in any detail due to the absence of sufficiently high-S/N FUV spectra, which the COS GTO observations have now provided.
Additional absorption systems with and without metals from these spectra are presented in Danforth et al. (2014). Most of the O VI absorbers were also detected in H I Ly with COS but two O VI absorbers were not detected in H I at all and a few with broad Ly (BLA) detections had O VI detections in the FUSE band. One possible warm absorber contains a BLA in Ly, which is confirmed to be warm using the observed Ly width but has no corresponding O VI. Fourteen broad O VI + BLA detections in the Science Team’s survey have absorption in these two species aligned in velocity with -values requiring collisionally-ionized gas at T 105 K, so called, “warm gas”. Two other absorbers found in the spectra analyzed in Paper 1 possess broad O VI absorption with no corresponding H I Ly absorption, also requiring the presence of warm gas. In this paper the galaxy environments of these warm absorbers are investigated in order to determine the most likely type of galaxy or galaxy group with which they are physically associated. Given an association with either individual galaxies or with the entire galaxy group, the spatial extent and gas mass of these warm absorbers is also estimated. We find the following results:
1. We have reviewed the results of Paper 1 concentrating on those few broad, symmetric O VI absorbers suggestive of warm gas which were not identified as such by Paper 1 (see Section 2). While almost all of the model fits made by Paper 1 were confirmed, we suggest alternative fits for 4 absorbers only (see Appendix A). These reevaluations, plus two O VI-only absorbers that lack associated Ly, suggest that as many as 20 warm absorbers may be present in this sample compared to 14 (plus 2 O VI-only) warm absorbers identified in Paper 1. Using the pathlength probed by these 14 high-S/N spectra of = 4.0, we find a for warm absorbers of 3.5-5 per unit redshift, several times the number density of Mg II/LLS absorbers and about one-quarter of the value for all previously-detected O VI absorbers (Danforth & Shull, 2008).
2. Spiral-rich galaxy groups are found around the location of most of these warm absorbers with total luminosities of 2–26L∗ and velocity dispersions, = 250–450 km s-1. These groups have 2–5 bright (LL∗) group members that are usually luminous early-type spirals. However, two warm absorbers have galaxy environments more appropriately described as cluster outskirts or as a galaxy group within a filament between clusters. These two warm absorber groups have velocity dispersions of 500 km s-1, total luminosities of 30-60 L∗ and brightest galaxies that are 2-4 L∗ early-types.
3. Evidence is presented in Section 3 that the warm absorbers are more likely associated with the galaxy group than the nearest galaxy, although this evidence is not entirely conclusive due to the small sample size. Group properties associated with either warm or cool absorbers do not show significant differences. Modest (95% probability) 2 correlations are found between both the total group luminosity and also the gas temperature in comparison with the group velocity dispersion (Figures 10 and 11). On the other hand we find no evidence favoring an association with the nearest galaxy neighbors to these absorbers.
4. The large 4 per unit redshift favors an association with galaxy groups rather than individual galaxies (see Table 8 in Section 3.5). Regardless of their luminosity, most of the nearest galaxies are systematically too far away from the warm absorbers to be viably associated. On the other hand, if the associations are with galaxy groups, then the impact parameters match the absorber sizes of 1 Mpc radius required in the case of high covering factors. One Mpc is also the approximate size of the virial radius of these groups, if they are in fact gravitationally bound. But in this case the rather narrow O VI and Ly line widths observed are explicable only if these absorbers are individually small with respect to the galaxy group but which in ensemble cover the entire group at very high covering factor.
5. While the T- relation for spiral groups in this sample (Figure 11) lies well above an extrapolation of the relation seen for clusters and elliptical dominated groups, the data for spiral-rich groups lie much closer to an extrapolation of the cluster group X-ray data if equipartition of energy between gas and galaxies ( = 1) is assumed. However, the temperatures of the warm gas (see Figure 11) are approximately one order of magnitude too cool to be diffuse group gas if = 1 and if the group is virialized. The origin of this discrepancy is not known. It could be that the O VI absorption is not tracing the bulk of the intra-group gas but rather the gas at the temperature to which the O VI is most sensitive, T 105.5 K. In this case hotter gas likely is present in these groups but is not easily detected in the COS FUV absorption-line spectra.
6. The observed, nearly-constant, cool cloud internal pressures ( 10 cm-3 K; Stocke et al., 2013; Werk et al., 2014) as a function of impact parameter require a very large, diffuse intra-cloud gas to confine these clouds. While the warm absorbers could be detections of this massive, diffuse gas reservoir, it is more plausible that these warm clouds are a tracer of even hotter, diffuse gas which confines the cool, photoionized clouds. Three observables favor this interpretation: (a) the warm absorber O VI and H I line widths are too narrow to be gas distributed over a large region of a bound or unbound galaxy group; (b) the warm absorber temperatures are in a regime where diffuse gas is quite unstable to rapid cooling so that a large diffuse gas reservoir would be difficult to maintain at that temperature; and (c) the warm absorber temperatures are an order of magnitude too cool to be virialized gas in the groups we have found (=250-450 km s-1; see Figure 11). In the context of a standard -model with a core radius of 300 kpc and a full extent of 1 Mpc (based on the results described in the previous Section) we find a total mass of 1011 M⊙ for this hotter gas based on pressure equilibrium with the cool, photoionized clouds. These values for the spiral intra-group medium suggests a similar extent to the gas in elliptical-dominated groups (Mulchaey, 2000), but less mass. This amount of gas also is quite similar to the amount of “missing” baryons required to bring spiral galaxy groups up to the cosmic mean ratio of baryons to dark matter. If the conclusions summarized in this paragraph are correct, spiral galaxy groups could be “closed boxes” for cosmic evolution like their more massive counterparts which contain dominant ellipticals.
Regardless of their detailed interpretation, these warm absorbers are detections of local baryons not inventoried before. As such these absorbers will add to the baryon census, but with an amount that can only be determined by making an independent measurement of their size and filling factor. New HST/COS FUV spectroscopy of QSO sightlines passing through pre-defined low-redshift galaxy groups will be important in confirming or denying the presence of warm gas in spiral-rich galaxy groups. These suggested observations could establish the cosmic importance of this warm gas and the hotter gas which it probably traces.
References
- Anderson & Bregman (2010) Anderson, M. E. & Bregman, J. N. 2010, ApJ, 714, 320
- Anderson & Bregman (2011) Anderson, M. E. & Bregman, J. N. 2011, ApJ, 737, 22
- Bahcall & Spitzer (1969) Bahcall, J.N. & Spitzer, L., 1969, ApJ, 156, L63
- Bahcall et al. (1991) Bahcall, J. N., Jannuzi, B. T., Schneider, D. P., et al. 1991, ApJ, 377, L5
- Beers, Flynn & Gebhardt (1990) Beers, T. C., Flynn, K. & Gebhardt, K. 1990, AJ, 100, 32
- Berlind et al. (2006) Berlind, A.A. et al. 2006, ApJS, 167, 1
- Berlind et al. (2008) Berlind, A.A. et al. 2008, yCat, 21670001
- Bickel & Sakov (2008) Bickel, P.J. & Sakov, A. 2008, Statistica Sinica, 18, 967
- Binney & Tremaine (1987) Binney, J. & Tremaine, S. 1987, Galactic Dynamics (Princeton: Princeton Univ. Press), pp. 567-575
- Bregman (2007) Bregman, J. N. 2007, ARA&A, 45, 221
- Bryan & Norman (1998) Bryan, G. & Norman, M. 1998, ApJ, 495, 80
- Cen & Ostriker (1999) Cen, R. & Ostriker, J. P. 1999, ApJ, 514, 1
- Cen (2013) Cen, R. 2013, ApJ, 770, 139
- Chen & Mulchaey (2009) Chen, H.-W. & Mulchaey, J. S. 2009, ApJ, 701, 1219
- Chomiuk & Povich (2011) Chomiuk, L. & Povich, M. S. 2011, AJ, 142, 197
- Churchill et al. (2000) Churchill, C. W., Mellon, R. R., Charlton, J. C., et al. 2000, ApJ, 543, 577
- Danforth & Shull (2008) Danforth, C. W. & Shull, J. M. 2008, ApJ, 679, 194
- Danforth et al. (2010) Danforth, C. W., Stocke, J. T. & Shull, J. M. 2010, ApJ, 710, 613
- Danforth et al. (2014) Danforth, C. W., Shull, J. M., Stocke et al. 2014, in preparation
- Davé et al. (1999) Davé, R., Hernquist, L., Katz, N., & Weinberg, D. H. 1999, ApJ, 511, 521
- Davé & Oppenheimer (2007) Davé, R. & Oppenheimer, B. D. 2007, MNRAS, 374, 427
- Fang et al. (2007) Fang, T., Canizares, C. R., & Yao, Y. 2007, ApJ, 670, 992
- Fang et al. (2013) Fang, T., Bullock J. S., & Boylan-Kolchin, M. 2013, ApJ, 762, 20
- Fukugita et al. (1998) Fukugita, M., Hogan, C. J., & Peebles, P. J. E. 1998, ApJ, 503, 518
- Girardi & Giuricin (2000) Girardi, M. & Giuricin, G. 2000, ApJ, 540, 45
- Green et al. (2012) Green, J. C., Froning, C. S., Osterman, S., et al. 2012, ApJ, 744, 60
- Gupta et al. (2012) Gupta, A., Mathur, S., Krongold, Y., Nicastro, F., & Galeazzi, M. 2012, ApJ, 756, L8
- Helsdon, Ponman & Mulchaey (2005) Helsdon, S.F., Ponman, T.J. & Mulchaey, J.S. 2005, ApJ, 618, 679
- Hinshaw et al. (2013) Hinshaw, G., Larson, D., Komatsu, E., et al. 2013, ApJS, 208, 19
- Jenkins et al. (2003) Jenkins, E. B., Bowen, D. V., Tripp, T. M., et al. 2003, AJ, 125, 2824
- Johnson, Chen & Mulchaey (2013) Johnson, S.D., Chen, H-W. & Mulchaey, J.S. 2013, MNRAS, 434, 1765
- Kacprzak et al. (2010) Kacprzak, G. G., Churchill, C. W., Ceverino, D., et al. 2010, ApJ, 711, 533
- Kacprzak et al. (2011) Kacprzak, G. G., Churchill, C. W., Barton, E. J., & Cooke, J. 2011, ApJ, 733, 105
- Karachentseva, Karachentsev & Sharina (2010) Karachentseva, V.E., Karachentsev, I.D. & Sharina, M.E. 2010, Astrophysics, 53, 462
- Keeney et al. (2013) Keeney, B. A., et al. 2013, ApJ, 765, 27
- Keeney et al. (2014) Keeney, B. A., et al. 2014, in preparation
- Keres̆ & Hernquist (2009) Keres̆, D. & Hernquist, L. 2009a, ApJ, 700, L1
- Klypin et al. (2001) Klypin, A., Kravtsov, A. V., Bullock, J. S. & Primack, J. R. 2001, ApJ, 554, 903
- Larson (1972) Larson, R. B. 1972, MNRAS, 157, 121
- Lehner et al. (2007) Lehner, N., Savage, B. D., Richter, P., et al. 2007, ApJ, 658, 680
- Lehner & Howk (2011) Lehner, N. & Howk, J. C. 2011, Science, 334, 955
- Lehner et al. (2013) Lehner, N., Howk, J. C., Tripp, T. M., et al. 2013, ApJ, 770, 138
- McGaugh et al. (2000) McGaugh, S. S., Schombert, J. M., Bothun, G. D., & de Blok, W. J. G. 2000, ApJ, 533, L99
- Miles et al. (2004) Miles, T.A. et al. 2004, MNRAS, 355, 785
- Montero-Dorta & Prada (2009) Montero-Dorta, A. D. & Prada, F. 2009, MNRAS, 399, 1106
- Morris et al. (1991) Morris, S. L., Weymann, R. J., Savage, B. D., & Gilliland, R. L. 1991, ApJ, 377, L21
- Morris et al. (1993) Morris, S. L., Weymann, R. J., Dressler, A., et al. 1993, ApJ, 419, 524
- Moster et al. (2013) Moster, B. P., Naab, T., & White, S. D. M., 2013, MNRAS, 428, 1321
- Mulchaey et al. (1996) Mulchaey, J. S., Mushotzky, R. F., Burstein, D., & Davis, D. S. 1996, ApJ, 456, L5 (M96)
- Mulchaey & Zabludoff (1998) Mulchaey, J.S. & Zabludoff, A. I. 1998, ApJ, 496, 73
- Mulchaey (2000) Mulchaey, J. S. 2000, ARA&A, 38, 289
- Narayanan, Wakker & Savage (2009) Narayanan, A.P., Wakker, B.P & Savage, B.D. 2009, ApJ, 703, 74
- Narayanan et al. (2010) Narayanan, A.P., Wakker, B.P, Savage, B.D., et al. 2010, ApJ, 721, 960
- Osmond & Ponman (2004) Osmond, J. P. F & Ponman, T.J. 2004, MNRAS, 350, 1511
- Osterman et al. (2011) Osterman, S., Green, J., Froning, C., et al. 2011, Ap&SS, 335, 257
- Pagel (2008) Pagel, B.E.J. 2008, in “Pathways through an Eclectic Universe”, ed. J. H. Knapen, T. J. Mahoney, and A. Vazdekis (San Francisco: Astronomical Society of the Pacific), ASP Conference #390, 483
- Pisani, Ramella & Geller (2003) Pisani, A., Ramella, M & Geller, M.J. 2003, AJ, 126, 1677
- Prochaska et al. (2011b) Prochaska, J. S., Weiner, B., Chan, H.-W., Cooksey, K., & Mulchaey, J. 2011, ApJS, 193, 28
- Prochaska et al. (2011a) Prochaska, J. X., Weiner, B., Chen, H.-W., Mulchaey, J., & Cooksey, K. 2011a, ApJ, 740, 91
- Richter et al. (2004) Richter, P., Savage, B. D., Tripp, T. M. & Sembach, K. R. 2004, ApJS, 153, 165
- Rosenberg et al. (2003) Rosenberg, J. L., Ganguly, R., Giroux, M. L., & Stocke, J. T. 2003, ApJ, 597, 677
- Sarazin (1988) Sarazin, C. L. 1988, X-ray Emission from Clusters of Galaxies (Cambridge: Cambridge University Press)
- Savage et al. (2010) Savage, B. D., Narayanan, A., Wakker, B. P., et al. 2010, ApJ, 721, 960
- Savage et al. (2011a) Savage, B. D., Narayanan, A., Lehner, N., & Wakker, B. P. 2011, ApJ, 731, 14
- Savage et al. (2011b) Savage, B. D., Lehner, N., & Narayanan, A. 2011, ApJ, 743, 180
- Savage et al. (2014) Savage, B.D. et al. 2014, ApJS, in press; arXiv:1403.7542 (Paper 1)
- Shull et al. (1998) Shull, J. M., Penton, S. V., Stocke, J.T. et al. 1998, AJ, 116, 2094
- Shull et al. (2003) Shull, J. M., Tumlinson, J.T. & Giroux, M.L. 2003, ApJ, 594, L107
- Shull et al. (2012) Shull, J. M., Smith, B. D., & Danforth, C. W. 2012, ApJ, 759, 23
- Simionescu et al. (2011) Simionescu. A. et al. 2011, Science, 331, 1576
- Smith et al. (2011) Smith, B.D., Hallman, E.J., Shull, J.M. & O’Shea, B.W. 2011, ApJ, 731, 6
- Spitzer (1956) Spitzer, L. 1956, ApJ, 124, 20
- Steidel (1995) Steidel, C. C. 1995, in QSO Absorption Lines, ed. G. Meylan (Garching: Springer), 139
- Stocke et al. (2004) Stocke, J. T., Keeney, B. A., McLin, K. M., et al. 2004, ApJ, 609, 94
- Stocke et al. (2006) Stocke, J. T., Penton, S. V., Danforth, C. W., et al. 2006, ApJ, 641, 217
- Stocke et al. (2013) Stocke, J. T., Keeney, B. A., & Danforth, C.W. et al. 2013, ApJ, 763, 148
- Thom et al. (2012) Thom, C., Tumlinson, J., Werk, J. K., et al. 2012, ApJ, 758, L41
- Tilton et al. (2012) Tilton, E. M., Danforth, C. W., Shull, J. M., & Ross, T. L. 2012, ApJ, 759, 112
- Tripp et al. (1998) Tripp, T. M., Lu, L., & Savage, B. D. 1998, ApJ, 508, 200
- Tripp et al. (2002) Tripp, T. M., Jenkins, E. B., Williger, G. M., et al. 2002, ApJ, 575, 697
- Tripp et al. (2003) Tripp, T. M., Wakker, B. P., Jenkins, E. B., et al. 2003, AJ, 125, 3122
- Tripp et al. (2008) Tripp, T. M., Sembach, K. R., Bowen, D. V., et al. 2008, ApJS, 177, 39
- Tully et al. (2009) Tully, B. R., Rizzi, L., Shaya, E. J., et al. 2009, AJ, 138, 323
- Tumlinson & Fang (2005) Tumlinson, J. & Fang, T. 2005, ApJ, 623, L97
- Tumlinson et al. (2011) Tumlinson, J., Thom, C., Werk, J. K., et al. 2011, Science, 334, 948
- Tumlinson et al. (2013) Tumlinson, J., Thom, C., Werk, J. K., et al. 2013, ApJ, 777, 59
- Voit & Bryan (2001) Voit, G.M & Bryan, G.L. 2001, Nature, 414, 425
- Wakker (2001) Wakker, B. P. 2001, ApJS, 136, 463
- Wakker et al. (2007) Wakker, B. P., York, D. G., Howk, J. C., et al. 2007, ApJ, 670, L113
- Wakker et al. (2008) Wakker, B. P., York, D. G., Wilhelm, R., et al. 2008, ApJ, 672, 298
- Wakker & Savage (2009) Wakker, B. P. & Savage, B. D. 2009, ApJS, 182, 378
- Werk et al. (2013) Werk, J., Prochaska, J. X., Thom, C., et al. 2013, ApJS, 204, 17
- Werk et al. (2014) Werk, J., Prochaska, J.X., Tumlinson, J.T., et al. 2014, ApJ, in press (arXiv: 1403.0947).
- White et al. (1993) White, S. D. M., Navarro, J. F., Evrard, A. E., & Frenk, C. S. 1993, Nature, 366, 429
- White (2000) White, D.A. 2000, MNRAS, 312, 663
- Wu, Xue & Fang (1999) Wu X-P, Xue Y-J, Fang L-Z. 1999, ApJ, 524, 22
- Yao et al. (2012) Yao, Y., Shull, J. M., Wang, Q. D., & Cash, W. 2012, ApJ, 746, 166
- Yoon et al. (2012) Yoon, J. H. Putman, M. E., Thom, C. Chen, H-W and Bryan, G. L. 201, 2ApJ, 754, 84
- Zabludoff & Mulchaey (1998) Zabludoff, A.I. & Mulchaey, J.S. 1998, ApJ, 496, 39
Appendix A Detailed Reanalysis of a few “Warm Absorber” Candidates
In this Appendix we present detailed line fits to a few BLA plus broad O VI absorbers which may contain T 105 K gas, but were not included as warm absorbers in Paper 1. These fits do not replace the line fitting done in Paper 1 which was accomplished with no prior conditions and executed in a conservative manner; e.g., minimum number of components, no requirement to have Ly align with O VI necessarily, etc. (see Appendix in Paper 1). Here we take a different tactic by adopting an aim to determine the maximum number of plausible warm absorbers which might be present in this sample. We do this by first analyzing the O VI absorption which is less contaminated by lower temperature, photo-ionized gas than Ly. If the O VI absorption is smooth and symmetrical to the limits of the S/N, then we fit this absorption with a single component and assume that the observed -value is mostly due to thermal motions. With the O VI fit in-mind we then fit the complex, multi-component Ly line, constraining the fit to include a component aligned with the broad O VI absorption. If this analysis shows that a BLA can be present with a velocity consistent with the O VI and an observed -value consistent with T 105 K gas, then this absorber is added to the list of plausible warm absorbers in this sample.
See the Appendix and Table 5 of Paper 1 for the Ly and O VI line fits of these 10 absorbers, which we now discuss one-by-one. For each absorber we first describe the results of Paper 1 and then the new analysis is presented in the second paragraph. We emphasize that these re-analyses represent alternative absorption-line component de-convolutions, not necessarily superior ones, to those found in Paper 1.
A.1. PKS2155-304/0.05722
Because the Ly and O VI absorptions do not align in velocity, Paper 1 did not analyze this system in detail. However, the O VI absorption visible in a high-S/N FUSE spectrum is quite symmetrical and has a velocity within the span of the Ly profile. This system has been studied in detail by Shull et al. (1998, 2003) including a reconciliation of the O VI detection and possible Chandra O VIII detections. Shull et al. (1998) also identified a small foreground group of galaxies at the absorber redshift and provides accurate H I emission velocities for each group member detected. Therefore, it is worthwhile to consider this absorber in the context of warm gas.
Despite attempts to constrain a BLA absorption component to be coincident in velocity with the broad O VI, the closest offset finds the O VI centroid 46 km s-1 higher in velocity than the nearest Ly component. Because the Ly absorption is found in both a COS and a STIS spectrum and the O VI was detected by FUSE, a velocity offset is possible. However, the FUSE LiF2a spectrum and the COS spectrum detect the same Galactic Fe II 1144.8Å line with a velocity offset of only -10 km s-1. Therefore, the O VI absorption remains inconsistent (v 36 km s-1) with any Ly component and no warm absorber is present in agreement with the conclusion of Paper 1.
A.2. 3C 273/0.09010
Paper 1 reports that this system contains three Ly absorption lines which are nearly completely disjoint in velocity while the O VI absorber is displaced by 30 km s-1 to higher velocity. The best fit to the redward of two closely-spaced Ly components (see Figure 12) is quite acceptable but leaves open the possibility for the presence of a broad component that could align with the observed, symmetric O VI absorption.
In our reanalysis of this absorber we have fit the Ly absorption with four components, constraining one of the components to align with the symmetrical O VI absorption line. Our best fit for this aligned component finds 493 km s-1 and 20 km s-1 (see Table 9). The combination of -values results in a thermal width of 46 km s-1 and log T (K) 5.1. Therefore, we judge that this absorption system likely, but not conclusively, contains a warm absorber. This new fit is shown in Figure 12.
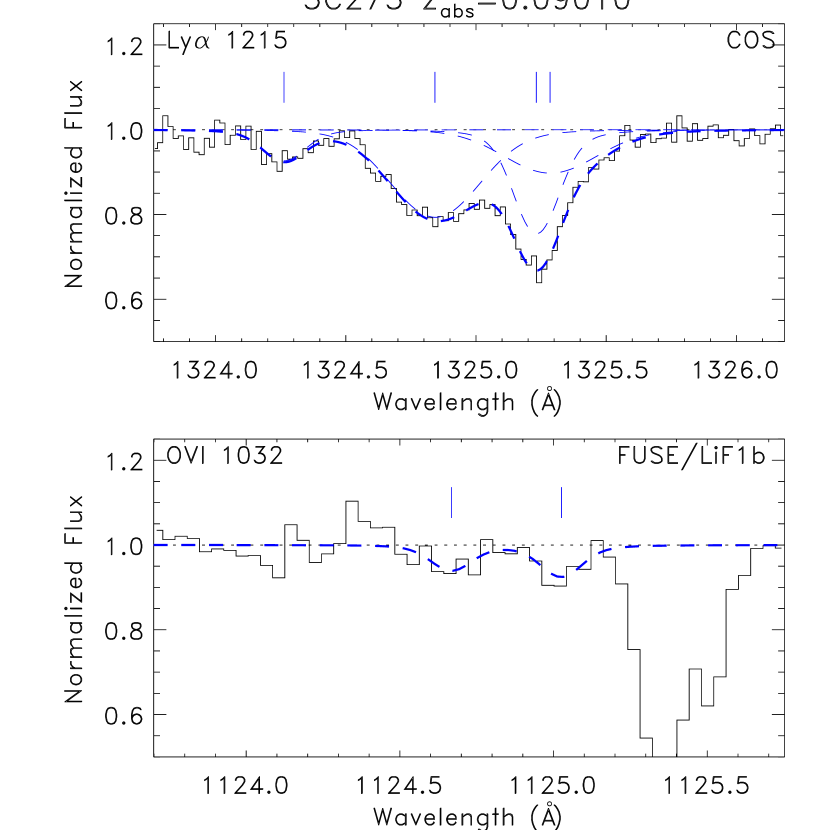
| Species | ||||
|---|---|---|---|---|
| (Å) | () | () | () | |
| Ly | 1216 | |||
| O VI | 1032 | |||
| O VI | 1038 |
A.3. PG 1116+215/0.13850
Despite a broad (b= 36 km s-1), symmetric and aligned O VI absorption line well-measured with COS, Paper 1 finds only minimal evidence for a BLA setting a temperature of log T (K)=4.72, consistent with very low density gas in photo-ionization equilibrium. The combination of the Ly and O VI -values obtained by Paper 1, suggests that the line widths are dominated by turbulence. This would be an unusual situation given the striking symmetry and lack of structure in the COS-observed O VI line.
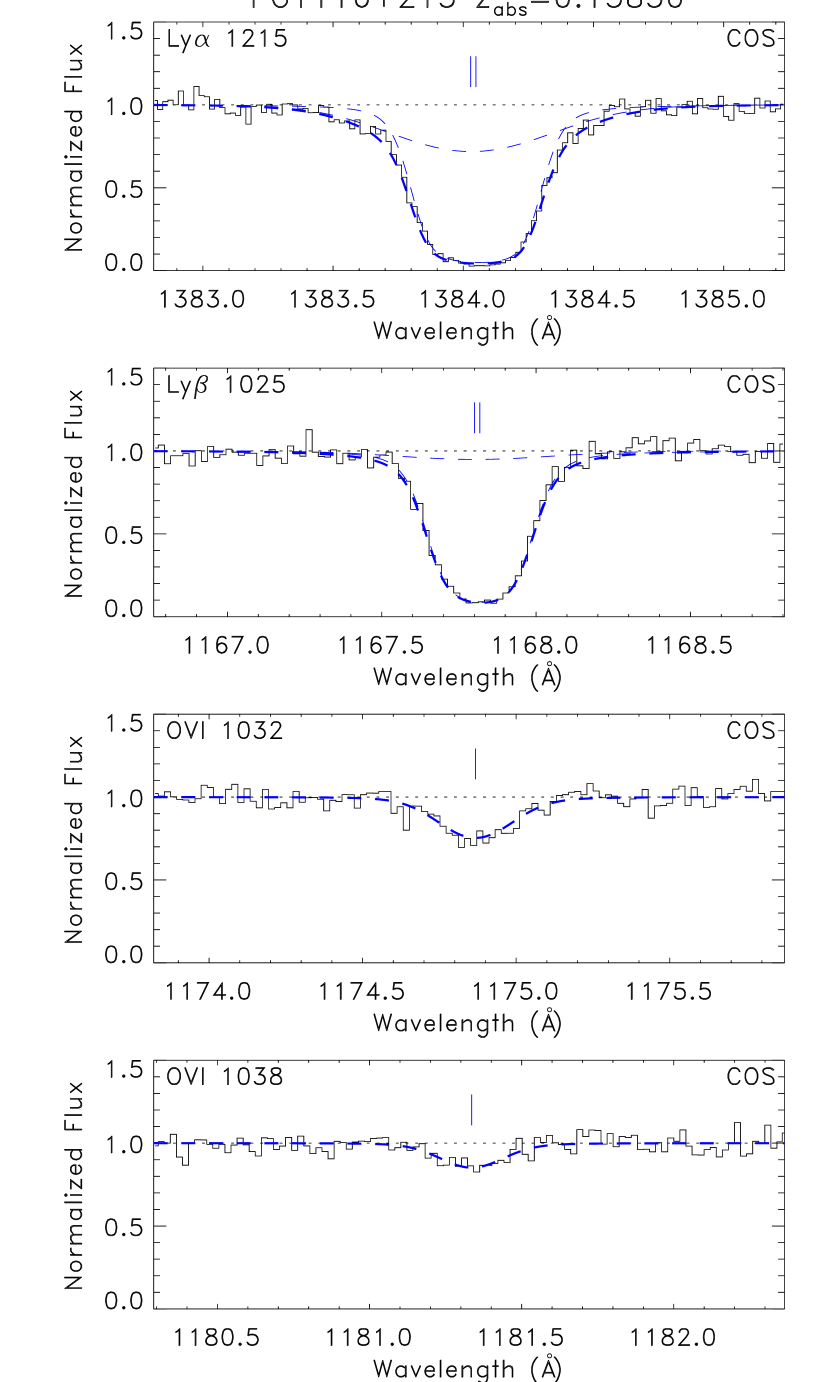
| Species | ||||
|---|---|---|---|---|
| (Å) | () | () | () | |
| Ly | 1216 | |||
| Ly | 1026 | |||
| O VI | 1032 | |||
| O VI | 1038 | |||
| N V | 1238 | |||
| Si IV | 1394 | |||
| C IV | 1548 | |||
| 1550 | ||||
| Si III | 1206 | |||
| C II | 1334 | |||
| 1036 | ||||
| Si II | 1260 | |||
| 1193 |
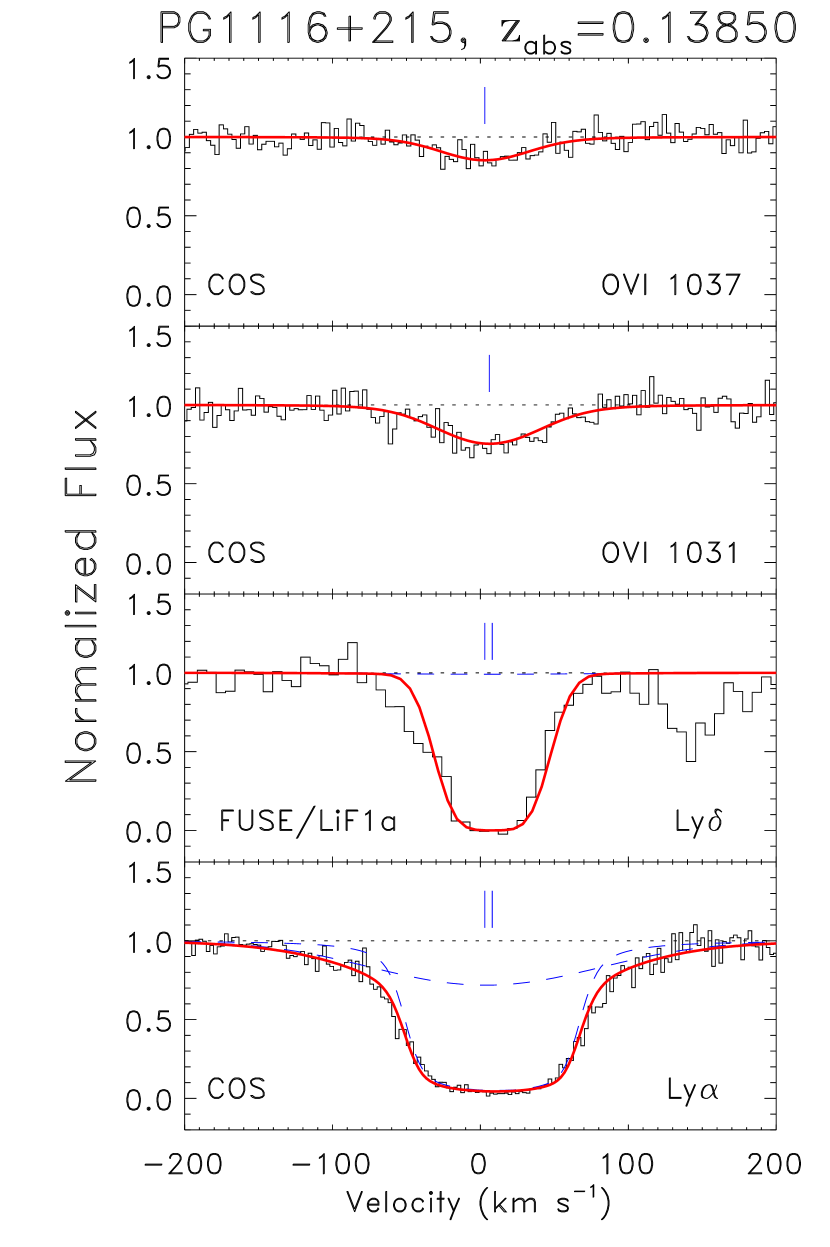
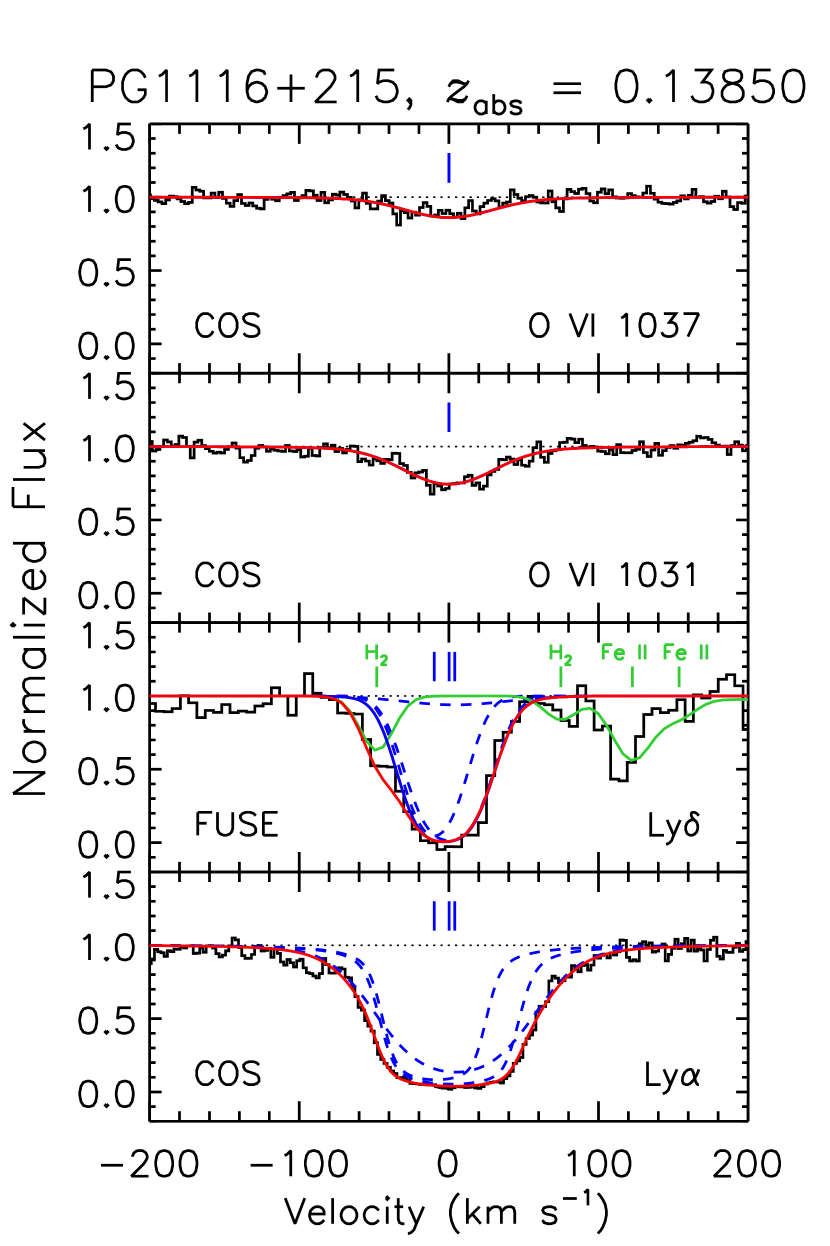
An alternate extraction of the same data by Danforth et al. (2010) finds a slightly stronger blue wing to the Ly line which is aligned with the O VI (see Figure 12). A best-fit 11 km s-1 BLA is found, which is aligned to within the velocity errors with the O VI 1031, 1038Å 5 km s-1 absorber (see Table 10). This combination of observed b-values yields 81 14 km s-1, log T (K)= 5.6 (+0.1/-0.2) and 30 km s-1. A narrower Ly component is well-matched ( 2 km s-1) to the widths of the low ion metal lines (see Figure 13 and Table 10). However, a curve-of-growth (COG) analysis using 3 Lyman-series lines finds an order of magnitude more column density than as shown for Ly in Table 7 and a 10 km s-1 lower b-value for the cool component. Also the N V 1238 Å and C IV 1548, 1550 Å absorptions have -values intermediate between the C II and O VI absorptions. Clearly the photo-ionized absorber in this system is more complex than a single homogenous cloud. Using the COG values for the cool absorber does not change the best-fit to the warm absorber component.
For clarity in Figure 14 we show the Ly absorption profiles for this absorber as extracted and fitted by Paper 1 (at left) compared to the extraction and analysis reported herein (at right). While a blue-wing is present in both cases, it is present more clearly in the extraction shown at left. In the spirit of the reanalysis presented here, we adopt the line-fit shown at left in Figure 14 in which a BLA is found coincident in velocity with the broad O VI (solution presented in Table 10). We conclude that the PG 1116+215/0.13850 absorption complex very likely contains a warm absorber.
A.4. PHL 1811/0.17651
The best fit to the 1038 Å O VI absorption is broad (b = 20 km s-1) and symmetric; the 1032 Å line is obscured by Galactic Ly. The C III 977 Å line shows two components, the red-ward component quite narrow ( 8 km s-1) and the blue-ward one unmatched either in Ly or O VI. The two-component fit to the Ly line in Paper 1 does not yield either a broad or an aligned component. Therefore, no absorber temperature was derived and no BLA obviously detected. However, the O VI velocity centroid is within the velocity spread of the Ly absorption, suggesting that a BLA at the O VI velocity could be present.
However, in investigating this system further we find that for C III the broader, blue-ward component (see Figure A4 in Paper 1) is identified as Ly at 0.12051. Additionally, Ly in this system is confused by the presence of an Fe II HVC so that little useful detail can be derived from it. Refitting Ly unconstrained by Ly can produce a two component fit with one component aligned with the broad O VI. However, the width of this line cannot be much broader than the fit in Paper 1. Therefore, our reanalysis of this system concludes that a warm absorber is not present, consistent with the conclusions of Paper 1.
A.5. H 1821+643/0.17036
In this case the O VI absorption is fitted by Paper 1 as two components, one of which is extremely broad ( 80 km s-1). However, the continuum is poorly defined in this region due to the presence to the blue of Galactic Si III and an intervening Lyman series line at a different redshift. The resulting O VI absorption is quite shallow (see Figure A6 in Paper 1) and, while a symmetrical O VI component could be present, the overall profile is not obviously Gaussian. The velocity centroid of the O VI is well within the velocity spread of the Ly absorption line complex, which is fit by three overlapping components. The best-fit solution in Paper 1 does not yield an alignment between the very broad O VI component and any of the three Ly components. A second, weaker O VI line coincident in velocity with a BLA component yields log T (K)= 5.10, but the O VI line fitting is uncertain due to an uncertain continuum.
In refitting this absorber we started by removing the higher-order Ly line at 0.29686 using a model for the line strength and width obtained using curve-of-growth fitted values. Then, instead of allowing the fit to proceed without constraint as in Paper 1, the two O VI components were constrained to align with the two higher redshift components in Ly. In this case a poorer fit to the data was obtained compared to that of Paper 1 but two aligned components resulted (see Figure 15). For the Ly/O VI component at v -100 km s-1 the fitted H I and O VI lines have nearly equal -values of 50 km s-1 implying that the line widths are dominated by NT motions and the bulk temperature of the gas is quite low, consistent with photo-ionization equilibrium. In our minimally constrained model, the component at +30 has 8 km s-1 and km s-1, an unphysical result. Adding a fourth component specifically at the broad O VI velocity is allowed by the data but results in a 50 km s-1, yielding an absorber at log T (K) 5.0, with substantial NT motions. Thus, attempts to constrain two Ly and O VI absorbers to match in velocity result in a poorer fit than in Paper 1 and no second warm absorber. Therefore, we adopt the solution of Paper 1 for this absorber as its best description.

A.6. Ton 236/0.19457
The very broad (70 km s-1) O VI measured with COS is somewhat symmetrical (see Figure A8 in Paper 1), but could have excess absorption redward of line center. Paper 1 had already fit a BLA with 82 km s-1 which left most of the total -value being due to NT motions but with a significant thermal component and a best-fit log T (K)=5.07. Thus, a warm absorber was judged to be present by Paper 1.
However, while neither the O VI nor the Ly profiles demand it (i.e., the fits obtained in Paper 1 are fully acceptable), we have refit both lines with two components. The second component in O VI is 70 km s-1 redward of the stronger component shown in Paper 1, Figure A8. Constraining Ly to match the two O VI components results in two BLAs with = 45 and 90 km s-1. These fits are shown in Figure 16 with parameters listed in Table 11. This alternative fit confirms that at least one warm absorber is present and that two broad components can fit these data. However, even attempting to constrain the lower redshift Ly absorber does not yield a velocity alignment with the O VI and further requires . Thus, this component is significantly misaligned and the O VI and Ly -values cannot be used to constrain physical conditions. The higher redshift component has the Ly and O VI lines aligned to within the rather wide errors. Adopting km s-1 for the higher redshift absorber yields a thermal 83 (+16/-24) km s-1 and log T (K)= 5.8 (+0.2/-0.3). This is hotter than the warm absorber derived in Paper 1. Although this two-component fit is not demanded by the data, the O VI and Ly profiles are suggestive of two absorbers, so we adopt the solution in Table 11 for the best description for this absorber. A single warm absorber is confirmed but at a higher temperature than derived by Paper 1.
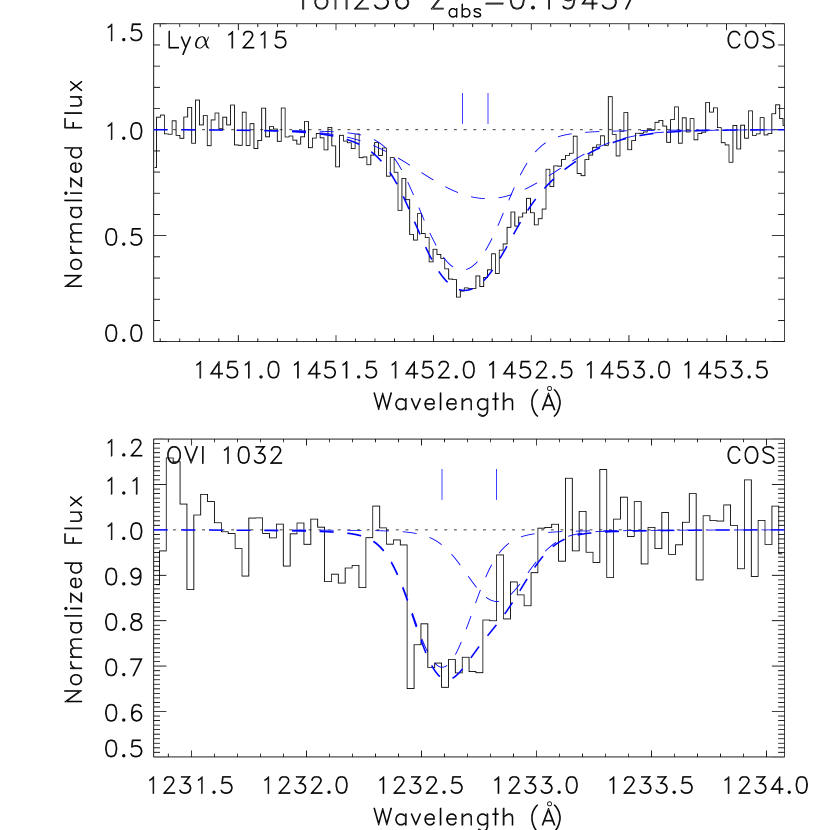
| Species | ||||
|---|---|---|---|---|
| (Å) | () | () | () | |
| Ly | 1216 | |||
| O VI | 1032 | |||
A.7. HE 0153-4520/0.40052
Both the O VI and the H I are broad and have a complex profile in this absorber. Because the Ly components are comparably broad to the O VI components aligned with them, Paper 1 judged most of the b-value to be NT and derived temperatures consistent with photo-ionization in a very low density gas.
A reanalysis of this system finds good two-component fits to O VI, Ly and Ly, which are not inconsistent with the detailed fits in Paper 1. We conclude that, while a BLA is present, the -values are consistent with photo-ionized gas in this system. Thus, we adopt the component fit of Paper 1 and conclude that no warm absorber is present.
A.8. PKS 0405-123/0.09657
Due to potentially different wavelength calibrations for the O VI line in the FUSE band and the Ly line in the COS band, Paper 1 questioned whether the broad, symmetric O VI absorption at this redshift was associated with a narrow or a broad Ly absorption, which differ only by 11 km s-1. In the end Paper 1 concluded that the broad O VI was better aligned with the narrow Ly requiring log T (K) = 4.30 (+0.21/-01.02), but noted that the warm absorber association appeared equally likely.
In this absorber the Ly line is detected clearly in the FUSE spectrum adjacent to the O VI absorber at a velocity 17 km s-1 lower than the O VI absorption based on our analysis. The detected Ly must be associated almost exclusively with the narrow Ly component, which is 4–5 times stronger than the BLA. This analysis provides a wavelength offset for these two spectra which places the O VI absorption much closer in velocity to the BLA ( v = 6 km s-1) than the narrow H I component. We conclude that the O VI is associated with a BLA in a warm absorber and retain the values suggested in Paper 1, including log T(K)=5.480.05. However, because the PIE/CIE determination rests solely on a wavelength solution which is uncertain at the level to which these two absorption systems differ, we conclude that this absorber’s temperature can not be determined within a reasonable doubt. On this basis we have excluded this system from the analysis herein and ascribe it neither as a warm nor a cool absorber.
A.9. PKS 0405-123/0.29770
In this case, the O VI absorption is very broad and symmetrical. In order to fit Ly with the minimum number of components (2), the width of the Ly is only slightly broader than its associated O VI. Paper 1 judged this O VI absorber to have a width dominated by NT motions and a derived temperature of log T (K) =4.62 consistent with photo-ionization in a low density gas.
The symmetrical O VI absorption suggests that the dominant broadening mechanism in this absorber is thermal. In this case a third component was added at the velocity of the broad O VI absorber to the two found in Paper 1. The resulting three Ly components are shown in Figure 17 with their particulars recorded in Table 12. While the -value of the very broad component is not tightly constrained, a significant column density BLA with = 86 (+14/-17) km s-1 is suggested which results in log T (K) = 5.7(+0.1/-0.2), considerably hotter than the model adopted in Paper 1. We adopt this new three component fit which results in a new warm absorber in the sample.
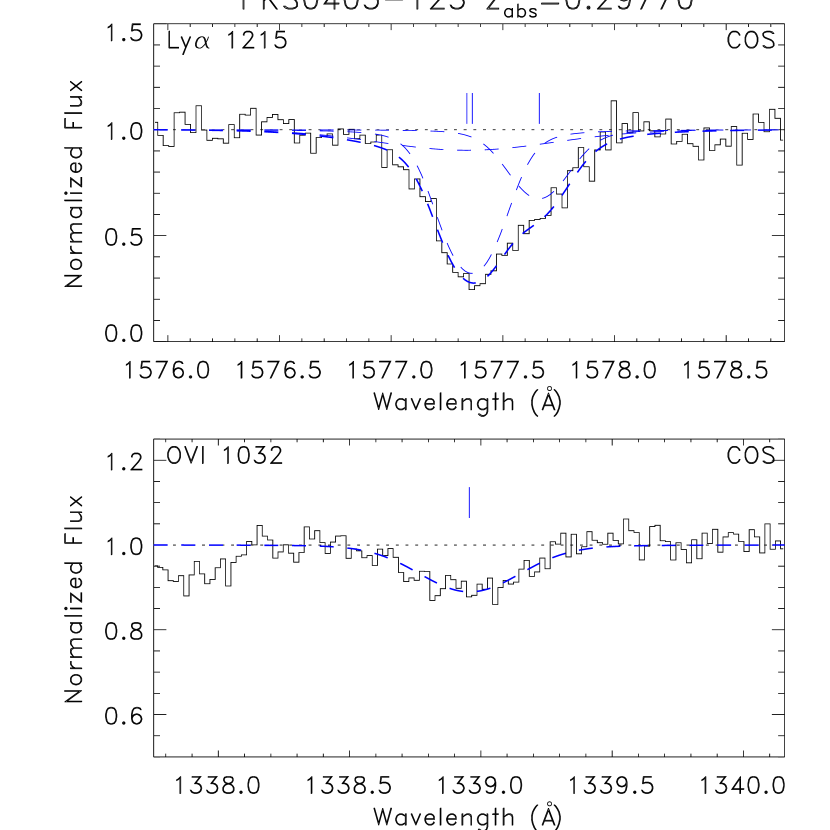
| Species | ||||
|---|---|---|---|---|
| (Å) | () | () | () | |
| Ly | 1216 | |||
| O VI | 1032 |
A.10. 3C 263/0.11389
This absorber has an O VI aligned with a rather narrow (= 20 km s-1) H I line leading Paper 1 to conclude that this absorber is in photo-ionization equilibrium. In addition, there are two BLAs with no associated O VI absorptions. Therefore, these absorbers are judged to be misaligned and are not interpreted in Paper 1.
Our analysis reproduces the detailed three component fits in Paper 1, including the exact -values of each H I component. In addition, we use the FUSE Ly absorption to make a two-line (Ly/Ly) COG analysis which finds = 48 km s-1 for the lowest velocity component, consistent with the =471 derived from the Ly line alone. This consistency suggests, but does not demand, that the lowest velocity H I component at v = -219 km s-1 is a metal-deficient BLA and warm absorber. The v = -44 km s-1 component is confirmed by our reanalysis to have a large -value but the absence of detectable Ly for this component leaves us unable to draw any firm conclusion as to its physical details. Additionally, the v = -44 km s-1 portion of the Ly absorption complex (see Figure A13 in Paper 1) appears to have structure in the absorption making it an unlikely BLA. We conclude that the detailed fit to this absorber obtained by Paper 1 is the best description of this absorber but also that an H I-only warm absorber is possibly present with log T (K) 5.14.
Appendix B Basic Galaxy Data for Group Members Associated with Warm, Cool and Misaligned Absorbers
In this Appendix we tabulate the group members for all warm, cool and misaligned absorbers (in that order) with N 8 members (see Tables 5,6 & 7 in the main text). The absorber 3C 263/0.11389 with Ngrp = 7 members has been added because it may contain a warm absorber (see Appendix A and Figure 7). The galaxy redshift data comes from a variety of sources including a combined redshift catalog of nearby galaxy redshifts (Catalog Stocke et al., 2006); the Sloan Digital Sky Survey [SDSS]; and our own MOS galaxy redshift surveys in Australia [AAT] or at WIYN or CTIO [HYDRA] (Keeney et al., 2014). A complete listing of all galaxies surveyed in these latter redshift surveys will be presented at a later time (Keeney et al., 2014). See Section 3 in the main text for a description of these various sources which are listed in column (4) of the following tables.
These tables include by column: (1) galaxy name or “…” if unnamed; (2) and (3) galaxy RA and DEC in J2000.0 equinox coordinates; (4) the source for the redshift as described above; (5) the heliocentric redshift ( 30 km s-1); (6) the galaxy g-band luminosity in L∗ units; (7) the impact parameter from the sightline to the galaxy in kpc; (8)the impact parameter from the sightline to the galaxy in units of the galaxy’s virial radius (see Figure 1 in Stocke et al., 2013); and (9) the velocity difference between the galaxy and the absorber.
| Name | Position | Source | |||||
|---|---|---|---|---|---|---|---|
| (J2000) | () | (kpc) | () | ||||
| McLin77 | 12:29:50.50, +02:02:08.8 | Catalog | 0.00519 | 0.009 | 46 | 0.81 | |
| TGN388Z111 | 12:29:50.57, +02:01:54.2 | Catalog | 0.00540 | 0.012 | 46 | 0.79 | |
| TGN387Z059 | 12:28:15.95, +01:49:43.7 | Catalog | 0.00300 | 0.021 | 77 | 1.20 | |
| A1225+0152 | 12:27:46.50, +01:36:03.0 | Catalog | 0.00433 | 0.021 | 141 | 2.19 | |
| 12285+0157 | 12:31:03.80, +01:40:34.0 | Catalog | 0.00369 | 0.043 | 155 | 2.12 | |
| 12277+0254 | 12:30:14.20, +02:37:32.0 | Catalog | 0.00545 | 0.057 | 160 | 2.08 | |
| 12265+0300 | 12:29:02.80, +02:43:19.0 | Catalog | 0.00525 | 0.061 | 168 | 2.14 | |
| A1225+0258 | 12:28:15.90, +02:42:02.0 | Catalog | 0.00777 | 0.021 | 171 | 2.66 | |
| NGC 4420 | 12:26:58.00, +02:29:39.0 | Catalog | 0.00565 | 0.489 | 174 | 1.21 | |
| A1224+0146 | 12:27:15.60, +01:29:24.0 | Catalog | 0.00425 | 0.028 | 183 | 2.71 | |
| TGN387Z165 | 12:25:42.12, +02:09:24.8 | Catalog | 0.00500 | 0.021 | 216 | 3.36 | |
| A1225+0311 | 12:28:03.40, +02:54:37.0 | Catalog | 0.00496 | 0.073 | 225 | 2.77 | |
| TGN389Z231 | 12:32:46.45, +01:34:07.2 | Catalog | 0.00510 | 0.014 | 260 | 4.33 | |
| IC 3474 | 12:32:37.00, +02:39:51.0 | Catalog | 0.00576 | 0.073 | 268 | 3.30 | |
| A1230+0254 | 12:32:51.90, +02:37:46.0 | Catalog | 0.00592 | 0.021 | 277 | 4.31 | |
| TGN389Z221 | 12:33:20.76, +01:31:21.1 | Catalog | 0.00600 | 0.045 | 297 | 4.04 | |
| 12:32:50.55, +02:47:50.3 | SDSS | 0.00359 | 0.009 | 300 | 5.31 | ||
| TGN388Z200 | 12:34:27.59, +02:11:11.3 | Catalog | 0.00550 | 0.012 | 337 | 5.79 | |
| 12:34:22.02, +02:19:31.4 | SDSS | 0.00587 | 0.078 | 337 | 4.08 | ||
| NGC 4536 | 12:34:26.90, +02:11:18.0 | Catalog | 0.00603 | 2.410 | 337 | 1.39 | |
| NGC 4533 | 12:34:21.00, +02:19:34.0 | Catalog | 0.00585 | 0.097 | 337 | 3.86 | |
| NGC 4527 | 12:34:08.80, +02:39:13.0 | Catalog | 0.00579 | 1.562 | 350 | 1.66 | |
| TGN386Z061 | 12:23:30.01, +02:00:28.7 | Catalog | 0.00600 | 0.014 | 352 | 5.87 | |
| TGN386Z065 | 12:23:23.33, +01:48:53.5 | Catalog | 0.00600 | 0.014 | 364 | 6.07 | |
| A1232+0250 | 12:34:34.10, +02:34:11.0 | Catalog | 0.00616 | 0.028 | 366 | 5.43 | |
| 12:34:34.99, +02:34:07.8 | SDSS | 0.00615 | 0.012 | 367 | 6.30 | ||
| NGC 4457 | 12:28:59.20, +03:34:16.0 | Catalog | 0.00294 | 1.165 | 382 | 1.99 | |
| A1227+0353 | 12:29:39.20, +03:36:43.0 | Catalog | 0.00446 | 0.066 | 393 | 4.92 | |
| 12234+0342 | 12:25:58.96, +03:25:38.3 | Catalog | 0.00476 | 0.073 | 397 | 4.88 | |
| 12:25:58.36, +03:25:49.0 | SDSS | 0.00472 | 0.083 | 398 | 4.73 | ||
| A1230+0338 | 12:32:55.60, +03:21:34.0 | Catalog | 0.00245 | 0.073 | 406 | 4.99 | |
| 12:32:54.95, +03:21:46.3 | SDSS | 0.00253 | 0.002 | 407 | 8.76 | ||
| 12213+0321 | 12:23:54.20, +03:05:07.0 | Catalog | 0.00620 | 0.052 | 417 | 5.50 | |
| 12221+0335 | 12:24:40.10, +03:18:10.0 | Catalog | 0.00309 | 0.080 | 420 | 5.06 | |
| 12204+0302 | 12:22:56.40, +02:44:49.0 | Catalog | 0.00617 | 0.057 | 425 | 5.51 | |
| 12194+0237 | 12:21:57.50, +02:20:40.0 | Catalog | 0.00611 | 0.047 | 455 | 6.14 | |
| TGN321Z038 | 12:32:25.84, +00:24:09.4 | Catalog | 0.00470 | 0.002 | 464 | 9.99 | |
| TGN321Z031 | 12:32:33.54, +00:24:17.1 | Catalog | 0.00420 | 0.005 | 467 | 9.17 | |
| NGC 4517A | 12:32:28.20, +00:23:23.0 | Catalog | 0.00510 | 0.513 | 468 | 3.22 | |
| TGN321Z040 | 12:32:27.68, +00:22:07.7 | Catalog | 0.00490 | 0.012 | 472 | 8.11 | |
| NGC 4544 | 12:35:36.60, +03:02:04.3 | Catalog | 0.00385 | 0.128 | 477 | 5.09 | |
| 12314+0349 | 12:33:55.40, +03:32:52.0 | Catalog | 0.00380 | 0.057 | 482 | 6.25 | |
| 12:26:13.90, +03:50:13.7 | SDSS | 0.00270 | 0.002 | 483 | 10.40 | ||
| TGN320Z113 | 12:29:03.86, +00:06:13.7 | Catalog | 0.00380 | 0.031 | 490 | 7.15 | |
| NGC 4496A | 12:31:39.20, +03:56:23.0 | Catalog | 0.00577 | 1.174 | 500 | 2.61 | |
| 12:24:41.31, +03:43:17.4 | SDSS | 0.00620 | 0.012 | 503 | 8.64 | ||
| A1222+0400 | 12:24:41.70, +03:43:35.0 | Catalog | 0.00621 | 0.047 | 504 | 6.80 | |
| NGC 4412 | 12:26:35.80, +03:57:57.0 | Catalog | 0.00765 | 0.369 | 506 | 3.87 | |
| 12309+0404 | 12:33:29.50, +03:47:40.0 | Catalog | 0.00304 | 0.038 | 517 | 7.27 | |
| TGN322Z243 | 12:33:58.59, +00:23:12.3 | Catalog | 0.00520 | 0.005 | 518 | 10.17 | |
| A1231+0400 | 12:34:16.90, +03:44:04.0 | Catalog | 0.00809 | 0.002 | 533 | 11.47 | |
| NGC 4517 | 12:32:45.40, +00:06:54.0 | Catalog | 0.00374 | 1.968 | 538 | 2.37 | |
| NGC 4480 | 12:30:26.50, +04:14:53.0 | Catalog | 0.00816 | 0.321 | 558 | 4.47 | |
| TGN385Z025 | 12:20:11.20, +01:57:29.6 | Catalog | 0.00680 | 0.017 | 561 | 9.12 | |
| 12221+0416 | 12:24:39.30, +03:59:43.0 | Catalog | 0.00575 | 0.057 | 563 | 7.30 | |
| A1224+0432 | 12:27:16.40, +04:15:42.0 | Catalog | 0.00546 | 0.012 | 567 | 9.74 | |
| NGC 4581 | 12:38:05.15, +01:28:40.3 | Catalog | 0.00606 | 0.321 | 582 | 4.67 | |
| A1220+0400 | 12:22:41.30, +03:43:34.0 | Catalog | 0.00621 | 0.047 | 582 | 7.85 | |
| TGN390Z245 | 12:38:05.30, +01:28:44.2 | Catalog | 0.00580 | 0.095 | 582 | 6.70 | |
| TGN385Z034 | 12:19:53.06, +01:46:23.5 | Catalog | 0.00660 | 0.028 | 583 | 8.64 | |
| 12:20:33.95, +02:58:04.0 | SDSS | 0.00796 | 0.002 | 583 | 12.55 | ||
| 12174+0204 | 12:19:52.00, +01:46:22.0 | Catalog | 0.00675 | 0.061 | 584 | 7.44 | |
| A1218+0314 | 12:20:33.00, +02:58:10.0 | Catalog | 0.00795 | 0.009 | 584 | 10.34 | |
| A1217+0203 | 12:19:51.60, +01:46:23.0 | Catalog | 0.00630 | 0.035 | 585 | 8.32 | |
| 12:26:24.54, +04:19:00.8 | SDSS | 0.00775 | 0.002 | 594 | 12.79 | ||
| NGC 4587 | 12:38:35.50, +02:39:24.0 | Catalog | 0.00301 | 0.128 | 614 | 6.55 | |
| 12:36:34.93, +03:38:31.3 | SDSS | 0.00595 | 0.005 | 616 | 12.09 | ||
| TGN389Z074 | 12:38:21.72, +01:12:06.9 | Catalog | 0.00420 | 0.007 | 619 | 11.45 | |
| 12217+0430 | 12:24:14.40, +04:13:33.0 | Catalog | 0.00392 | 0.061 | 626 | 7.97 | |
| A1222+0441 | 12:25:08.60, +04:24:59.0 | Catalog | 0.00409 | 0.012 | 644 | 11.06 | |
| A1218+0403 | 12:21:19.50, +03:46:40.0 | Catalog | 0.00812 | 0.007 | 653 | 12.08 | |
| NGC 4289 | 12:21:02.40, +03:43:20.0 | Catalog | 0.00873 | 0.073 | 658 | 8.10 | |
| A1230+0451 | 12:32:57.60, +04:34:40.0 | Catalog | 0.00411 | 0.073 | 679 | 8.35 | |
| 12:32:58.82, +04:34:45.0 | SDSS | 0.00405 | 0.007 | 680 | 12.58 | ||
| 12373+0156 | 12:39:50.10, +01:40:26.0 | Catalog | 0.00409 | 0.047 | 680 | 9.17 | |
| TGN389Z019 | 12:39:50.38, +01:40:21.5 | Catalog | 0.00430 | 0.052 | 680 | 8.96 | |
| TGN322Z009 | 12:39:02.47, +00:50:58.5 | Catalog | 0.00540 | 0.014 | 693 | 11.55 | |
| A1218+0421 | 12:21:19.50, +04:04:40.0 | Catalog | 0.00660 | 0.028 | 705 | 10.45 | |
| 12342+0423 | 12:36:49.10, +04:06:17.0 | Catalog | 0.00205 | 0.033 | 707 | 10.20 | |
| A1223+0505 | 12:25:33.20, +04:48:54.0 | Catalog | 0.00812 | 0.002 | 729 | 15.69 | |
| NGC 4599 | 12:40:27.09, +01:11:48.8 | Catalog | 0.00612 | 0.243 | 744 | 6.54 | |
| 12:21:39.57, +04:23:33.7 | SDSS | 0.00381 | 0.005 | 751 | 14.74 | ||
| NGC 4600 | 12:40:22.99, +03:07:03.6 | Catalog | 0.00263 | 0.243 | 756 | 6.65 | |
| NGC 4303 | 12:21:54.90, +04:28:25.0 | Catalog | 0.00523 | 5.673 | 757 | 2.34 | |
| NGC 4303A | 12:22:27.30, +04:33:58.0 | Catalog | 0.00429 | 0.080 | 757 | 9.12 | |
| 12:22:25.80, +04:34:04.8 | SDSS | 0.00428 | 0.005 | 758 | 14.88 | ||
| 12:22:27.24, +04:34:33.0 | SDSS | 0.00448 | 0.009 | 759 | 13.44 | ||
| NGC 4378 | 12:25:18.07, +04:55:30.0 | Catalog | 0.00854 | 0.851 | 761 | 4.42 | |
| 12166+0408 | 12:19:09.90, +03:51:19.0 | Catalog | 0.00509 | 0.116 | 771 | 8.47 | |
| 12177+0429 | 12:20:17.10, +04:12:05.0 | Catalog | 0.00578 | 0.061 | 773 | 9.84 | |
| 12:41:11.58, +01:24:37.0 | SDSS | 0.00565 | 0.050 | 775 | 10.31 | ||
| 12387+0140 | 12:41:11.70, +01:24:37.0 | Catalog | 0.00579 | 0.139 | 776 | 8.13 | |
| TGN390Z138 | 12:41:39.13, +01:50:16.6 | Catalog | 0.00490 | 0.021 | 789 | 12.28 | |
| TGN322Z003 | 12:40:35.23, +00:46:12.7 | Catalog | 0.00550 | 0.007 | 789 | 14.59 | |
| 12:27:26.97, +05:11:16.5 | SDSS | 0.00406 | 0.012 | 795 | 13.66 | ||
| NGC 4292 | 12:21:16.40, +04:35:47.0 | Catalog | 0.00753 | 0.168 | 806 | 8.00 | |
| NGC 4586 | 12:38:28.00, +04:19:08.0 | Catalog | 0.00266 | 0.517 | 818 | 5.62 | |
| 12:38:33.65, +04:18:28.6 | SDSS | 0.00224 | 0.066 | 820 | 10.28 | ||
| TGN390Z124 | 12:42:21.28, +02:03:59.3 | Catalog | 0.00460 | 0.040 | 831 | 11.58 | |
| 12190+0503 | 12:21:34.07, +04:46:46.4 | Catalog | 0.00740 | 0.080 | 833 | 10.04 | |
| 12214+0527 | 12:24:03.20, +05:10:47.0 | Catalog | 0.00683 | 0.057 | 847 | 10.99 | |
| 12196+0514 | 12:22:11.00, +04:57:10.0 | Catalog | 0.00638 | 0.043 | 848 | 11.63 | |
| 12:35:24.43, +05:02:53.8 | SDSS | 0.00606 | 0.009 | 850 | 15.05 | ||
| NGC 4234 | 12:17:07.89, +03:40:56.3 | Catalog | 0.00676 | 0.255 | 855 | 7.40 | |
| 12:17:09.15, +03:40:59.2 | SDSS | 0.00672 | 0.165 | 855 | 8.49 | ||
| 12225+0537 | 12:25:05.40, +05:19:46.0 | Catalog | 0.00662 | 0.052 | 861 | 11.35 | |
| 12:25:35.33, +05:22:51.7 | SDSS | 0.00774 | 0.007 | 865 | 16.00 | ||
| 12:32:36.19, +05:23:17.1 | SDSS | 0.00281 | 0.005 | 866 | 17.00 | ||
| 12:40:25.92, +04:03:00.5 | SDSS | 0.00243 | 0.005 | 869 | 17.06 | ||
| 12:42:59.75, +02:06:03.1 | SDSS | 0.00286 | 0.002 | 872 | 18.77 | ||
| NGC 4636 | 12:42:49.80, +02:41:17.0 | Catalog | 0.00365 | 2.897 | 876 | 3.38 | |
| 12:19:27.76, +04:34:42.5 | SDSS | 0.00571 | 0.014 | 877 | 14.62 | ||
| TGN250Z171 | 12:36:07.69, –00:59:18.7 | Catalog | 0.00320 | 0.007 | 882 | 16.31 | |
| 12194+0523 | 12:22:01.29, +05:06:00.2 | Catalog | 0.00637 | 0.080 | 885 | 10.66 | |
| NGC 4324 | 12:23:05.70, +05:14:59.0 | Catalog | 0.00556 | 0.657 | 887 | 5.61 | |
| TGN390Z102 | 12:43:19.56, +01:58:55.0 | Catalog | 0.00440 | 0.180 | 892 | 8.68 | |
| NGC 4643 | 12:43:20.20, +01:58:41.0 | Catalog | 0.00440 | 1.621 | 893 | 4.19 | |
| 12:18:17.92, +04:24:07.9 | SDSS | 0.00666 | 0.005 | 899 | 17.65 | ||
| 12:42:17.85, +03:28:07.4 | SDSS | 0.00244 | 0.014 | 901 | 15.02 | ||
| A1216+0456 | 12:19:05.60, +04:39:33.0 | Catalog | 0.00783 | 0.019 | 907 | 14.41 | |
| NGC 4592 | 12:39:19.10, –00:31:55.0 | Catalog | 0.00360 | 0.768 | 912 | 5.46 | |
| 12:19:21.12, +04:46:24.5 | SDSS | 0.00689 | 0.005 | 917 | 18.00 | ||
| TGN322Z068 | 12:40:08.85, –00:21:04.7 | Catalog | 0.00530 | 0.038 | 919 | 12.92 | |
| 12:41:57.06, +03:49:09.4 | SDSS | 0.00294 | 0.009 | 920 | 16.29 | ||
| 12254+0600 | 12:27:55.80, +05:43:19.0 | Catalog | 0.00751 | 0.073 | 925 | 11.38 | |
| 12325+0542 | 12:35:02.80, +05:25:34.0 | Catalog | 0.00287 | 0.038 | 926 | 13.02 | |
| 12:32:25.50, +05:39:19.7 | SDSS | 0.00371 | 0.005 | 929 | 18.24 | ||
| 12:20:40.14, +05:06:18.2 | SDSS | 0.00563 | 0.009 | 932 | 16.50 | ||
| 12:41:45.19, +04:00:23.6 | SDSS | 0.00265 | 0.012 | 933 | 16.03 | ||
| 12152+0446 | 12:17:47.80, +04:28:38.0 | Catalog | 0.00701 | 0.038 | 935 | 13.15 | |
| NGC 4255 | 12:18:56.10, +04:47:12.0 | Catalog | 0.00652 | 0.293 | 938 | 7.75 | |
| 12:43:53.53, +02:37:59.6 | SDSS | 0.00462 | 0.007 | 939 | 17.36 | ||
| 12:18:11.61, +04:38:40.3 | SDSS | 0.00702 | 0.009 | 945 | 16.73 | ||
| 12:44:14.96, +02:27:43.2 | SDSS | 0.00287 | 0.002 | 956 | 20.58 | ||
| 12:43:21.06, +03:25:13.0 | SDSS | 0.00317 | 0.007 | 957 | 17.70 | ||
| NGC 4376 | 12:25:18.10, +05:44:30.0 | Catalog | 0.00379 | 0.203 | 957 | 8.93 | |
| NGC 4300 | 12:21:41.48, +05:23:05.1 | Catalog | 0.00771 | 0.203 | 958 | 8.94 | |
| 12404+0357 | 12:42:56.20, +03:40:36.0 | Catalog | 0.00315 | 0.066 | 958 | 12.01 | |
| A1240+0341 | 12:43:22.20, +03:25:05.0 | Catalog | 0.00318 | 0.019 | 958 | 15.22 | |
| 12:21:15.35, +05:20:30.7 | SDSS | 0.00785 | 0.005 | 962 | 18.89 | ||
| 12383+0448 | 12:40:50.20, +04:31:38.0 | Catalog | 0.00239 | 0.038 | 963 | 13.54 | |
| 12:40:50.33, +04:31:33.0 | SDSS | 0.00249 | 0.035 | 963 | 13.70 | ||
| 12:23:18.44, +05:36:25.8 | SDSS | 0.00602 | 0.009 | 964 | 17.06 | ||
| 12169+0519 | 12:19:27.80, +05:02:51.0 | Catalog | 0.00614 | 0.061 | 965 | 12.29 | |
| 12233+0605 | 12:25:52.80, +05:48:30.0 | Catalog | 0.00513 | 0.061 | 965 | 12.29 | |
| 12:30:41.99, +05:52:43.6 | SDSS | 0.00771 | 0.005 | 966 | 18.97 | ||
| NGC 4630 | 12:42:31.40, +03:57:37.0 | Catalog | 0.00247 | 0.423 | 968 | 7.08 | |
| NGC 4423 | 12:27:09.20, +05:52:47.0 | Catalog | 0.00369 | 0.128 | 969 | 10.34 | |
| 12:44:07.96, +03:00:22.1 | SDSS | 0.00449 | 0.014 | 973 | 16.22 | ||
| 12:29:45.22, +05:55:12.8 | SDSS | 0.00274 | 0.012 | 973 | 16.72 | ||
| TGN391Z146 | 12:44:33.40, +01:44:12.8 | Catalog | 0.00320 | 0.021 | 973 | 15.14 | |
| 12:18:20.56, +04:51:13.6 | SDSS | 0.00691 | 0.007 | 975 | 18.03 | ||
| TGN323Z228 | 12:42:27.78, +00:02:51.7 | Catalog | 0.00500 | 0.017 | 978 | 15.90 | |
| 12:19:49.15, +05:11:06.1 | SDSS | 0.00651 | 0.019 | 979 | 15.55 | ||
| g1239340-005113 | 12:39:33.95, –00:51:13.2 | Catalog | 0.00558 | 0.021 | 982 | 15.28 | |
| 12:37:07.02, +05:25:17.9 | SDSS | 0.00390 | 0.017 | 984 | 16.00 | ||
| 12346+0542 | 12:37:06.00, +05:25:17.0 | Catalog | 0.00375 | 0.038 | 984 | 13.84 | |
| TGN391Z147 | 12:44:34.40, +01:16:30.3 | Catalog | 0.00380 | 0.019 | 990 | 15.73 | |
| NGC 4580 | 12:37:48.30, +05:22:09.0 | Catalog | 0.00345 | 0.522 | 996 | 6.80 | |
| NGC 4632 | 12:42:32.03, –00:04:57.1 | Catalog | 0.00574 | 0.820 | 999 | 5.90 | |
| NGC 4268 | 12:19:47.20, +05:17:02.0 | Catalog | 0.00687 | 0.217 | 1000 | 9.12 |
| Name | Position | Source | |||||
|---|---|---|---|---|---|---|---|
| (J2000) | () | (kpc) | () | ||||
| 15:35:14.26, +57:30:53.2 | SDSS | 0.01033 | 0.073 | 302 | 3.72 | ||
| 15:38:02.75, +57:30:18.3 | SDSS | 0.01180 | 0.021 | 375 | 5.89 | ||
| NGC 5987 | 15:39:57.38, +58:04:46.3 | Catalog | 0.01004 | 1.700 | 434 | 2.00 | |
| NGC 5965A | 15:34:13.80, +57:17:06.0 | Catalog | 0.01104 | 0.169 | 499 | 4.92 | |
| 15:30:40.83, +57:53:01.1 | SDSS | 0.00969 | 0.001 | 526 | 12.30 | ||
| A1540+5741 | 15:41:09.60, +57:31:51.0 | Catalog | 0.01210 | 0.023 | 608 | 9.35 | |
| 15:37:42.04, +57:05:06.5 | SDSS | 0.01158 | 0.027 | 650 | 9.73 | ||
| 15:33:57.97, +56:50:50.4 | SDSS | 0.01081 | 0.059 | 827 | 10.63 | ||
| 15:35:58.84, +56:41:08.3 | SDSS | 0.01068 | 0.012 | 927 | 15.85 | ||
| 15:43:31.90, +57:14:34.0 | SDSS | 0.01322 | 0.015 | 929 | 15.45 | ||
| NGC 5965 | 15:34:02.30, +56:41:06.0 | Catalog | 0.01138 | 1.550 | 946 | 4.50 | |
| 15:34:02.29, +56:41:08.5 | SDSS | 0.01127 | 1.120 | 946 | 5.01 | ||
| 15:40:54.32, +56:51:39.0 | SDSS | 0.01141 | 0.034 | 947 | 13.59 | ||
| 15:33:25.64, +56:41:56.5 | SDSS | 0.01117 | 0.013 | 950 | 16.02 | ||
| 15:38:44.84, +56:42:50.4 | SDSS | 0.01060 | 0.001 | 952 | 22.27 | ||
| 15436+5732 | 15:44:53.50, +57:21:42.0 | Catalog | 0.01320 | 0.090 | 1007 | 11.78 | |
| 15:33:24.55, +56:36:31.5 | SDSS | 0.01178 | 0.053 | 1017 | 13.31 | ||
| 15:45:18.25, +57:24:34.9 | SDSS | 0.01323 | 0.081 | 1031 | 12.34 | ||
| 15:44:34.42, +57:12:43.7 | SDSS | 0.01187 | 0.042 | 1033 | 14.16 | ||
| 15:35:36.90, +56:27:42.1 | SDSS | 0.01121 | 0.377 | 1098 | 8.35 | ||
| NGC 5971 | 15:35:36.00, +56:27:38.0 | Catalog | 0.01174 | 0.390 | 1099 | 8.28 | |
| 15:35:27.41, +56:01:58.0 | SDSS | 0.01124 | 0.027 | 1425 | 21.32 | ||
| 15:30:51.80, +55:53:17.1 | SDSS | 0.01089 | 0.035 | 1620 | 23.04 | ||
| 15:31:04.87, +55:44:16.9 | SDSS | 0.01116 | 0.087 | 1722 | 20.23 |
| Name | Position | Source | |||||
|---|---|---|---|---|---|---|---|
| (J2000) | () | (kpc) | () | ||||
| PROCHASKA_22_1734 | 21:54:59.90, –09:22:24.0 | Catalog | 0.08098 | 0.723 | 35 | 0.21 | |
| PROCHASKA_22_2091 | 21:54:50.80, –09:22:33.0 | Catalog | 0.07880 | 0.324 | 235 | 1.88 | |
| PROCHASKA_22_2033 | 21:54:52.20, –09:24:37.0 | Catalog | 0.08080 | 0.089 | 283 | 3.31 | |
| PROCHASKA_22_2226 | 21:54:47.50, –09:22:54.0 | Catalog | 0.07765 | 0.944 | 310 | 1.75 | |
| PROCHASKA_22_2103 | 21:54:50.90, –09:20:03.0 | Catalog | 0.07942 | 0.318 | 312 | 2.52 | |
| PROCHASKA_22_2225 | 21:54:47.30, –09:23:05.0 | Catalog | 0.07791 | 0.103 | 317 | 3.59 | |
| PROCHASKA_22_1202 | 21:55:14.10, –09:24:34.0 | Catalog | 0.08157 | 0.179 | 336 | 3.27 | |
| PROCHASKA_22_1109 | 21:55:16.40, –09:24:07.0 | Catalog | 0.07376 | 0.838 | 360 | 2.11 | |
| PROCHASKA_22_1987 | 21:54:52.60, –09:26:28.0 | Catalog | 0.07963 | 0.307 | 410 | 3.34 | |
| PROCHASKA_22_2411 | 21:54:43.10, –09:19:48.0 | Catalog | 0.07838 | 0.058 | 465 | 6.02 | |
| PROCHASKA_22_1217 | 21:55:13.70, –09:18:05.0 | Catalog | 0.07458 | 0.861 | 467 | 2.69 | |
| PROCHASKA_22_1070 | 21:55:17.30, –09:17:51.0 | Catalog | 0.07339 | 3.623 | 532 | 1.91 | |
| 21:55:06.03, –09:16:27.0 | SDSS | 0.07866 | 0.797 | 538 | 3.20 | ||
| PROCHASKA_22_1134 | 21:55:15.80, –09:27:21.0 | Catalog | 0.07769 | 0.253 | 539 | 4.71 | |
| PROCHASKA_22_2234 | 21:54:47.90, –09:17:18.0 | Catalog | 0.08199 | 0.509 | 542 | 3.72 | |
| PROCHASKA_22_1795 | 21:54:58.00, –09:28:30.0 | Catalog | 0.07691 | 0.090 | 546 | 6.39 | |
| PROCHASKA_22_864 | 21:55:23.60, –09:19:06.0 | Catalog | 0.07369 | 0.052 | 566 | 7.50 | |
| PROCHASKA_22_2238 | 21:54:47.00, –09:28:01.0 | Catalog | 0.07359 | 0.398 | 591 | 4.42 | |
| PROCHASKA_22_2031 | 21:54:53.10, –09:15:58.0 | Catalog | 0.07811 | 1.084 | 600 | 3.20 | |
| PROCHASKA_22_1851 | 21:54:56.30, –09:29:17.0 | Catalog | 0.08070 | 0.171 | 621 | 6.12 | |
| PROCHASKA_22_2727 | 21:54:33.20, –09:23:31.0 | Catalog | 0.08006 | 0.146 | 627 | 6.48 | |
| PROCHASKA_22_1119 | 21:55:16.10, –09:29:09.0 | Catalog | 0.07749 | 0.155 | 678 | 6.87 | |
| PROCHASKA_22_1106 | 21:55:16.30, –09:29:22.0 | Catalog | 0.07971 | 0.238 | 697 | 6.16 | |
| 21:54:34.68, –09:27:16.6 | AAT | 0.07595 | 0.068 | 729 | 9.09 | ||
| PROCHASKA_22_2480 | 21:54:41.60, –09:15:46.0 | Catalog | 0.07545 | 0.216 | 733 | 6.75 | |
| PROCHASKA_22_1691 | 21:55:01.80, –09:14:03.0 | Catalog | 0.07896 | 0.164 | 742 | 7.37 | |
| PROCHASKA_22_879 | 21:55:22.30, –09:29:07.0 | Catalog | 0.07636 | 0.554 | 750 | 5.04 | |
| PROCHASKA_22_400 | 21:55:34.00, –09:19:35.0 | Catalog | 0.08104 | 0.105 | 754 | 8.48 | |
| PROCHASKA_22_2801 | 21:54:31.10, –09:18:23.0 | Catalog | 0.07732 | 0.064 | 755 | 9.50 | |
| PROCHASKA_22_1659 | 21:55:02.50, –09:13:54.0 | Catalog | 0.07955 | 0.340 | 755 | 5.96 | |
| PROCHASKA_22_2239 | 21:54:46.40, –09:30:11.0 | Catalog | 0.07963 | 1.135 | 765 | 4.02 | |
| PROCHASKA_22_2284 | 21:54:46.90, –09:14:31.0 | Catalog | 0.07862 | 0.120 | 770 | 8.35 | |
| 21:54:45.83, –09:30:12.7 | AAT | 0.07958 | 0.190 | 773 | 7.37 | ||
| PROCHASKA_22_297 | 21:55:36.20, –09:20:17.0 | Catalog | 0.07805 | 0.461 | 782 | 5.59 | |
| PROCHASKA_22_2576 | 21:54:39.10, –09:15:32.0 | Catalog | 0.07950 | 0.119 | 783 | 8.57 | |
| PROCHASKA_22_2689 | 21:54:34.60, –09:16:32.0 | Catalog | 0.07854 | 1.567 | 786 | 3.74 | |
| PROCHASKA_22_2136 | 21:54:49.00, –09:30:47.0 | Catalog | 0.07779 | 0.262 | 792 | 6.80 | |
| PROCHASKA_22_2896 | 21:54:28.40, –09:18:49.0 | Catalog | 0.07764 | 0.108 | 792 | 8.80 | |
| PROCHASKA_22_1668 | 21:55:00.60, –09:31:28.0 | Catalog | 0.08306 | 2.183 | 804 | 3.41 | |
| PROCHASKA_22_2612 | 21:54:37.20, –09:15:34.0 | Catalog | 0.07813 | 4.084 | 807 | 2.78 | |
| g2155080-091324 | 21:55:07.96, –09:13:23.9 | Catalog | 0.07450 | 2.143 | 812 | 3.47 | |
| PROCHASKA_22_870 | 21:55:22.70, –09:30:00.0 | Catalog | 0.07864 | 0.130 | 818 | 8.72 | |
| PROCHASKA_22_1871 | 21:54:56.90, –09:13:13.0 | Catalog | 0.07834 | 0.349 | 822 | 6.44 | |
| PROCHASKA_22_2921 | 21:54:27.00, –09:26:15.0 | Catalog | 0.08080 | 0.088 | 829 | 9.74 | |
| PROCHASKA_22_1401 | 21:55:08.10, –09:31:54.0 | Catalog | 0.08156 | 0.131 | 855 | 9.06 | |
| PROCHASKA_22_769 | 21:55:25.00, –09:30:19.0 | Catalog | 0.07835 | 0.153 | 870 | 8.86 | |
| PROCHASKA_22_1295 | 21:55:10.80, –09:32:07.0 | Catalog | 0.07850 | 0.226 | 885 | 8.02 | |
| PROCHASKA_22_544 | 21:55:29.90, –09:29:38.0 | Catalog | 0.07758 | 1.378 | 893 | 4.41 | |
| PROCHASKA_22_2620 | 21:54:37.70, –09:14:03.0 | Catalog | 0.07867 | 0.050 | 906 | 12.05 | |
| 21:54:52.92, –09:32:43.0 | AAT | 0.08201 | 0.369 | 934 | 7.15 | ||
| 21:54:55.71, –09:32:59.5 | AAT | 0.08388 | 0.398 | 948 | 7.09 | ||
| 21:54:20.06, –09:18:02.7 | AAT | 0.08104 | 0.063 | 986 | 12.50 | ||
| 21:54:50.43, –09:33:18.5 | AAT | 0.08051 | 0.197 | 997 | 9.37 | ||
| 21:55:11.32, –09:33:46.4 | AAT | 0.08024 | 0.352 | 1031 | 8.02 | ||
| 21:54:39.86, –09:32:43.3 | AAT | 0.07923 | 0.366 | 1031 | 7.95 | ||
| 21:54:18.95, –09:17:03.0 | AAT | 0.07826 | 0.177 | 1046 | 10.17 | ||
| PROCHASKA_22_3117 | 21:54:20.90, –09:29:20.0 | Catalog | 0.07860 | 0.405 | 1081 | 8.03 | |
| 21:54:20.02, –09:29:26.0 | AAT | 0.08065 | 0.077 | 1102 | 13.34 | ||
| 21:55:14.56, –09:34:33.4 | AAT | 0.07868 | 0.376 | 1116 | 8.49 | ||
| 21:55:48.71, –09:17:37.5 | SDSS | 0.07898 | 0.371 | 1117 | 8.55 | ||
| 21:55:50.89, –09:26:27.2 | AAT | 0.08096 | 0.202 | 1139 | 10.63 | ||
| 21:55:04.74, –09:35:19.8 | AAT | 0.08012 | 2.723 | 1149 | 4.51 | ||
| 21:54:16.31, –09:29:01.6 | AAT | 0.07901 | 0.211 | 1150 | 10.63 | ||
| 21:55:42.38, –09:30:48.0 | AAT | 0.07848 | 0.310 | 1164 | 9.48 | ||
| 21:55:43.25, –09:30:41.5 | AAT | 0.07842 | 0.334 | 1173 | 9.34 | ||
| 21:54:50.83, –09:35:25.0 | AAT | 0.07859 | 0.216 | 1178 | 10.84 | ||
| 21:54:13.89, –09:15:49.9 | AAT | 0.08093 | 0.195 | 1195 | 11.31 | ||
| 21:55:40.09, –09:32:50.7 | AAT | 0.07754 | 0.087 | 1253 | 14.72 | ||
| 21:55:50.78, –09:15:10.2 | AAT | 0.07735 | 0.255 | 1255 | 10.86 | ||
| 21:54:07.71, –09:17:07.7 | AAT | 0.07938 | 0.062 | 1267 | 16.14 | ||
| 21:55:09.46, –09:36:45.2 | AAT | 0.07425 | 0.072 | 1285 | 15.81 | ||
| 21:55:31.71, –09:34:53.6 | AAT | 0.08208 | 0.131 | 1290 | 13.66 | ||
| 21:54:46.09, –09:08:21.1 | AAT | 0.07720 | 0.340 | 1292 | 10.19 | ||
| 21:54:10.22, –09:15:11.3 | AAT | 0.08052 | 0.075 | 1293 | 15.69 | ||
| 21:54:21.17, –09:33:07.7 | AAT | 0.07719 | 0.058 | 1298 | 16.80 | ||
| 21:55:09.13, –09:36:55.8 | AAT | 0.08048 | 0.211 | 1300 | 12.02 | ||
| 21:54:17.84, –09:32:37.8 | AAT | 0.07929 | 0.244 | 1318 | 11.59 | ||
| 21:54:04.06, –09:27:17.0 | AAT | 0.07616 | 0.349 | 1330 | 10.42 | ||
| 21:54:55.92, –09:37:30.2 | AAT | 0.07937 | 0.298 | 1345 | 11.11 | ||
| 21:55:48.56, –09:32:37.0 | AAT | 0.08027 | 0.135 | 1372 | 14.47 | ||
| 21:54:46.57, –09:37:31.3 | AAT | 0.07796 | 0.077 | 1381 | 16.72 | ||
| 21:56:04.86, –09:21:20.3 | SDSS | 0.07805 | 0.525 | 1390 | 9.48 | ||
| 21:54:27.72, –09:35:47.9 | AAT | 0.08075 | 0.436 | 1400 | 10.17 | ||
| 21:55:59.72, –09:29:04.4 | AAT | 0.08252 | 0.075 | 1405 | 17.05 | ||
| 21:55:49.71, –09:33:12.1 | AAT | 0.07804 | 0.130 | 1425 | 15.20 | ||
| 21:55:11.66, –09:38:16.9 | AAT | 0.07769 | 0.313 | 1426 | 11.51 | ||
| 21:55:41.45, –09:35:08.3 | HYDRA | 0.07963 | 0.324 | 1429 | 11.46 | ||
| 21:54:59.90, –09:38:38.3 | AAT | 0.07863 | 0.697 | 1441 | 8.97 | ||
| 21:55:26.03, –09:37:31.3 | AAT | 0.07926 | 0.055 | 1445 | 18.83 | ||
| 21:54:35.43, –09:37:22.7 | AAT | 0.08112 | 0.136 | 1446 | 15.25 | ||
| 21:55:03.46, –09:39:17.7 | AAT | 0.08134 | 0.123 | 1499 | 16.17 | ||
| 21:54:35.95, –09:06:41.8 | AAT | 0.07479 | 0.137 | 1502 | 15.73 | ||
| 21:53:52.61, –09:21:11.5 | AAT | 0.07863 | 0.302 | 1512 | 12.40 | ||
| 21:54:19.54, –09:08:15.4 | AAT | 0.07693 | 0.070 | 1556 | 19.23 | ||
| 21:54:05.09, –09:11:40.4 | SDSS | 0.07907 | 1.041 | 1560 | 8.46 | ||
| 21:54:08.93, –09:34:23.5 | AAT | 0.07922 | 0.280 | 1567 | 13.15 | ||
| 21:54:09.08, –09:10:09.9 | SDSS | 0.08109 | 0.420 | 1580 | 11.63 | ||
| 21:55:50.88, –09:35:28.2 | AAT | 0.07922 | 0.147 | 1585 | 16.29 | ||
| 21:55:22.66, –09:05:18.5 | SDSS | 0.07589 | 0.647 | 1586 | 10.10 | ||
| 21:55:50.87, –09:36:17.9 | AAT | 0.07982 | 1.045 | 1639 | 8.88 | ||
| 21:56:00.82, –09:33:41.5 | AAT | 0.07913 | 0.288 | 1640 | 13.67 | ||
| 21:54:34.96, –09:39:42.2 | AAT | 0.07377 | 1.035 | 1641 | 8.96 | ||
| 21:54:32.19, –09:05:10.0 | AAT | 0.08522 | 0.094 | 1659 | 19.22 | ||
| 21:54:47.69, –09:40:59.7 | AAT | 0.08299 | 0.559 | 1677 | 11.18 | ||
| 21:53:52.58, –09:13:59.6 | AAT | 0.07460 | 0.218 | 1684 | 15.36 | ||
| 21:54:03.47, –09:35:06.0 | AAT | 0.08117 | 0.235 | 1698 | 15.13 | ||
| 21:56:02.76, –09:34:18.6 | AAT | 0.07968 | 0.065 | 1707 | 21.49 | ||
| 21:54:37.22, –09:40:51.5 | AAT | 0.08110 | 0.197 | 1722 | 16.18 | ||
| 21:55:40.31, –09:40:03.6 | AAT | 0.08155 | 0.044 | 1782 | 24.26 | ||
| 21:53:49.75, –09:11:05.2 | AAT | 0.07361 | 0.060 | 1865 | 23.86 | ||
| 21:54:07.47, –09:05:51.9 | AAT | 0.07431 | 0.080 | 1885 | 22.71 | ||
| 21:55:53.24, –09:40:20.9 | AAT | 0.08044 | 0.188 | 1954 | 18.75 | ||
| 21:55:42.92, –09:41:58.9 | AAT | 0.07654 | 1.045 | 1959 | 10.62 | ||
| 21:53:58.38, –09:06:37.3 | SDSS | 0.07937 | 0.496 | 1968 | 13.65 | ||
| 21:56:03.02, –09:38:53.6 | AAT | 0.07526 | 0.171 | 1988 | 19.61 | ||
| 21:56:07.28, –09:38:14.5 | AAT | 0.07874 | 0.139 | 2012 | 21.07 | ||
| 21:56:02.00, –09:39:40.2 | AAT | 0.07868 | 0.175 | 2025 | 19.83 | ||
| 21:55:54.48, –09:41:15.7 | AAT | 0.08201 | 0.093 | 2035 | 23.58 | ||
| 21:53:55.27, –09:05:51.2 | SDSS | 0.07926 | 0.911 | 2064 | 11.71 | ||
| 21:56:35.39, –09:17:42.2 | SDSS | 0.08131 | 2.143 | 2097 | 8.97 | ||
| 21:56:13.01, –09:38:40.3 | AAT | 0.08100 | 0.465 | 2129 | 15.11 | ||
| 21:53:55.57, –09:04:37.7 | AAT | 0.07871 | 0.238 | 2139 | 18.89 | ||
| 21:56:03.60, –09:41:24.3 | AAT | 0.08110 | 0.240 | 2165 | 19.12 | ||
| 21:56:14.37, –09:41:04.4 | AAT | 0.07800 | 0.135 | 2299 | 24.24 | ||
| 21:56:15.05, –09:40:55.3 | AAT | 0.07681 | 0.179 | 2300 | 22.37 | ||
| 21:56:47.63, –09:21:46.9 | SDSS | 0.07820 | 0.369 | 2324 | 17.79 |
| Name | Position | Source | |||||
|---|---|---|---|---|---|---|---|
| (J2000) | () | (kpc) | () | ||||
| 21:55:06.29, –09:23:20.1 | AAT | 0.13743 | 0.230 | 214 | 1.92 | ||
| PROCHASKA_22_1474 | 21:55:06.50, –09:23:25.0 | Catalog | 0.13262 | 2.950 | 227 | 0.87 | |
| PROCHASKA_22_1802 | 21:54:58.40, –09:18:56.0 | Catalog | 0.13541 | 0.616 | 507 | 3.28 | |
| 21:55:09.52, –09:19:24.4 | AAT | 0.13207 | 0.230 | 512 | 4.61 | ||
| PROCHASKA_22_2425 | 21:54:42.30, –09:21:54.0 | Catalog | 0.13248 | 0.557 | 679 | 4.53 | |
| PROCHASKA_22_2426 | 21:54:42.50, –09:21:12.0 | Catalog | 0.13220 | 0.583 | 690 | 4.53 | |
| PROCHASKA_22_1848 | 21:54:56.40, –09:28:28.0 | Catalog | 0.13463 | 0.450 | 882 | 6.35 | |
| 21:55:29.92, –09:22:35.3 | AAT | 0.13980 | 0.276 | 999 | 8.44 | ||
| 21:54:47.16, –09:28:28.3 | AAT | 0.13543 | 0.557 | 1001 | 6.67 | ||
| PROCHASKA_22_2222 | 21:54:47.10, –09:28:28.0 | Catalog | 0.13557 | 0.843 | 1001 | 5.81 | |
| PROCHASKA_22_2081 | 21:54:50.90, –09:29:17.0 | Catalog | 0.13635 | 0.271 | 1048 | 8.94 | |
| PROCHASKA_22_533 | 21:55:30.70, –09:23:58.0 | Catalog | 0.13590 | 2.301 | 1050 | 4.39 | |
| PROCHASKA_22_1950 | 21:54:53.70, –09:30:04.0 | Catalog | 0.13503 | 2.218 | 1125 | 4.73 | |
| PROCHASKA_22_2459 | 21:54:40.80, –09:29:07.0 | Catalog | 0.13573 | 0.513 | 1201 | 8.25 | |
| PROCHASKA_22_213 | 21:55:38.90, –09:18:32.0 | Catalog | 0.13540 | 0.192 | 1425 | 13.58 | |
| 21:55:42.58, –09:21:48.3 | AAT | 0.13328 | 0.455 | 1446 | 10.33 | ||
| PROCHASKA_22_192 | 21:55:39.80, –09:14:52.0 | Catalog | 0.13431 | 0.446 | 1722 | 12.39 | |
| PROCHASKA_22_229 | 21:55:37.40, –09:31:37.0 | Catalog | 0.13502 | 0.797 | 1820 | 10.82 | |
| 21:55:56.17, –09:20:39.7 | SDSS | 0.13417 | 2.580 | 1937 | 7.78 | ||
| 21:55:59.91, –09:21:49.7 | SDSS | 0.13438 | 0.985 | 2054 | 11.39 | ||
| 21:55:59.85, –09:25:09.5 | AAT | 0.13403 | 0.351 | 2087 | 16.24 | ||
| 21:55:50.03, –09:32:13.0 | AAT | 0.13573 | 0.820 | 2204 | 13.01 | ||
| 21:56:00.84, –09:16:25.0 | AAT | 0.13548 | 0.159 | 2253 | 22.69 | ||
| 21:55:58.19, –09:14:30.3 | SDSS | 0.13500 | 1.340 | 2288 | 11.39 | ||
| 21:56:09.01, –09:25:39.6 | AAT | 0.13456 | 1.264 | 2417 | 12.31 | ||
| 21:56:08.83, –09:28:17.2 | AAT | 0.13637 | 0.827 | 2509 | 14.67 | ||
| 21:56:08.90, –09:28:32.0 | AAT | 0.13675 | 0.255 | 2524 | 21.83 | ||
| 21:56:14.67, –09:25:21.7 | AAT | 0.13723 | 0.342 | 2605 | 20.55 | ||
| 21:56:02.50, –09:33:18.1 | AAT | 0.13310 | 1.479 | 2646 | 12.78 | ||
| 21:56:17.16, –09:23:46.7 | AAT | 0.13427 | 0.836 | 2665 | 15.58 |
| Name | Position | Source | |||||
|---|---|---|---|---|---|---|---|
| (J2000) | () | (kpc) | () | ||||
| NGC 3104 | 10:03:57.80, +40:45:28.0 | Catalog | 0.00201 | 0.025 | 227 | 3.44 | |
| 10043+3913 | 10:07:22.90, +38:58:08.0 | Catalog | 0.00196 | 0.008 | 483 | 8.85 | |
| 10133+4125 | 10:16:15.60, +41:09:57.0 | Catalog | 0.00177 | 0.009 | 579 | 10.39 | |
| NGC 3184 | 10:18:17.20, +41:25:26.0 | Catalog | 0.00197 | 0.817 | 639 | 3.77 | |
| 10:17:32.98, +43:08:41.4 | SDSS | 0.00378 | 0.002 | 678 | 14.97 | ||
| 10:25:50.79, +43:55:58.2 | SDSS | 0.00219 | 0.001 | 947 | 22.77 | ||
| NGC 3198 | 10:19:54.80, +45:32:58.0 | Catalog | 0.00221 | 0.432 | 951 | 6.91 | |
| 10:07:18.96, +47:00:23.4 | SDSS | 0.00211 | 0.018 | 960 | 15.39 | ||
| 10042+4716 | 10:07:18.00, +47:00:22.0 | Catalog | 0.00190 | 0.027 | 960 | 14.36 | |
| 10:39:00.38, +41:40:08.8 | SDSS | 0.00226 | 0.002 | 1254 | 27.69 | ||
| NGC 3319 | 10:39:09.40, +41:41:10.0 | Catalog | 0.00247 | 0.196 | 1259 | 11.91 | |
| 10:39:12.85, +41:30:20.2 | SDSS | 0.00222 | 0.002 | 1261 | 27.84 | ||
| 10:35:12.07, +46:14:12.3 | SDSS | 0.00168 | 0.001 | 1352 | 32.51 |
| Name | Position | Source | |||||
|---|---|---|---|---|---|---|---|
| (J2000) | () | (kpc) | () | ||||
| 02:27:46.33, –40:51:17.1 | HYDRA | 0.01490 | 0.005 | 173 | 3.39 | ||
| 02:27:44.79, –41:05:23.6 | HYDRA | 0.01524 | 0.012 | 214 | 3.63 | ||
| 02:29:20.48, –41:02:30.2 | HYDRA | 0.01947 | 0.005 | 287 | 5.62 | ||
| 02:27:41.67, –41:09:48.3 | HYDRA | 0.01511 | 0.005 | 302 | 5.92 | ||
| 02:26:38.02, –40:39:17.6 | AAT | 0.01792 | 0.004 | 551 | 11.12 | ||
| N 954 | 02:28:52.20, –41:24:09.0 | Catalog | 0.01783 | 2.793 | 596 | 2.32 | |
| A0223-4039 | 02:25:14.62, –40:25:47.9 | Catalog | 0.01790 | 2.281 | 996 | 4.16 | |
| A0222-4136 | 02:24:36.00, –41:23:06.0 | Catalog | 0.01759 | 0.499 | 1044 | 7.24 | |
| A0222-4142 | 02:24:38.10, –41:28:33.0 | Catalog | 0.01679 | 0.318 | 1103 | 8.90 | |
| g0228282-420423 | 02:28:28.20, –42:04:23.1 | Catalog | 0.01562 | 0.167 | 1441 | 14.31 | |
| A0219-4142 | 02:21:26.90, –41:29:05.0 | Catalog | 0.01648 | 0.228 | 1782 | 16.03 | |
| N 893 | 02:19:58.40, –41:24:12.0 | Catalog | 0.01684 | 2.547 | 2086 | 8.38 | |
| A0219-4213A | 02:21:11.75, –42:00:05.9 | Catalog | 0.01630 | 0.891 | 2169 | 12.40 | |
| g0219535-413948 | 02:19:53.52, –41:39:48.1 | Catalog | 0.02059 | 0.220 | 2216 | 20.21 | |
| A0226-4259 | 02:28:20.23, –42:45:49.5 | Catalog | 0.01806 | 0.755 | 2328 | 14.06 | |
| IC 1812 | 02:29:31.77, –42:48:40.6 | Catalog | 0.01724 | 5.128 | 2407 | 7.68 | |
| N 889 | 02:19:06.80, –41:44:55.0 | Catalog | 0.01754 | 1.745 | 2432 | 11.14 | |
| TGS920Z268 | 02:19:20.82, –42:03:04.2 | Catalog | 0.02120 | 0.123 | 2568 | 27.71 | |
| A0227-4312 | 02:29:23.00, –42:59:04.0 | Catalog | 0.01719 | 1.312 | 2626 | 13.19 | |
| A0228-4314 | 02:30:27.88, –43:01:36.6 | Catalog | 0.01849 | 4.721 | 2719 | 8.94 | |
| A0226-4317 | 02:28:47.10, –43:04:27.0 | Catalog | 0.01683 | 1.577 | 2731 | 12.89 |
| Name | Position | Source | |||||
|---|---|---|---|---|---|---|---|
| (J2000) | () | (kpc) | () | ||||
| 13:01:14.75, +59:03:43.3 | HYDRA | 0.04608 | 0.068 | 89 | 1.11 | ||
| 13:01:01.04, +59:00:06.8 | SDSS | 0.04624 | 0.504 | 138 | 0.96 | ||
| 13:01:00.55, +58:58:04.4 | SDSS | 0.04621 | 0.752 | 238 | 1.44 | ||
| 13:00:33.95, +58:58:56.9 | SDSS | 0.04601 | 2.378 | 325 | 1.34 | ||
| 13:00:25.54, +59:02:18.6 | SDSS | 0.04658 | 0.188 | 334 | 3.20 | ||
| 13:00:50.54, +58:56:28.8 | HYDRA | 0.04627 | 0.033 | 347 | 5.00 | ||
| 13:01:40.19, +59:07:29.4 | HYDRA | 0.04700 | 0.067 | 351 | 4.38 | ||
| 13:00:22.13, +59:01:26.8 | SDSS | 0.04645 | 0.630 | 360 | 2.31 | ||
| 13:00:16.36, +59:03:18.1 | HYDRA | 0.04604 | 0.048 | 404 | 5.42 | ||
| 13:00:15.08, +59:00:21.6 | HYDRA | 0.04716 | 0.046 | 419 | 5.65 | ||
| 13:02:12.65, +59:00:36.0 | SDSS | 0.04633 | 0.192 | 429 | 4.09 | ||
| 13:00:13.21, +58:58:54.9 | SDSS | 0.04639 | 0.292 | 456 | 3.80 | ||
| 13:00:20.61, +58:55:19.8 | HYDRA | 0.04634 | 0.034 | 524 | 7.52 | ||
| 12:59:26.08, +59:01:06.5 | SDSS | 0.04668 | 2.060 | 755 | 3.27 | ||
| 13:00:23.33, +59:15:48.6 | SDSS | 0.04415 | 0.423 | 827 | 6.05 | ||
| 12:59:15.15, +58:59:11.6 | SDSS | 0.04672 | 0.197 | 846 | 8.01 | ||
| 13:03:13.51, +58:59:57.2 | SDSS | 0.04340 | 0.207 | 858 | 7.93 | ||
| 13:00:21.64, +59:18:21.6 | HYDRA | 0.04340 | 0.108 | 960 | 10.75 | ||
| 12:59:14.16, +58:50:59.5 | SDSS | 0.04620 | 0.238 | 1037 | 9.16 | ||
| 13:03:05.09, +59:14:35.4 | HYDRA | 0.04337 | 0.103 | 1043 | 11.81 | ||
| 13:00:12.07, +59:19:41.1 | HYDRA | 0.04448 | 0.157 | 1053 | 10.60 | ||
| 12:58:51.62, +59:15:58.3 | SDSS | 0.04405 | 0.494 | 1249 | 8.72 | ||
| 12:57:51.99, +59:14:43.9 | SDSS | 0.04381 | 0.332 | 1571 | 12.51 |
| Name | Position | Source | |||||
|---|---|---|---|---|---|---|---|
| (J2000) | () | (kpc) | () | ||||
| PROCHASKA_12_2071 | 11:19:05.50, +21:17:33.0 | Catalog | 0.06002 | 0.129 | 131 | 1.40 | |
| PROCHASKA_12_2154 | 11:19:03.10, +21:16:23.0 | Catalog | 0.05939 | 0.047 | 220 | 2.97 | |
| PROCHASKA_12_2048 | 11:19:05.40, +21:15:38.0 | Catalog | 0.05873 | 0.824 | 258 | 1.51 | |
| PROCHASKA_12_1571 | 11:19:19.80, +21:22:28.0 | Catalog | 0.06128 | 0.189 | 281 | 2.68 | |
| PROCHASKA_12_808 | 11:19:38.40, +21:21:42.0 | Catalog | 0.06063 | 0.246 | 504 | 4.43 | |
| PROCHASKA_12_1312 | 11:19:24.30, +21:10:30.0 | Catalog | 0.05899 | 1.458 | 655 | 3.19 | |
| A1115+2129 | 11:18:33.70, +21:13:00.0 | Catalog | 0.05963 | 1.431 | 708 | 3.44 | |
| PROCHASKA_12_674 | 11:19:42.00, +21:26:10.0 | Catalog | 0.06138 | 0.125 | 713 | 7.64 | |
| PROCHASKA_12_2 | 11:18:29.20, +21:14:00.0 | Catalog | 0.06038 | 1.258 | 730 | 3.72 | |
| A1117+2143 | 11:19:43.60, +21:26:52.0 | Catalog | 0.06055 | 2.487 | 764 | 3.09 | |
| 11:19:42.40, +21:27:16.4 | HYDRA | 0.06109 | 0.062 | 770 | 9.81 | ||
| 11:20:00.74, +21:26:45.9 | HYDRA | 0.06029 | 0.087 | 979 | 11.50 | ||
| 11:18:38.88, +21:06:37.1 | HYDRA | 0.06048 | 0.084 | 995 | 11.77 | ||
| 11:19:56.66, +21:08:45.4 | HYDRA | 0.05953 | 0.065 | 1057 | 13.31 | ||
| 11:20:12.27, +21:25:04.0 | HYDRA | 0.06016 | 0.166 | 1093 | 10.85 | ||
| A1117+2148B | 11:19:59.00, +21:31:53.0 | Catalog | 0.05976 | 0.625 | 1183 | 7.59 |
| Name | Position | Source | |||||
|---|---|---|---|---|---|---|---|
| (J2000) | () | (kpc) | () | ||||
| 09:56:12.27, +41:14:39.9 | HYDRA | 0.07018 | 0.137 | 595 | 6.23 | ||
| 09:56:11.37, +41:14:50.4 | SDSS | 0.06917 | 0.877 | 607 | 3.50 | ||
| 09:56:03.77, +41:20:03.3 | HYDRA | 0.06970 | 0.084 | 807 | 9.59 | ||
| 09:56:47.27, +41:03:27.8 | HYDRA | 0.07128 | 0.151 | 939 | 9.56 | ||
| 09:56:36.33, +41:03:04.0 | SDSS | 0.06875 | 0.615 | 996 | 6.45 | ||
| 09:56:19.93, +41:03:13.7 | SDSS | 0.06869 | 1.009 | 1068 | 5.88 | ||
| 09:56:27.65, +41:01:53.6 | HYDRA | 0.06899 | 0.241 | 1121 | 9.90 | ||
| 09:57:55.36, +41:06:25.9 | HYDRA | 0.06854 | 0.321 | 1166 | 9.35 | ||
| 09:56:40.78, +41:00:32.4 | HYDRA | 0.06794 | 0.087 | 1178 | 13.84 | ||
| 09:55:34.18, +41:11:48.9 | SDSS | 0.06878 | 0.973 | 1189 | 6.59 | ||
| 09:56:24.30, +40:57:20.5 | HYDRA | 0.06983 | 0.079 | 1477 | 17.80 | ||
| 09:57:35.08, +40:57:51.9 | HYDRA | 0.06841 | 0.121 | 1514 | 16.41 | ||
| 09:55:12.88, +41:08:51.7 | SDSS | 0.06946 | 1.858 | 1558 | 6.98 | ||
| 09:56:57.93, +40:55:31.7 | SDSS | 0.07136 | 1.849 | 1562 | 6.99 |
| Name | Position | Source | |||||
|---|---|---|---|---|---|---|---|
| (J2000) | () | (kpc) | () | ||||
| A2155-3033B | 21:58:41.60, –30:19:19.0 | Catalog | 0.05702 | 2.045 | 395 | 1.71 | |
| TGS329Z002 | 21:58:40.87, –30:19:28.8 | Catalog | 0.05660 | 2.959 | 408 | 1.57 | |
| TGS330Z126 | 21:58:23.84, –30:19:32.4 | Catalog | 0.05390 | 3.671 | 544 | 1.95 | |
| TGS330Z102 | 21:58:57.17, –30:02:45.9 | Catalog | 0.05710 | 2.495 | 689 | 2.79 | |
| TGS331Z156 | 21:59:49.75, –30:16:19.2 | Catalog | 0.05630 | 3.264 | 812 | 3.02 | |
| TGS329Z018 | 21:57:52.80, –30:19:32.6 | Catalog | 0.05680 | 0.657 | 899 | 5.69 | |
| TGS330Z061 | 22:00:02.15, –30:02:03.4 | Catalog | 0.05460 | 0.511 | 1209 | 8.31 | |
| TGS330Z063 | 22:00:01.89, –30:38:05.1 | Catalog | 0.05580 | 1.878 | 1832 | 8.20 |
| Name | Position | Source | |||||
|---|---|---|---|---|---|---|---|
| (J2000) | () | (kpc) | () | ||||
| A2155-3033B | 21:58:41.60, –30:19:19.0 | Catalog | 0.05702 | 2.045 | 415 | 1.80 | |
| TGS329Z002 | 21:58:40.87, –30:19:28.8 | Catalog | 0.05660 | 2.959 | 429 | 1.65 | |
| TGS330Z126 | 21:58:23.84, –30:19:32.4 | Catalog | 0.05390 | 3.672 | 572 | 2.05 | |
| TGS330Z102 | 21:58:57.17, –30:02:45.9 | Catalog | 0.05710 | 2.494 | 724 | 2.93 | |
| TGS331Z156 | 21:59:49.75, –30:16:19.2 | Catalog | 0.05630 | 3.263 | 854 | 3.18 | |
| TGS329Z018 | 21:57:52.80, –30:19:32.6 | Catalog | 0.05680 | 0.657 | 946 | 5.98 | |
| TGS330Z061 | 22:00:02.15, –30:02:03.4 | Catalog | 0.05460 | 0.511 | 1272 | 8.74 | |
| TGS330Z063 | 22:00:01.89, –30:38:05.1 | Catalog | 0.05580 | 1.879 | 1926 | 8.62 |
| Name | Position | Source | |||||
|---|---|---|---|---|---|---|---|
| (J2000) | () | (kpc) | () | ||||
| TGN387Z035 | 12:28:51.87, +02:06:03.2 | Catalog | 0.08970 | 1.867 | 478 | 2.14 | |
| McLin10 | 12:28:30.32, +02:10:43.8 | Catalog | 0.08760 | 0.112 | 1201 | 13.29 | |
| A1225+0227 | 12:28:28.50, +02:11:08.0 | Catalog | 0.08798 | 0.912 | 1261 | 7.16 | |
| TGN387Z067 | 12:28:07.65, +02:02:52.0 | Catalog | 0.09030 | 1.642 | 1497 | 6.95 | |
| TGN387Z068 | 12:28:06.93, +01:59:59.6 | Catalog | 0.08970 | 4.632 | 1548 | 5.09 | |
| TGN387Z042 | 12:28:34.52, +01:48:15.7 | Catalog | 0.09210 | 2.311 | 1715 | 7.17 | |
| TGN387Z088 | 12:27:46.03, +01:56:15.6 | Catalog | 0.09180 | 1.265 | 2160 | 11.00 | |
| A1225+0212 | 12:27:45.00, +01:56:15.0 | Catalog | 0.09251 | 0.759 | 2161 | 13.05 | |
| TGN387Z081 | 12:27:53.42, +01:51:24.9 | Catalog | 0.09270 | 1.917 | 2205 | 9.78 | |
| TGN387Z102 | 12:27:19.49, +02:00:41.4 | Catalog | 0.08870 | 2.554 | 2728 | 10.96 | |
| TGN387Z108 | 12:27:16.78, +02:00:33.7 | Catalog | 0.09200 | 1.069 | 2797 | 15.06 | |
| TGN387Z099 | 12:27:25.01, +01:50:59.0 | Catalog | 0.09250 | 1.059 | 2857 | 15.48 | |
| TGN387Z110 | 12:27:08.54, +01:59:41.3 | Catalog | 0.08780 | 3.438 | 3015 | 10.97 |
| Name | Position | Source | |||||
|---|---|---|---|---|---|---|---|
| (J2000) | () | (kpc) | () | ||||
| 11:40:38.59, +65:51:21.8 | HYDRA | 0.11369 | 0.375 | 691 | 5.29 | ||
| 11:39:41.36, +65:53:33.3 | HYDRA | 0.11581 | 1.713 | 743 | 3.43 | ||
| 11:39:48.94, +65:55:33.2 | HYDRA | 0.11560 | 0.455 | 970 | 6.93 | ||
| 11:39:44.02, +65:55:34.5 | SDSS | 0.11507 | 1.191 | 982 | 5.08 | ||
| 11:38:35.42, +65:53:05.2 | HYDRA | 0.11313 | 0.247 | 1232 | 10.83 | ||
| 11:38:55.34, +65:58:00.6 | HYDRA | 0.11489 | 0.557 | 1495 | 9.97 | ||
| 11:39:57.80, +66:01:19.9 | HYDRA | 0.11485 | 0.277 | 1686 | 14.25 |