An X-ray and SZ bright diffuse source toward M31: a Local Hot Bridge
Abstract
We report a large-scale () X-ray and Sunyaev-Zeldovich (SZ)-bright diffuse enhancement toward M31, which might be a Local Hot Bridge connecting the Milky Way (MW) with M31. We subtract the Galactic emission from the all-sky O VII and O VIII emission line measurement survey, and find that the emission of these two ions is enhanced within around M31. The mean emission enhancements are L.U., and L.U. for O VII and O VIII, respectively ( for both ions). We also extract the SZ signal around M31, which suggests a surface brightness of , an enhancement (and a best fit of ). These three measurements trace the hot gas with a temperature , showing similar plateau shapes (flat within , and zero beyond ). A single-phase assumption leads to a temperature of , which is determined by the O VII/O VIII line ratio. Combining X-ray and SZ measurements, we suggest that this feature is unlikely to be the hot halo around M31 (too massive) or in the MW (too high pressure and X-ray bright). The plateau shape may be explained by a cylinder connecting the MW and M31 (the Local Hot Bridge). We constrain its length to be about 400 kpc, with a radius of 120 kpc, a density of , and a metallicity of . The baryon mass is , and the oxygen mass is about , which contribute to the baryon or metal budget of the Local Group.
1. Introduction
As the best-studied galaxy, the Milky Way (MW) is found to suffer from the missing baryon problem. In the past decade, multi-wavelength observations revealed that the multi-phase medium within the virial radius of the MW could only account for of baryons (Anderson & Bregman, 2010; Gupta et al., 2012; Miller & Bregman, 2015; Zheng et al., 2019; Qu et al., 2020). Considering the MW halo mass of (Xue et al., 2008), about half of the expected baryons are still missing from observations (adopting the cosmic baryonic fraction of 0.158; Planck Collaboration et al. 2016a). One possible solution to this missing baryon problem is that baryons are beyond the virialized halo of the MW.
It is well known that the MW is embedded in the local group (LG), which is dominated by two member galaxies with similar masses: the MW and the Andromeda galaxy (M31; Einasto & Lynden-Bell 1982). The halo mass of the LG is found to be and hosts a hot gas-dominated multi-phase medium by matching the local environment (e.g., satellite galaxies) with simulations (Li & White, 2008; Nuza et al., 2014). Observationally, cool-warm clouds () are detected towards both M31 and anti-M31 directions by detecting the ultraviolet (UV) and H I high velocity clouds (Bouma et al., 2019). However, these cool-warm gases only contribute to a small fraction of the total gas mass, and it is still an open question as to the properties of the major gaseous medium associated with the LG.
Observations of X-ray and Sunyaev-Zeldovich (SZ) effect are two effective means to detect the hotter gas than the UV-tracing gas (Bregman, 2007). X-ray ions O VII and O VIII are the two most common high ionization state ions in the Universe, and trace gases at to 6.8. The SZ signal is sensitive to all hot gas (electron; ). Previous studies show that the hot gas covering the entire sky is mainly Galactic rather than from the LG (Bregman & Lloyd-Davies, 2007), which is determined by the spatial distribution of the O VII absorption equivalent width.
In this paper, we analyze the X-ray data (i.e., O VII and O VIII line measurements) and the SZ signal toward the M31 direction. We discover a diffuse hot gas feature toward M31, which is confirmed by both X-ray emission and SZ signals. This diffuse hot gas is likely to be a Local Hot Bridge connecting the MW and M31, which accounts for a significant baryonic mass. The adopted data are mainly from Henley & Shelton (2012, hereafter, HS12; O VII and O VIII line measurements) and Qu et al. (2020, in preparation; SZ extraction). The sample and data reduction are briefly introduced in Section 2. The origins of this feature and physical implications are discussed in Section 3, where we develop a toy model of the Local Hot Bridge. We summarize key results in Section 4.
2. Data and Reduction
In the following analyses, we adopt the distance to M31 of kpc (Riess et al., 2012), and assume that the projected center of the diffuse hot gas is at M31 (, = , ). Although the real center is unknown, the commonly used barycenter of LG (, = , ; Einasto & Lynden-Bell 1982) is not favored by both X-ray line measurements and SZ signals.
2.1. The O VII and O VIII Emission Measurements
The adopted O VII and O VIII emission line measurements are originally extracted by HS12. Here, we only briefly describe the criteria for the subset of data used in our study and refer readers to the original paper for the construction of the sample. Using XMM-Newton archival data, HS12 selected all observations with good time longer than 5 ks (not affected by Solar flares). They constructed two samples – a Solar wind charge exchange (SWCX) clean sample of 1868 sight lines (determined by the Solar wind proton flux); and a low extra-galactic emission sample of 1003 sight lines with an additional constraint on the X-ray flux at keV. The SWCX could introduce non-astrophysical O VII and O VIII emissions, which is problematic when extracting the all-sky diffuse emission. Therefore, a low Solar wind proton flux is crucial to have a clean sample with low SWCX contamination. The X-ray flux at keV is mainly a criterion to constrain the contamination due to background AGNs. Using the SWCX-clean and low-background sample, Miller & Bregman (2015, hereafter MB15) applied an additional filter, which cross-matches the XMM-Newton field (field of view of ) with known strong X-ray sources (e.g., ROSAT catalogs and galaxy clusters; Voges et al. 1999; Piffaretti et al. 2011) to lower possible contamination. This additional filtering leads to a sub-sample of 649 sight lines.
These 649 sight lines only have 9 sight lines in the circle around M31. To use more observations, we also include another 25 sight lines from the original sample (1868 sight lines) of HS12, which are within around M31, and have small uncertainties ( L.U. for O VII and L.U. for O VIII; L.U. has units of ). The low uncertainty criterion is also applied to the MB15 sample. We note that 7/25 sight lines are in the M31 disk, which might affect the O VII and O VIII extractions because of the thermal component in M31 disk. These additional sight lines from HS12 may have larger contamination compared to the subset used in MB15. Therefore, in the following modeling, we will lower the significance of these additional sight lines.
We examine the emission around M31 by subtracting the MW contribution, since the all-sky O VII and O VIII emission are dominated by the Galactic hot halo (Henley & Shelton, 2013). Here, we adopt the Li & Bregman (2017) model (model No. 9 in Table 1; hereafter LB17; Fig. 5 in LB17), which considered a -model and an exponential disk () with radiative transfer. For this Galactic model, we adopt the same assumptions as LB17 to correct the hydrogen absorption and the contribution due to the Local Bubble (LB).
The O VII and O VIII line measurement residuals show a north-south asymmetry. The O VII emission is systematically higher in the northern hemisphere than the southern hemisphere, while the O VIII measurements show the opposite trend. The difference between the two hemispheres is about . To better model the MW emission (649 sight line sample), we use two normalization factors to reduce the median values of the residuals to zero for the northern and southern hemispheres, respectively.
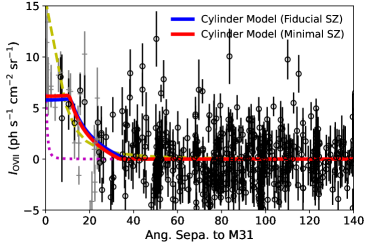
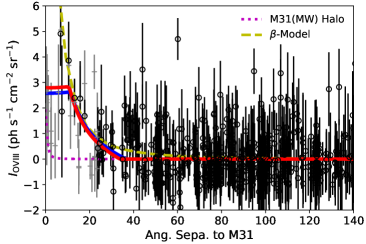
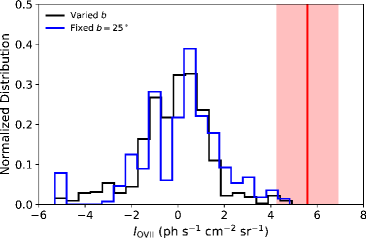
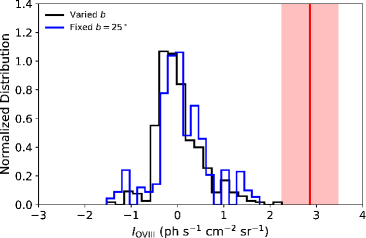
In Fig. 1, we show the residuals projected around M31. It is clear that both O VII and O VIII emission measurements show enhancements in addition to the Galactic emission. This enhancement shows a plateau shape within of M31, and decays to the zero beyond . The extra sight lines from HS12 are consistent with the MB15 sample for the O VII. The O VIII emission measurements shows 3 additional sight lines from HS12 are slightly lower ( L.U.) than the plateau of the MB15 sample within .
The X-ray emitting region around M31 has an angular diameter of . Within , the O VII enhancement (Galactic emission subtracted) has a mean value of L.U., which is about the same level as the all-sky Galactic O VII emission ( L.U. for the MB15 sample). The O VIII enhancement is about L.U. within , which is higher than the Galactic O VIII emission ( L.U.). Using the additional sight lines from HS12, the mean values are L.U. and L.U. for O VII and O VIII (excluding the central 2∘ to avoid the M31 halo or disk contribution). The final detection significance is given in Section 3.2 by a Markov chain Monte Carlo (MCMC) model, which is slightly lower ( and ) because we lower the weights of additional sight lines in the HS12 sample.
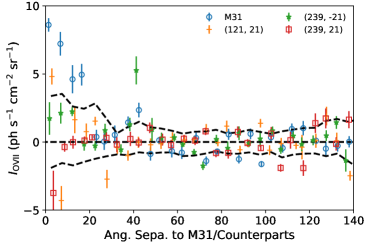
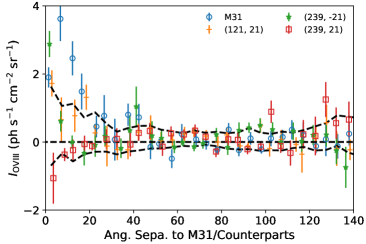
There are two caveats for this extraction, because the LB17 model only models the large scale variation of the Galactic emission, and is dominated by the hot halo of a -model. First, some X-ray studies suggest that the Galactic emission is dominated by a disk component (Nakashima et al., 2018; Kaaret et al., 2020). If the disk component is not correctly accounted for in the LB17 model, it is possible that a variation over Galactic latitudes (higher at low latitudes) leads to the observed feature around M31 because of the low latitude of M31. In Fig. 1, we plot the radial profiles of both O VII and O VIII measurements for the Galactic-symmetrical regions of M31 ( or , and ). The signal toward M31 is higher than other directions, which disfavor the possibility that the observed feature around M31 is due to unaccounted large-scale variations (i.e., the disk component).
To further investigate this possibility, we also extract 300 random sight lines over all Galactic longitudes, but with limited Galactic latitudes () to represent the disk variation at similar latitudes of M31. The radial profile uncertainty is plotted in the middle panels of Fig. 1. It is clear that only the M31 direction shows a significant enhancement within away from M31. We also note that the mean residuals of O VII and O VIII emission are slightly positive around M31 ( L. U.), which may be evidence for the disk component enhancement. However, the significance of this enhancement is about and for O VII and O VIII, respectively, which is likely to be random variation. Also, even if this enhancement is real, it only affects the measurement of the X-ray enhancement around M31 by , and should not affect the detection of the M31 enhancement. However, it may influence the derivation of the mass and the metallicity (see discussions in Section 3.4).
Second, the auto-correlation suggests there are remained features in the residuals of O VII and O VIII measurements. We simulate random sight lines to test whether the feature around M31 is due to the random variation of all-sky Galactic emission rather than a disk variation. We extract 1000 random sight lines over the entire sky, and calculate the median of residuals within for each sight line. We mask out the region around M31 to avoid a contribution from the M31 feature to null tests. None of these random sight lines has a similar strength of the feature seen toward M31. Based on this test (Fig. 1), the significance is and for O VII and O VIII, respectively. For the simulation of limited latitudes (), the extracted significance is reduced to and for O VII and O VIII. We note that O VII is more affected by features in the disk (e.g., supernova remnants), leading to larger residuals and a somewhat lower significance.
2.2. The SZ Extraction
The adopted SZ data in this work will be described in Qu et al. (2020, in preparation) as a part of the all-sky large scale SZ signal. Here, we briefly discuss the data reduction. We combine the nine-year WMAP (Bennett et al., 2013) and the Planck data release 3 (PR3) single frequency maps (Planck Collaboration et al., 2018) to extract the SZ signal. A low-pass filter is applied to extract large-scale features (FWHM ). To avoid the dust contamination, we masked out of the highest intensity dust region around the sky (determined in the Planck 353 GHz map), and the PCCS catalog for point sources (Planck Collaboration et al., 2016b). We also exclude the region around the ecliptic plane (), because the Zodiacal dust contribution is not fully removed in the PR3 maps, showing significant zodiacal contamination of the SZ (Qu et al. 2020 in preparation). After these exclusions, of the sky remains. Toward M31 there are useful SZ signals from the half of , mainly due to Galactic dust exclusion regions.
We use the internal linear combination (ILC) method to extract large scale features. The standard ILC method minimizes the variance of the extracted SZ map, which could introduce bias reducing the SZ signal strength (more details in Eriksen et al. 2004; Delabrouille et al. 2009). Here, we use the ILC to do the model fitting, which has an input model for the large scale features. We minimize the variance of the SZ residual maps (i.e., the difference between the extracted SZ map and the input model) instead of the extracted SZ map (the standard ILC). Therefore, this is a model-dependent extraction of the SZ signal, and we vary the input model to minimize the variance of the residual map. Then, the SZ extraction and model fitting are performed simultaneously.
Our fiducial input model includes four large scale features: the foreground MW SZ, the feature around M31, the local Universe SZ (e.g., the Virgo cluster), and the cosmic SZ background (i.e., the integration over all redshifts). The MW foreground SZ is decomposed into two components: a Gaussian disk; and a spherical -model halo. The feature around M31 is modeled as a cored power-law (), where is the angular distance from the center of M31, and with a fixed core radius of (100 kpc at M31). The local Universe SZ is constructed based on the low- galaxy group and cluster catalog from Lim et al. (2017, ). For each halo, the total SZ is calculated by using the mass-SZ scaling relationship from Pratt & Bregman (2020, extrapolated from 13.25 to 13), and the universal pressure profile is adopted from Arnaud et al. (2010). The cosmic SZ is modeled as a constant over the entire sky since the large scale variations are included in the local Universe SZ component. Using the MCMC model, we constrain the parameters in these components. Our fitting results suggested that these four components are significant (). In this paper, we focus on the feature around M31, while more results on other components will be discussed in Qu et al. (2020, in preparation).
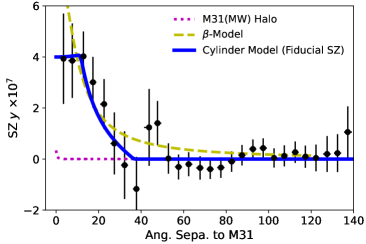
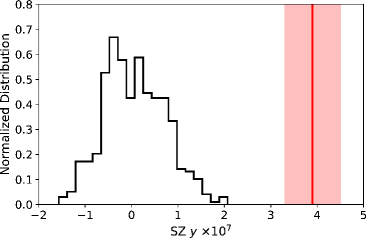
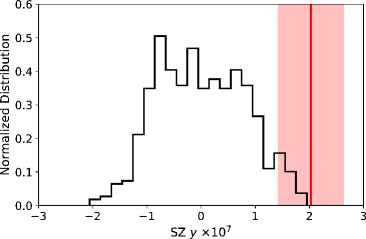
The final M31 features are extracted from the M31 model along with the total residual (the total model subtracted from the extracted SZ map). We extract the radial profile in bins of in Fig. 2, where the input model is also plotted. A cored power-law model over-predicts the SZ signal for , but the residual could correct this tendency. The final extracted SZ shows a significant plateau at within . We refer to this extraction as the fiducial SZ signal, which is preferred.
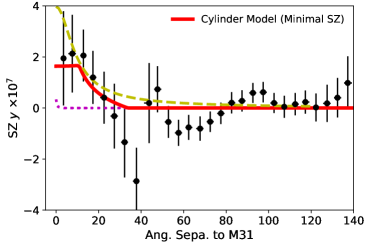
The model-dependent extraction of signals may have biases that overestimate the signal, so we test whether one could see similar signals without the input model. In Fig. 2, we also show the case in which only the local Universe and the cosmic SZ components are included in the extraction, which leaves out the MW and M31 components. This extraction shows a similar plateau shape, but the strength is about half of the fiducial extraction (). However, the background around M31 shows large scale structures, which are corrected in the fiducial extraction. This extraction leads to the minimal SZ signal, because the ILC method has a bias to reduce the signal (Delabrouille et al., 2009). The ILC bias is the systematic cancelling of the SZ signal due to empirical correlation between the SZ signal and random noise or astrophysical signals (e.g., the dust, the point sources). According to Delabrouille et al. (2009), we estimate the ILC bias for our extraction is about , which is considerable relative to the total SZ signal.
The uncertainty of the SZ extraction has two origins, the model uncertainty obtained from the MCMC model, and the residual variation (including measurement uncertainties and contaminations). Using the MCMC chain, the model uncertainty is extracted, which is less than around M31, so the final uncertainty is dominated by the residual variation. We calculate the global standard deviation over the entire sky (except for the region around M31 within ), and scaled it by a power law with the number of independent spherical harmonic modes in each angular bin. For the entire sky, there are 1466 independent modes for FWHM , and 328 modes left after the masking. Then, we can use the number of pixels to calculate the equivalent number of modes in each bin, and subsequently, the uncertainty. This uncertainty leads to a reduced for regions from M31, which are expected to have no features.
We use two means to determine the significance of the SZ extraction. The direct calculation is the integration of the radial profiles within , which gives a significance of and for fiducial and minimal extractions, respectively. In another estimation, we simulate 1000 random sight lines over the entire sky, and extract the median SZ within around these sight lines. For these sight lines, we require that there should be more than 1000 pixels (pixel size of ) within the region (affected by the mask), since the region around M31 has 1244 pixels, and a small number of pixels leads to a larger uncertainty. Based on the SZ distribution of simulated sight lines (Fig. 2), we determine that the median SZ signal around M31 is away from the random distribution for the fiducial extraction, and for the minimal extraction. The simulation significances are slightly smaller than the local significance, which indicates that there are still unaccounted features in the sky (e.g., small-scale Galactic features or contamination).
3. Physical Conditions of the Hot Gas
3.1. A -Model Halo?
We rule out this feature to be the M31 hot halo for two reasons. First, one needs a core radius of 200 kpc to explain the plateau of , which would be quite unusual for a galaxy group (typical values of tens of kpc). Second, using the SZ signal, one could estimate the total mass at a given temperature. For M31 (an MW-like galaxy), the halo temperature is about K. Then, one could estimate the mass of such a SZ feature to be
| (1) |
where is the SZ strength of the plateau, is the distance of the hot gas, and is the temperature. Such a massive hot medium exceeds the cosmic baryonic fraction (; Planck Collaboration et al. 2016a). The halo mass of the local group is (12.26 to 12.83; ; Li & White 2008), and the expected total baryonic mass is about . A mass of is too large by a factor of to be physically plausible.
If this -model halo is between M31 and MW (400 kpc to MW), the required core radius is about 100 kpc, which is larger than generally seen in galaxy groups but not unreasonably so (Mulchaey, 2000). The estimated mass will be about . However, a model (typical values of galaxy groups) suggests a long tail to larger angles (Fig. 2). Using current data, the SZ signal does not favor a long tail, while the existence of this long tail cannot be distinguished by the O VII and O VIII emission measurements (Fig. 1). A varied extraction leads to , which is not found for the -model of galaxies or galaxy groups (Osmond & Ponman, 2004). Therefore, we do not favor this explanation either, but this is not a completely unphysical model.
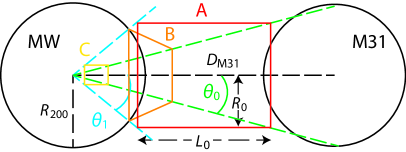
3.2. A Galactic Source?
We consider whether the detected diffuse feature belongs to Galactic structures (e.g., Case B and C in Fig. 3). We derive the scaling relationships between physical parameters with the distance under the observational constraints. Here, we assume that the hot diffuse structure has a length of and a radius of . Then, the two ratios of and are determined by and .The temperature is a constant that is determined by the O VII/O VIII ratio. Two other constraints and are also constant, determined by the SZ and the O VII or O VIII emission. At a distance of (in units of 10 kpc), the scaling relations (with the fiducial SZ value) will be
| (2) |
is the total luminosity of O VII and O VIII, and and are the X-ray bolometric luminosity and the X-ray surface brightness. To convert to , we adopt the APEC model (Smith et al., 2001). This conversion factor is proportional to the inverse of the metallicity, because when , the X-ray emissivity is dominated by bremsstrahlung emission rather than metal lines.
This feature can not be too close to the Sun (e.g., kpc), or it would have been discovered by all-sky X-ray surveys (e.g., ROSAT; Snowden et al. 1997) because of the high surface brightness (). As a comparison, the unabsorbed Galactic X-ray emission is about . Also, the mass of the this feature will be larger than at kpc, which is unlikely to be a feature in the disk.
We also suggest that this hot gas structure cannot be in the MW halo ( kpc) because of the resulting high pressure. In the MW halo, the typical ambient gas pressure is about , where is 200 times the critical matter density, and is the virial temperature. If the detected hot gas structure is about 100 kpc away from the Sun, the hot gas pressure will be about , two orders of magnitude greater than expectations. Therefore, it is very unlikely to be a structure in the MW halo.
3.3. The Local Hot Bridge Connecting MW and M31 – A Single-Phase Toy Model
The plateau of the SZ signal inspires a toy model of a hot bridge connecting the MW and M31. As suggested by simulations, a hot bridge occurs between the MW and M31 after , although these two galaxies have not yet entered each others virial radius (Nuza et al., 2014). Here, we use the simplest assumption to model the observation – a single temperature, uniformly distributed medium filling in a cylinder between the MW and M31 (Fig. 3). The direction of this cylinder is toward M31, and the barycenter is the middle point along the sight line ( kpc). The length and radius of the cylinder are and , respectively.
| Fiducial SZ | Minimal SZ | |
|---|---|---|
| (L.U.) | ||
| (L.U.) | ||
| SZ | ||
| (kpc) | ||
| (kpc) | ||
| () | ||
| () | ||
| () | ||
Note: all parameters in this table is based on the single phase assumption, the correction due to the multi-phase medium is in Section 3.4.2.
a adopting the APEC model to convert the line emissivity to the bolometric luminosity.
It is well known that the CGM is typically multi-phase (Tumlinson et al. 2017 and references therein). However, a multi-phase medium model cannot be constrained without direct observations of cool or warm gas associated with the bridge. In section 3.4, we discuss the limitation (bias) introduced by the single-phase assumption, together with the observational limitations.
The strength of O VII and O VIII emission measurements or the SZ signal is proportional to the path length in the cylinder. There are two characteristic angles for this bridge model: the opening angle at the M31 side, , and the opening angle at the MW side, . Based on these two angles, the path length in the cylinder could be divided into three regimes:
| (3) | |||||
where is .
Within the cylinder, the gas is assumed to be well mixed, with the same density, temperature, and metallicity. For the O VII and O VIII emission, we use the AtomDB data set to extract the emissivity at different temperatures (Foster et al., 2012). A factor of 0.58 is used to correct the solar oxygen abundance difference, in AtomDB (Anders & Grevesse, 1989), and we use from Asplund et al. (2009).
The M31 hot halo may also contribute to the observed X-ray and SZ signals. Here, we assume that M31 hosts a MW-like hot halo (the LB17 model) at 750 kpc. The contributions due to such a hot halo are important within about around M31 (Fig. 1 and Fig. 2). In practice, we subtract the contribution due to this MW-like hot halo from observed signals, before the modeling of the cylindrical hot bridge.
For the fitting, we expect that points within significantly contribute to the model constraints. The MB15 sample has 9 sight lines, the SZ radial profile has 5 bins, while the HS12 sample has additional 24 sight lines. As stated in Section 2, the additional sight lines in HS12 may suffer from more contamination than MB15, so we lower their weights by a factor of 10 in the fitting. Then, the HS12 sample has about equivalent sight lines, which has slightly lower contributions to the model fitting than the MB15 sample and the SZ signal. We also have an additional uncertainty for O VII of 1.5 L.U., because the O VII is more clumpy, showing small scale variations (MB15, LB17). The total likelihood is
| (4) |
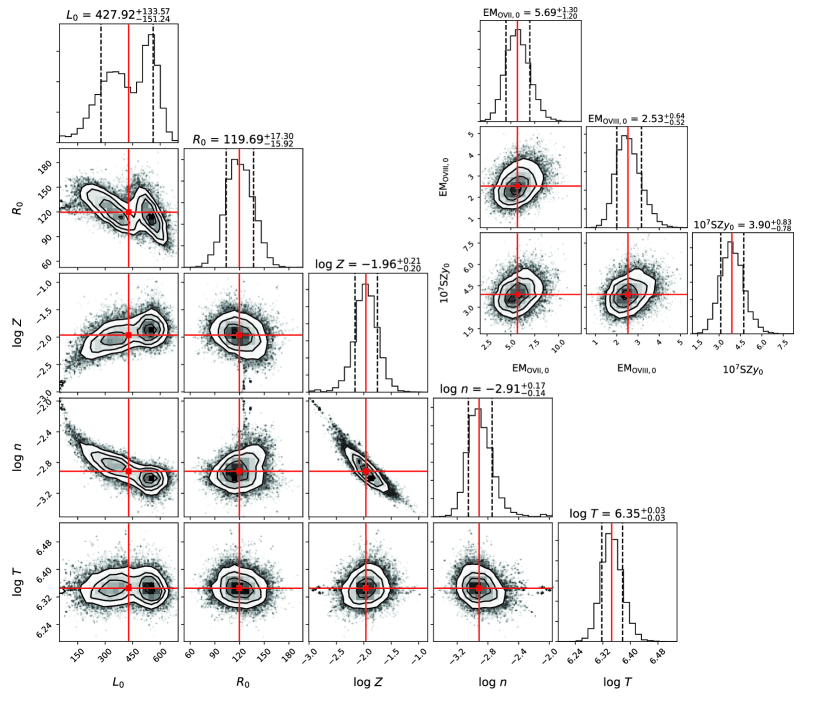
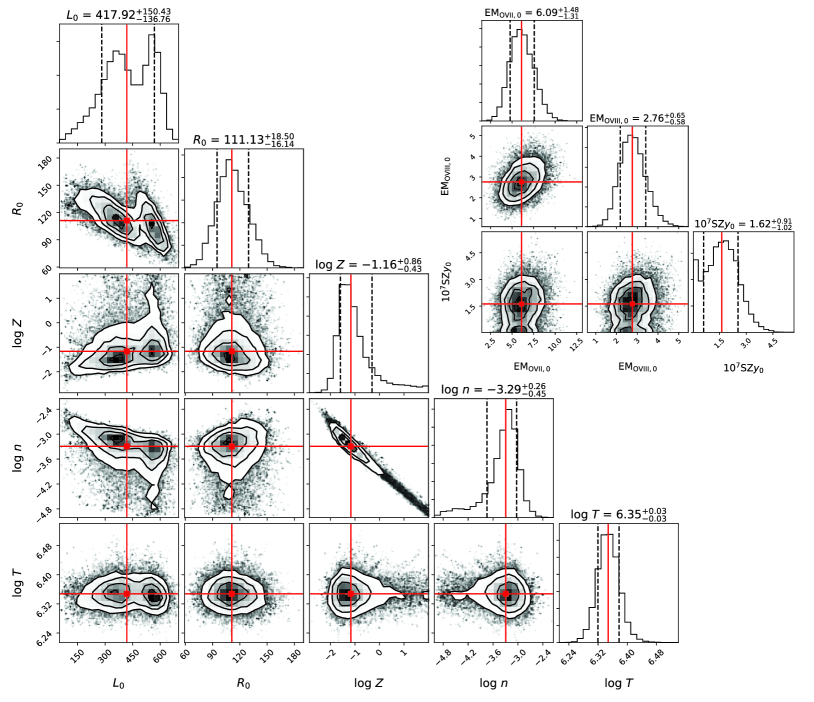
The MCMC model is calculated with emcee (Foreman-Mackey et al., 2013), and the results are shown in Fig. 4 and Fig. 5 for fiducial SZ and minimal SZ extractions, respectively. The physical parameters are summarized in Table 1.
The cylinder model suggests the length of this structure is about kpc, which is sufficient to connect the dark matter halo of the MW and M31 (250 kpc for each galaxy). Therefore, it is consistent with the assumption that the observed hot diffuse feature is a Local Hot Bridge connecting the MW and M31.
For the fiducial SZ model, the estimated mass is , while the minimal SZ model has a mass of . With a halo mass of , the associated baryon mass is about (Li & White, 2008; Planck Collaboration et al., 2018). Then, the Local Bridge structure contributes about of the baryon mass ( in the minimal model). As a comparison, we estimate the baryon masses in the MW and M31. The MW has a stellar mass of (Licquia & Newman, 2015), a hot gas CGM of (Gupta et al. 2012; \al@Miller:2015aa, Li:2017aa; \al@Miller:2015aa, Li:2017aa; Faerman et al. 2017, 2020), and a warm gas CGM of (Zheng et al., 2019; Qu & Bregman, 2019). M31 has a stellar mass about twice the MW of (Tamm et al., 2012), but a similar halo mass of (Kafle et al., 2018). The hot component of the M31 CGM is still unknown, but should be comparable to the MW because of the similar halo mass. The cool-warm CGM in the M31 halo has mass of (Lehner et al., 2020). Therefore, the baryons within the MW and M31 halos account for ().
We estimate the total oxygen masses are and for fiducial and minimal SZ models, respectively. According to Peeples et al. (2014), the total oxygen generated in a MW-like galaxy is , and about of oxygen () is missing within the virial radius. Then, the total missing oxygen is about , saying M31 is also a MW-like galaxy. The metals in the Local Bridge also considerably account for the LG missed metals (). We note that with a lower SZ strength, the oxygen mass will be higher.
The total O VII and O VIII luminosity is about . Adopting the APEC conversion factors (Smith et al., 2001), the bolometric X-ray luminosity is erg s-1 (fiducial SZ extraction) and erg s-1 (minimal SZ extraction), which are comparable to poor galaxy groups (Osmond & Ponman, 2004; O’Sullivan et al., 2014). A typical galaxy absorption toward M31 of leads to an observed luminosity of the keV band for the fiducial SZ extraction and for the minimal SZ extraction.
3.4. Caveats and Preferred Parameters
As shown by current observations, there is an enhancement around the M31 direction, but the measurement and physical interpretation involve several uncertainties mainly due to observational limitations. Here, we summarize these observation limitations and uncertainties, and raise the caveats. With these limitations, we also discuss the preferred physical properties.
3.4.1 X-ray and SZ Measurement Uncertainties
In Section 2.1, we suggested that the enhancement around the M31 direction is unlikely due to a random variation at , or a Galactic disk variation at . However, it is still possible that the MW has contributions to the M31 enhancement. To have a large-scale () enhancement, the feature is likely to be close to the Sun, so the LB is a possible source for the MW variation. The LB model used in Section 2.1 is from MB15 (the same as LB17), which uses the path length derived based on Na I absorption survey of nearby stars (Lallement et al., 2003). In the MB15 model, the LB has a mean contribution to the observed O VII measurements of 0.83 L.U. with a uncertainty of 0.17 L.U., while the contribution to O VIII is negligible. Toward M31 within , the LB model suggest a relatively low OVII contribution of 0.72 L.U.. Considering the variation of the LB contributions, the O VII measurement may be reduced by L.U., which is of the O VII enhancement (5.7 L.U.).
The scatter of features is 1.5 L.U. for O VII and 0.5 L.U. for O VIII (Fig. 1). It is possible to affect the enhancement at a similar level, which is uncertain due to the limitation of current data (i.e., more sight lines could reduce the statistical uncertainty). We are conducting a M31 hot halo study (Huang et al. in prep.), which will increase sight lines around M31 within (more than 30 sight lines), and improve the current situation.
The uncertainty of the SZ observation is mainly the possible overestimation of the fiducial extraction and the underestimation of the minimal extraction as stated in Section 2.2. An SZ signal of in the fiducial extraction is about an upper limit of the SZ signal, while the lower limit is extracted in the minimal model. Although it is possible that the real SZ signal is undetectable () because of the detection in the minimal extraction, the well-behaved radial profiles suggest a more physical reason rather than random variation for both extractions.
One common issue is the coverage of the feature for both SZ and X-ray signals. There is only a half of area with signals (), so it is not guaranteed that the upper and the lower halves have similar signals. In an extreme case, the upper half of does not have any enhancement. This possibility reduces the angular coverage of the observed features, but will not affect the derived temperature, density, and path length. However, it will affect the mass estimation as discussed in Section 3.4.3.
3.4.2 Corrections due to the Multi-Phase Medium
Although we assume a single-phase model in the toy model, the bridge structure could be multi-phase. Lehner et al. (2020) show the covering factor of strong absorption of the UV ion O VI () has a peak at (Fig. 11 in their paper), which might indicate a transition from the hot gas to the lower-temperature gas (i.e., multi-phase medium). However, the cool-warm gas contribution associated with the hot bridge is unknown to the observed UV absorption systems. Therefore, the temperature distribution of the multi-phase medium is also unknown. We adopt a steady-state cooling assumption (; roughly a power law with a slope of -1.5; Qu & Bregman 2018) for the warm-hot gas () to investigate the acceptable temperature region. The O VII, O VIII, and SZ measurement is only sensitive to the high-temperature region, so we fix the lower temperature bound to . The maximum temperature cannot be much higher than , otherwise, it predicts less O VII than O VIII, while the observed ratio is about .
The multi-phase assumption could significantly reduce the baryon mass and raise the metallicity. The total mass is proportional to / (i.e., electron column density and physical area), so a higher mean temperature gives a lower baryon mass. At , O VII and O VIII are at about their emissivity peaks. If more mass is in the hot phase not contributing to O VII and O VIII emission measurements, a higher metallicity is needed to match the observations. With a high-temperature end of , the total baryon mass will be reduced by , and the metallicity will be raised by for both fiducial and minimal SZ models.
In the single-phase models, the derived hot gas masses are about and for the fiducial and minimal SZ extraction, respectively (Table 1). Considering the multi-phase correction, the masses are reduced to and . Also, the metallicity will be raised to (fiducial) and (minimal). Although this bias (always higher mass and lower metallicity in the single-phase modeling) is within the uncertainty (), this trade between single-phase and the multi-phase assumptions could play an important role, when accounting for baryons or metals in the hot phase ().
3.4.3 Mass and Density and Metallicity
The modeling based on current data suggests a mass of for the hot bridge. However, as discussed in Section 3.4.1, the current data has some uncertainties, so here we provide a set of estimations for the lower limit of the hot gas mass. First, we ignore the SZ signal, which has a higher systematical uncertainty due to the extraction method. As shown in Fig. 4 and Fig. 5, the density (proportional to the mass and SZ signal) and the metallicity are negatively correlated. Theoretically, there is a solid upper limit of the metallicity of the hot bridge at the Solar metallicity. Thus, assuming the Solar metallicity, a solid lower limit of the mass is (considering O VII and O VIII measurement uncertainties), while the preferred mass lower limit is (with the preferred line measurements) in the multi-phase model.
We also consider the uncertainty of the O VII and O VIII measurements by reducing the strength by a factor of 2 (i.e., of the random variation for both ions). Then, the mass lower limit is reduced to . Because the current coverage of X-ray and SZ measurements is only the lower half (), the lower limit can be reduced by another factor of 2 (i.e., only the lower half has the bridge structure). Finally, the lower limit of the bridge mass is about , so it is still a massive baryonic component in the LG.
The upper limit of the hot gas mass is from the fiducial single-phase model (i.e., ). Then, the possible range of the mass is between and , while it is likely to be higher than ( of the LG baryons). For a mass of , the conclusion still holds that the X-ray and SZ enhancement is unlikely to be the M31 hot halo. If the enhancement is around M31 at 750 kpc, the mass will be increased to (a factor of 4), which still breaks the M31 baryonic constraint: a total baryon mass of (Kafle et al., 2018), in the disk (Tamm et al., 2012), and a massive cool-warm CGM of (Lehner et al., 2020).
The upper limit of the Solar metallicity also reduces the 1 upper limit of the oxygen mass from to . Then, the contribution to the missing metals is reduced from to in the LG.
The density is proportional to the mass with the same geometry (cylindrical bridge), which is not sensitive to the O VII, O VIII, and SZ strengths. Applying a similar estimation as the mass, the range of the density is about to . This density is similar to the measured hot gas density of of the bridge in the galaxy group HCG 16 (a spiral rich galaxy group; O’Sullivan et al. 2014).
With the multi-phase correction, the preferred metallicity is about 0.02 to 0.12 , which is consistent with the X-ray measurements of the HCG 16 intra-group medium (O’Sullivan et al., 2014). Here we suggest that it is also possible to be higher (even higher than the Solar metallicity) in the minimal SZ model considering the uncertainty of the measurement. The relatively low metallicity implies an intra-group medium origin of the local hot bridge, because the CGM of the MW is expected to have a higher metallicity (; Bregman et al. 2018).
4. Conclusion
The diffuse hot gas feature projected around M31 is detected in both X-ray emission lines (O VII and O VIII) and SZ signals with a total significance of ( of O VII, of O VIII, and of SZ). We rule out the possibilities that this feature is the hot halo around M31, otherwise it exceeds the cosmic baryon fraction. This hot gas feature cannot be in the MW halo, due to its excessively high thermal pressure ( times the ambient hot halo), or in the MW disk (too X-ray bright). A preferred explanation is that this hot gas feature is a structure between the MW and M31. A cylinder model suggests that the length of this structure is about 400 kpc with a radius of 120 kpc. Therefore, it is a Local Hot Bridge connecting the hot halos of the MW and M31. This bridge structure has a temperature of K, a density of , and a metallicity . Such a hot bridge contributes about () of the total baryons in the LG, and of the LG missing metals (i.e., oxygen, ).
References
- Anders & Grevesse (1989) Anders, E., & Grevesse, N. 1989, Geochim. Cosmochim. Acta, 53, 197
- Anderson & Bregman (2010) Anderson, M. E., & Bregman, J. N. 2010, ApJ, 714, 320
- Arnaud et al. (2010) Arnaud, M., Pratt, G. W., Piffaretti, R., et al. 2010, A&A, 517, A92
- Asplund et al. (2009) Asplund, M., Grevesse, N., Sauval, A. J., & Scott, P. 2009, ARA&A, 47, 481
- Bennett et al. (2013) Bennett, C. L., Larson, D., Weiland, J. L., et al. 2013, ApJS, 208, 20
- Bouma et al. (2019) Bouma, S. J. D., Richter, P., & Fechner, C. 2019, A&A, 627, A20
- Bregman (2007) Bregman, J. N. 2007, ARA&A, 45, 221
- Bregman et al. (2018) Bregman, J. N., Anderson, M. E., Miller, M. J., et al. 2018, ApJ, 862, 3
- Bregman & Lloyd-Davies (2007) Bregman, J. N., & Lloyd-Davies, E. J. 2007, ApJ, 669, 990
- Delabrouille et al. (2009) Delabrouille, J., Cardoso, J. F., Le Jeune, M., et al. 2009, A&A, 493, 835
- Einasto & Lynden-Bell (1982) Einasto, J., & Lynden-Bell, D. 1982, MNRAS, 199, 67
- Eriksen et al. (2004) Eriksen, H. K., Banday, A. J., Górski, K. M., & Lilje, P. B. 2004, ApJ, 612, 633
- Faerman et al. (2017) Faerman, Y., Sternberg, A., & McKee, C. F. 2017, ApJ, 835, 52
- Faerman et al. (2020) —. 2020, ApJ, 893, 82
- Foreman-Mackey et al. (2013) Foreman-Mackey, D., Hogg, D. W., Lang, D., & Goodman, J. 2013, PASP, 125, 306
- Foster et al. (2012) Foster, A. R., Ji, L., Smith, R. K., & Brickhouse, N. S. 2012, ApJ, 756, 128
- Gupta et al. (2012) Gupta, A., Mathur, S., Krongold, Y., Nicastro, F., & Galeazzi, M. 2012, ApJ, 756, L8
- Henley & Shelton (2012) Henley, D. B., & Shelton, R. L. 2012, ApJS, 202, 14
- Henley & Shelton (2013) —. 2013, ApJ, 773, 92
- Kaaret et al. (2020) Kaaret, P., Koutroumpa, D., Kuntz, K. D., et al. 2020, Nature Astronomy, doi:10.1038/s41550-020-01215-w
- Kafle et al. (2018) Kafle, P. R., Sharma, S., Lewis, G. F., Robotham, A. S. G., & Driver, S. P. 2018, MNRAS, 475, 4043
- Lallement et al. (2003) Lallement, R., Welsh, B. Y., Vergely, J. L., Crifo, F., & Sfeir, D. 2003, A&A, 411, 447
- Lehner et al. (2020) Lehner, N., Berek, S. C., Howk, J. C., et al. 2020, ApJ, 900, 9
- Li & Bregman (2017) Li, Y., & Bregman, J. 2017, ApJ, 849, 105
- Li & White (2008) Li, Y.-S., & White, S. D. M. 2008, MNRAS, 384, 1459
- Licquia & Newman (2015) Licquia, T. C., & Newman, J. A. 2015, ApJ, 806, 96
- Lim et al. (2017) Lim, S. H., Mo, H. J., Lu, Y., Wang, H., & Yang, X. 2017, MNRAS, 470, 2982
- Miller & Bregman (2015) Miller, M., & Bregman, J. 2015, ApJ, 800, 14
- Mulchaey (2000) Mulchaey, J. S. 2000, ARA&A, 38, 289
- Nakashima et al. (2018) Nakashima, S., Inoue, Y., Yamasaki, N., et al. 2018, ApJ, 862, 34
- Nuza et al. (2014) Nuza, S. E., Parisi, F., Scannapieco, C., et al. 2014, MNRAS, 441, 2593
- Osmond & Ponman (2004) Osmond, J. P. F., & Ponman, T. J. 2004, MNRAS, 350, 1511
- O’Sullivan et al. (2014) O’Sullivan, E., Vrtilek, J. M., David, L. P., et al. 2014, ApJ, 793, 74
- Peeples et al. (2014) Peeples, M. S., Werk, J. K., Tumlinson, J., et al. 2014, ApJ, 786, 54
- Piffaretti et al. (2011) Piffaretti, R., Arnaud, M., Pratt, G. W., Pointecouteau, E., & Melin, J. B. 2011, A&A, 534, A109
- Planck Collaboration et al. (2016a) Planck Collaboration, Ade, P. A. R., Aghanim, N., et al. 2016a, A&A, 594, A13
- Planck Collaboration et al. (2016b) —. 2016b, A&A, 594, A26
- Planck Collaboration et al. (2018) Planck Collaboration, Akrami, Y., Arroja, F., et al. 2018, arXiv e-prints, arXiv:1807.06205
- Pratt & Bregman (2020) Pratt, C. T., & Bregman, J. N. 2020, ApJ, 890, 156
- Qu & Bregman (2018) Qu, Z., & Bregman, J. N. 2018, ApJ, 856, 5
- Qu & Bregman (2019) —. 2019, ApJ, 880, 89
- Qu et al. (2020) Qu, Z., Bregman, J. N., Hodges-Kluck, E., Li, J.-T., & Lindley, R. 2020, ApJ, 894, 142
- Riess et al. (2012) Riess, A. G., Fliri, J., & Valls-Gabaud, D. 2012, ApJ, 745, 156
- Smith et al. (2001) Smith, R. K., Brickhouse, N. S., Liedahl, D. A., & Raymond, J. C. 2001, ApJ, 556, L91
- Snowden et al. (1997) Snowden, S. L., Egger, R., Freyberg, M. J., et al. 1997, ApJ, 485, 125
- Tamm et al. (2012) Tamm, A., Tempel, E., Tenjes, P., Tihhonova, O., & Tuvikene, T. 2012, A&A, 546, A4
- Tumlinson et al. (2017) Tumlinson, J., Peeples, M. S., & Werk, J. K. 2017, ARA&A, 55, 389
- Voges et al. (1999) Voges, W., Aschenbach, B., Boller, T., et al. 1999, A&A, 349, 389
- Xue et al. (2008) Xue, X. X., Rix, H. W., Zhao, G., et al. 2008, ApJ, 684, 1143
- Zheng et al. (2019) Zheng, Y., Peek, J. E. G., Putman, M. E., & Werk, J. K. 2019, ApJ, 871, 35