The true number density of massive galaxies in the early Universe revealed by JWST/MIRI
Abstract
One of the main challenges in galaxy formation that has emerged recently is the early assembly of massive galaxies. The observed number density and the maximum stellar mass () of massive galaxies in the early Universe appear to be higher than model predictions, which may pose a serious problem to the CDM cosmology. A major limitation in many previous studies is the large uncertainty in estimating due to the lack of constraints in the rest-frame near-infrared part of the spectral energy distribution, which is critical to determining accurately. Here we use data from a large JWST/MIRI survey in the PRIMER program to carry out a systematic analysis of massive galaxies at , leveraging photometric constraints at rest-frame m. We find a significant reduction in the number and mass densities of massive galaxies at compared to earlier results that did not use the MIRI photometry. Within the standard CDM cosmology, our results require a moderate increase in the baryon-to-star conversion efficiency () towards higher redshifts and higher . For the most massive galaxies at , the required is , in comparison to for typical low-redshift galaxies. Our findings are consistent with models assuming suppressed stellar feedback due to the high gas density and the associated short free-fall time expected for massive halos at high redshift.
1.2 {affiliations}
School of Astronomy and Space Science, Nanjing University, Nanjing, Jiangsu 210093, China
Key Laboratory of Modern Astronomy and Astrophysics, Nanjing University, Ministry of Education, Nanjing 210093, China
Chinese Academy of Sciences South America Center for Astronomy, National Astronomical Observatories, CAS, Beijing, 100101, China
Center for Astrophysics and Planetary Science, Racah Institute of Physics, The Hebrew University, Jerusalem, 91904, Israel
School of Astronomy and Space Science, University of Science and Technology of China, Hefei, Anhui 230026, China
Key Laboratory for Research in Galaxies and Cosmology, Department of Astronomy, University of Science and Technology of China, Hefei, Anhui 230026, China
Department of Astronomy, University of Massachusetts, Amherst, MA 01003-9305, USA
Santa Cruz Institute for Particle Physics, University of California, Santa Cruz, CA 95064, USA
Purple Mountain Observatory, Chinese Academy of Sciences, 10 Yuanhua Road, Qixia District, Nanjing 210023, China
Department of Astronomy, Tsinghua University, Beijing 100084, China
Université Paris-Saclay, Université Paris Cité, CEA, CNRS, AIM, 91191 Gif-sur-Yvette, France
Introduction
In the CDM cosmological model, the most massive galaxies tend to populate the most massive dark matter halos. As a result, the number density of massive galaxies provides crucial constraints not only on models of galaxy formation, but also on cosmology. During the last decade, our knowledge on massive galaxies ( M⊙) in the early Universe has been significantly improved. In particular, a significant population of massive and ultraviolet (UV)-faint galaxies at have recently been confirmed by Spitzer/IRAC and ALMA [1, 2, 3, 4], which were absent from previous studies focusing on UV-bright galaxies selected with the Lyman-break technique. The JWST observations have now further consolidated the existence of these massive galaxies and extended it to higher redshifts and lower masses [5, 6]. However, the new JWST observations have raised new challenges regarding both the high number density of massive galaxies and their highest stellar masses at [7, 8]. Similar phenomenon also exists at for luminous UV-selected galaxies [9, 10, 11, 12, 13, 14]. If confirmed, it would require either significantly elevated baryon conversion efficiency that is unexpected by current galaxy formation models, or a larger number of massive dark matter (DM) halos exceeding predictions of the CDM Cosmology. Therefore, revealing the true number density of massive galaxies with reliable estimation represent one of the most urgent tasks for extragalactic astronomy.
Many previous studies of massive galaxies in the early Universe suffer from two major limitations: small number statistics and large uncertainties in the estimation due to the lack of rest-frame near-infrared photometry. In particular, recent studies show that, without the aid of JWST Mid-Infrared Instrument (MIRI) photometry that probes rest-frame m, the stellar masses of galaxies could be overestimated by dex at [15, 16]. These results suggest that a census of high-redshift massive galaxies using mid-infrared photometry in a large volume would be key to confirming/falsifying whether or not there is indeed a serious tension between observations and current galaxy formation models in the CDM Cosmology.
In this study, we use one of the largest and deepest JWST/NIRCam and MIRI surveys from public Treasury Programs, the Public Release IMaging for Extragalactic Research (PRIMER, GO 1837, PI: James Dunlop) program. The PRIMER survey targets the CANDELS-COSMOS and CANDELS-UDS fields with deep imaging in 10 bands: F090W, F115W, F150W, F200W, F277W, F356W, F444W and F410M with NIRCam, and F770W and F1800W with MIRI. Its large survey volume, 5 times larger than that adopted in Ref [5], and deep MIRI/F770W and F1800W coverage allow a concrete census of massive galaxies in the early Universe. So far, 90 per cent of the PRIMER observations has been completed with a total area of arcmin2. All the JWST/NIRCam and previous HST images are publicly available from the Grizli Image Release v7.0 111https://dawn-cph.github.io/dja/imaging/v7, which were reduced and processed by the Grizli pipeline [17, 18]. Since there are issues in the default JWST Calibration Pipeline for MIRI images [19], we have reduced the MIRI/F770W and F1800W data using our custom-made pipeline (Methods, Extended Data Figure 1).
Based on the combined HST, JWST/NIRcam, and JWST/MIRI images, we construct a multiwavelength photometric catalog (Methods). The photometric catalog includes 46,480 F444W-detected sources with S/N, among which 25,680 sources are detected at MIRI/F777W with S/N 2 and the remaining ones have upper limits. We derive their photometric redshifts (photo-) and based on SED-fitting, both with and without the two MIRI bands (Methods). Our primary sample include 2160 galaxies at with , where the sample are complete (Methods, Extended Data Figure 2). This sample includes galaxies detected at F770W with S/N 2 including all the 484 massive galaxies with .
The importance of MIRI in constraining stellar masses at
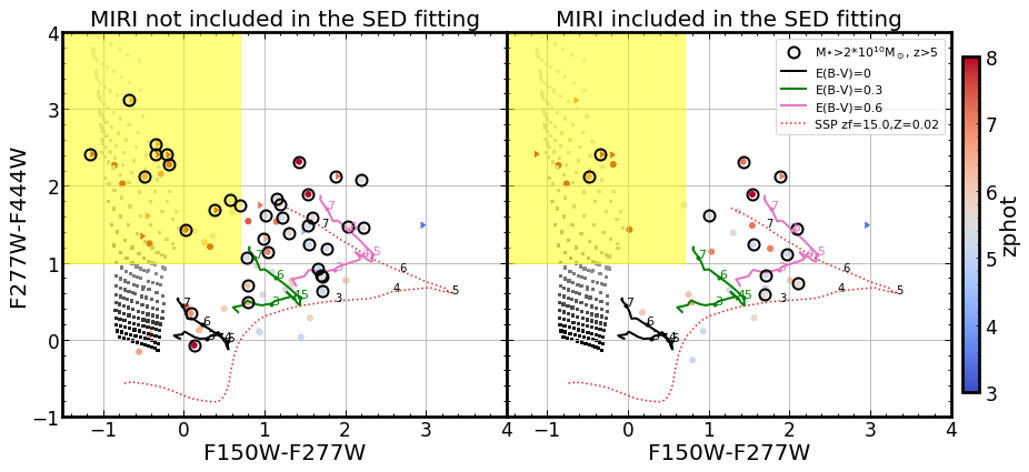
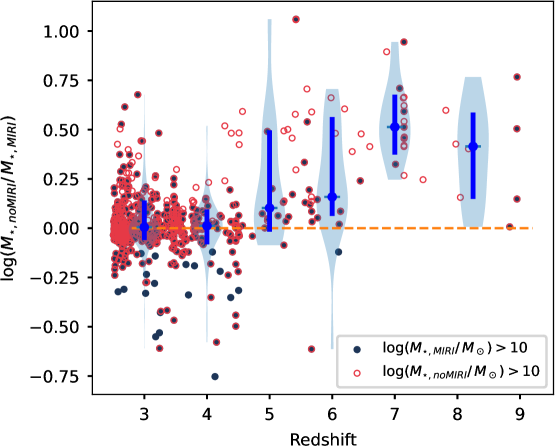
Figure 1 shows the distribution of massive galaxies in our sample with at in the F277W F444W versus F150W F277W diagram. For comparison, results are shown separately for two samples of the galaxies that are defined as massive according to the SED fitting w/o the inclusion of the MIRI photometry. It is immediately clear that the number of the most massive galaxies at is significantly reduced when MIRI is included in the SED fitting. In particular, when MIRI is included, only galaxies with both red F277W F444W and F150W F277W are selected as the most massive galaxies with , consistent with their being massive and dusty, as indicated by the color tracks of SED templates. In contrast, when MIRI is not included, a significant number of objects with red F277W F444W and blue F150W F277W are identified as massive galaxies at , although most of them are disqualified once MIRI is included. A one-to-one comparison reveals that, while the best-fitting photos are robust against the inclusion of the MIRI photometry (Extended Data Figure 3, also see Ref [15, 20]), is significantly reduced when MIRI is included in the SED-fitting (Figure 2).
Figure 2 shows a systematic comparison on the derived for galaxies in our sample w/o including MIRI fixed at the same redshifts. When MIRI is not included, is systematically overestimated at , where the longest NIRCam filter F444W only probes rest-frame m. After examining the SED-fitting results, we find that overall there are two major reasons leading to the overestimation of when MIRI is not included (Extended Data Figure 4). One is the age-attenuation degeneracy: when MIRI is not included, the best-fitting SEDs tend to have younger ages and larger dust attenuation, leading to an overestimation of . The other is the contamination by emission lines: when strong emission lines fall in the long wavelength (typically F444W or F356W), the best-fitting SEDs obtained without MIRI tend to overestimate the stellar continuum, hence . In many cases, the overestimation of involves both factors (also see Ref [15]).
The number density of massive galaxies and the implied cosmic evolution of baryon conversion efficiency at
Based on the photos and derived with MIRI photometry, we calculate the cumulative stellar mass density for massive galaxies with at (Figure 3). Figure 3 also shows the expected cumulative stellar mass densities at each redshift assuming a constant integrated efficiency of converting baryons to stars (), , where is the cosmic baryon fraction, and and are the cumulative stellar density and total mass density in dark matter halos, respectively. The cumulative mass density in DM halos more massive than is derived from the DM halo mass function in Ref [21]. We also tried the same calculation using the DM halo mass functions derived from the Bolshoi-Planck and MultiDark-Planck CDM cosmological simulations [22], as used in Ref [20], and found similar results.
Two prominent features emerge from the comparison of the cumulative stellar mass function between observations and model predictions. Firstly, the relatively low abundance of massive galaxies at obtained by including the MIRI photometry is fully consistent with CDM predictions without requiring extreme baryon conversion efficiencies. Secondly, the baryon-to-star conversion efficiency increases towards higher stellar masses and higher redshifts. However, even for the most massive galaxies at , only a moderately enhanced efficiency of is required, in comparison to for typical low-redshift galaxies.
Discussion
The discoveries of this paper have important implications for the studies of high-redshift galaxies. Here we briefly discuss a few aspects regarding the sample selection, stellar mass estimation, and baryon-to-star conversion efficiency for massive galaxies in the redshift range .
The photometric selection of high-redshift massive (old or dusty) galaxies generally relies on their Balmer/4000 Å break or submillimeter emissions. Based on the presence of the Balmer break and blue UV continuum of massive (star-forming) galaxies, Labbe et al.[5] proposed a method to select massive galaxies at using red F277W-F444W and blue F150W-F277W. However, Figure 1 shows that the most massive galaxies at these high redshifts, as confirmed by MIRI, are much less bluer in their UV slope than the criterion proposed in Labbe et al., and consistent with the color tracks expected from SED templates of dusty star-forming galaxies.
Our results demonstrate clearly the importance of MIRI in obtaining accurate stellar masses for massive galaxies at . This calls for great caution against the massive end of the SMF derived from the photometry with coverage only up to IRAC 4.5m or to NIRCam/F444W. The effect of including MIRI on the estimation of lower-mass galaxies is less significant, presumably because their intrinsically younger age and bluer SED lead to weaker age-attenuation degeneracy. However, in the presence of strong emission lines in the longest photometric bands (typically F356W or F444W), for lower-mass galaxies can still be significantly overestimated, which is true even when emission line models are included in the SED library.
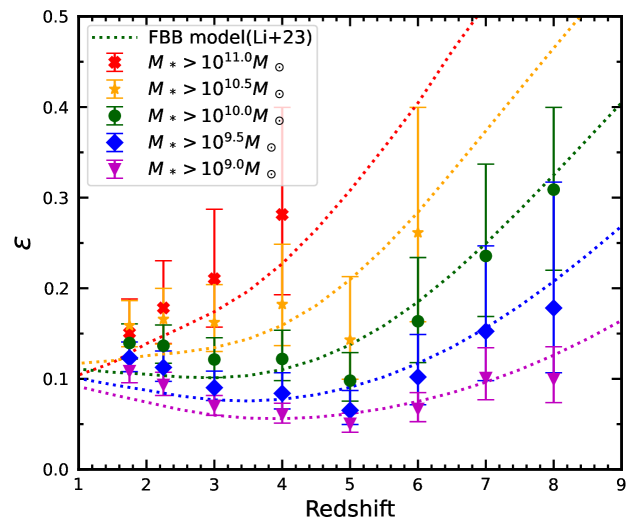
In addition to an overall reduction in the number density of massive galaxies in comparison to previous estimations based on the rest-frame photometry at m, we also see that galaxies of higher stellar mass at higher tend to have a higher baryon-to-star conversion efficiency (Figure 3). Based on comparisons between the observed cumulative SMFs and those expected from models at different (see Figure 3), we also derive the corresponding/best-fitting for galaxies at each redshift and mass limit, as shown in Figure 4. At all stellar masses, remains quite flat at low redshifts and makes a transition to a phase of rapid increase with redshift. This transition takes place at lower redshifts for more massive galaxies, with for and for . Despite of the large uncertainty in the estimation of based on photometry up to NIRCam/F444W, several recent studies using primarily NIRCam data [23, 20] have also revealed the trend that increases with increasing redshifts.
Another common caveat of these studies is that the Eddington bias has not been properly taken into account, which may lead to an overestimation of the number density of massive galaxies [24]. An accurate assessment of this effect is challenging due to the uncertainty in modeling the intrinsic errors of and photos of individual galaxies. Nevertheless, we explore the effect of this bias by deriving an intrinsic SMF by fitting the observed data with the usual Schechter function convolved with a Gaussian kernel with , which corresponds to the typical uncertainty in estimation (Extended Data Figure 5). We then derive the cumulative number and mass densities above certain mass limits based on this best-fitting SMF (Extended Data Figure 6). As expected, once this effect is taken into account, the number/mass densities of those most massive galaxies at high redshifts will be further reduced, yielding a more gentle increase of .
Our finding that the baryon-to-star conversion efficiency increases with both and is consistent with the physical model of feedback-free starburst (FFB model[25, 26]) in high-redshift massive galaxies. The FFB model argues that the high gas density and intermediate metallicity expected in star-forming regions within massive galaxies in the early Universe, combined with the associated short free-fall time and cooling time of Myr, dictates the suppression of stellar feedback and results in a high baryon-to-star conversion efficiency that increases with redshift. Furthermore, FFB is expected to be associated preferentially with halos above a threshold mass that declines with redshift. As shown in Figure 4, the trends of an increasing with redshift and stellar mass are consistent with the FFB model assuming . While the current study is largely limited to , the trend of with redshift shown in Figure 4 indicates an even larger for galaxies at , in general agreement with the high abundance of UV-luminous galaxies reported by recent studies and with the predictions of the FFB model.

0.1 Cosmology.
0.2 JWST MIRI data reduction
The JWST/MIRI F770W and F1800W images are reduced following the JWST Calibration Pipeline v1.10.2 [32]. Since the default output of the default Pipeline still has a few defects (Figure 1, also see, e.g., Ref[19]), we use the following custom steps to improve the quality of data reduction, and the data product is summarized in Extended Data Table 1. The major revisions are the following. Firstly, in stage 2, we replace the default flat-field images with newly-constructed ones for each MIRI pointing by stacking the rate maps from the adjacent 5 pointings that are produced from stage 1. Secondly, after stage 2, in addition to subtract remaining “stripe-like” noise patterns following Ref [19], we use photutils v1.5.0 [33] to subtract the background from each ”cal” image (the output from stage 2 of the pipeline). This is expected to solve the problem of uneven background, and to improve the performance of the default source detection algorithm in stage 3. Thirdly, when using the ‘TweakReg’ routine in stage 3 to perform astrometry calibration, we replace the default Gaia catalog, which has too few sources, with a reference catalog based on the JWST/NIRCam F444W image from Grizli Image Release v7.0. A comparison between the MIRI images reduced by the default official pipeline (the level 3 science product from MAST) and our modified pipeline is shown in Extended Data Figure 1.
We derive the depth of these images for point sources by measuring the fluxes in empty apertures and calculate the standard deviation of them. Then, the error is this standard deviation divided by the fraction of flux from a point source within the aperture. Using the aperture with the highest S/N for each band, we find that the 5 depth for the F770W and F1800W images are 26.4 and 23.3 mag, respectively. With the same method, we determine the 5 depth for the NIRCam/F444W images, which is 28.6 mag.
0.3 Multiwavelength source catalog construction
We employ the HST+JWST/NIRCam source catalogs from the Grizli catalog release v7.0, where the source detection is based on the combined images of the NIRCam long-wavelength (LW) filters (F277W+F356W+F444W). For each source in the catalog that is covered by MIRI/F770W imaging, we perform aperture photometry in the MIRI/F770W and F1800W images at the source positions determined by NIRCam. For HST and JWST/NIRCam photometry, we use the diameter aperture photometry from the catalog released with Grizli Image Release v7.0. The aperture photometry is corrected to the ”total” values within an elliptical Kron aperture [34], which is computed on the LW detection image and applied to all bands. Based on the source detection information in this catalog, we further perform aperture photometry for JWST/MIRI images with APHOT [35]. The diameters used are for F770W and for F1800W. We then convert these aperture magnitudes to total fluxes by applying the correction measured at the NIRCam LW detection image with the same aperture.
0.4 Photometric redshift and stellar mass estimation
We run several suites of photometric redshift SED fitting, depending on whether or not MIRI photometry is included, and on which redshifts are used.
Photometric redshifts are derived by EAZY [36] including or not including the MIRI photometry. We apply the sfhz_blue_13 template and a 5% systematic uncertainty floor to the photometric fluxes. Stellar masses are derived from three suites of SED fitting with BAGPIPES [37]: (1) including the MIRI photometry, and using the maximum-likelihood redshift obtained from EAZY that includes MIRI photometry; (2) excluding the MIRI photometry, and using the maximum-likelihood redshift obtained from EAZY that includes MIRI photometry; (3) excluding the MIRI photometry, and using the maximum-likelihood redshift obtained from EAZY that excludes MIRI photometry. We use the stellar population synthesis model in the 2016 version of [38] (age and metallicity ), a delayed exponentially declining star formation history (timescale ), dust models in Ref[39] for young and old stellar population separately (divided by 0.01 Gyr; ), and nebular emission constructed following Ref [40] with ionization parameter to run BAGPIPES.
We also run fast++222https://github.com/cschreib/fastpp to derive for massive galaxies adopting the stellar population synthesis model in Ref [38] with stellar ages, metallicity ), a delayed star formation history (timescale ), and dust extinction models in Ref[39]. The stellar masses obtained from the two methods are consistent within 0.3 dex.
The depth of F444W ensure that we are complete for galaxies with up to , among which all the massive galaxies with are detected at MIRI/F770W with S/N 4 (Extended Data Figure 2).
Stellar mass functions
Extended Data Figure 5 presents the stellar mass functions (SMFs) obtained from the PRIMER survey. In order to take into account the impact of Eddington bias and recover the intrinsic SMFs, we first convolve the Schechter function with a Gaussian kernel (). We note that we do not use a Lorenztian “wing” [41] in the kernel since the outlier fraction should be significantly suppressed with the JWST data. Then, we perform regression fitting with Scipy v1.8.1 [42], the error includes the cosmic variance given by the “cosmic variance cookbook” [43] and the Poisson noise derived from the intrinsic number counts (estimated from the best-fit Schechter function before convolution). To avoid complicating the SMF measurement, we do not include the previously mentioned systematic biases from SED fitting to the error bars. The priors used are for , and for . The best-fitting parameters are listed in Table 2.
![[Uncaptioned image]](/html/2403.02399/assets/x4.png)
![[Uncaptioned image]](/html/2403.02399/assets/edf2.png)
![[Uncaptioned image]](/html/2403.02399/assets/edf3.png)
![[Uncaptioned image]](/html/2403.02399/assets/x5.png)
![[Uncaptioned image]](/html/2403.02399/assets/x6.png)
![[Uncaptioned image]](/html/2403.02399/assets/x7.png)
![[Uncaptioned image]](/html/2403.02399/assets/x8.png)
| Procedure | Description |
|---|---|
| Stage 1a | Apply detector-level corrections and output corrected countrate images |
| Flat-field construction | Provide a super-sky flat-field for each MIRI pointing |
| Stage 2 | Apply instrumental corrections and calibrations for each exposure |
| Stripe subtractionb | Subtract the remaining stripes following Ref[19] |
| Background subtraction | Subtract the background for each “cal” image |
| TweakReg | Compute WCS corrections for each MIRI pointing |
| SkyMatcha | Calculate sky values in overlapping regions |
| Outlier Detectiona | Reject the pixels affected by cosmic rays or other artifacts |
| Resamplea | Resample and combine the individual images |
Note. — () These procedures are performed with default parameters. () This only has minor effect after replacing the flat-field.
| Redshift | |||
| 3 | [11.0] | ||
| 4 | [11.0] | ||
| 5 | [-2.0] | ||
| 6 | [-2.1] | ||
| 7 | [-1.9] | ||
| 8 | [-2.0] |
References
- [1] Huang, J.-S. et al. Four IRAC Sources with an Extremely Red H - [3.6] Color: Passive or Dusty Galaxies at z > 4.5? ApJL 742, L13 (2011). 1110.4129.
- [2] Wang, T. et al. Infrared Color Selection of Massive Galaxies at z > 3. ApJ 816, 84 (2016). 1512.02656.
- [3] Wang, T. et al. A dominant population of optically invisible massive galaxies in the early Universe. Nature 572, 211–214 (2019). 1908.02372.
- [4] Yamaguchi, Y. et al. ALMA 26 arcmin2 Survey of GOODS-S at 1 mm (ASAGAO): Near-infrared-dark Faint ALMA Sources. ApJ 878, 73 (2019). 1903.02744.
- [5] Labbé, I. et al. A population of red candidate massive galaxies 600 Myr after the Big Bang. Nature 616, 266–269 (2023). 2207.12446.
- [6] Barro, G. et al. Extremely red galaxies at with MIRI and NIRSpec: dusty galaxies or obscured AGNs? arXiv e-prints arXiv:2305.14418 (2023). 2305.14418.
- [7] Boylan-Kolchin, M. Stress testing CDM with high-redshift galaxy candidates. Nature Astronomy 7, 731–735 (2023). 2208.01611.
- [8] Xiao, M. et al. Massive Optically Dark Galaxies Unveiled by JWST Challenge Galaxy Formation Models. arXiv e-prints arXiv:2309.02492 (2023). 2309.02492.
- [9] Adams, N. J. et al. EPOCHS Paper II: The Ultraviolet Luminosity Function from using 110 square arcminutes of deep, blank-field data from the PEARLS Survey and Public Science Programmes. arXiv e-prints arXiv:2304.13721 (2023). 2304.13721.
- [10] Bouwens, R. et al. UV luminosity density results at z > 8 from the first JWST/NIRCam fields: limitations of early data sets and the need for spectroscopy. MNRAS 523, 1009–1035 (2023). 2212.06683.
- [11] Yan, H., Ma, Z., Ling, C., Cheng, C. & Huang, J.-S. First Batch of z 11-20 Candidate Objects Revealed by the James Webb Space Telescope Early Release Observations on SMACS 0723-73. ApJL 942, L9 (2023). 2207.11558.
- [12] Donnan, C. T. et al. The evolution of the galaxy UV luminosity function at redshifts z 8 - 15 from deep JWST and ground-based near-infrared imaging. MNRAS 518, 6011–6040 (2023). 2207.12356.
- [13] Harikane, Y. et al. Pure Spectroscopic Constraints on UV Luminosity Functions and Cosmic Star Formation History From 25 Galaxies at Confirmed with JWST/NIRSpec. arXiv e-prints arXiv:2304.06658 (2023). 2304.06658.
- [14] McLeod, D. J. et al. The galaxy UV luminosity function at z 11 from a suite of public JWST ERS, ERO, and Cycle-1 programs. MNRAS 527, 5004–5022 (2024). 2304.14469.
- [15] Papovich, C. et al. CEERS Key Paper. V. Galaxies at 4 < z < 9 Are Bluer than They Appear-Characterizing Galaxy Stellar Populations from Rest-frame 1 m Imaging. ApJL 949, L18 (2023). 2301.00027.
- [16] Song, J., Fang, G., Lin, Z., Gu, Y. & Kong, X. Solution to the Conflict between the Estimations of Resolved and Unresolved Galaxy Stellar Mass from the Perspective of JWST. ApJ 958, 82 (2023). 2310.12228.
- [17] Brammer, G., Strait, V., Matharu, J. & Momcheva, I. grizli (2022).
- [18] Valentino, F. et al. An Atlas of Color-selected Quiescent Galaxies at z 3 in Public JWST Fields. ApJ 947, 20 (2023). 2302.10936.
- [19] Yang, G. et al. CEERS MIRI Imaging: Data Reduction and Quality Assessment. ApJL 956, L12 (2023). 2307.14509.
- [20] Chworowsky, K. et al. Evidence for a Shallow Evolution in the Volume Densities of Massive Galaxies at to from CEERS. arXiv e-prints arXiv:2311.14804 (2023). 2311.14804.
- [21] Watson, W. A. et al. The halo mass function through the cosmic ages. MNRAS 433, 1230–1245 (2013). 1212.0095.
- [22] Rodríguez-Puebla, A., Primack, J. R., Behroozi, P. & Faber, S. M. Is main-sequence galaxy star formation controlled by halo mass accretion? MNRAS 455, 2592–2606 (2016). 1508.04842.
- [23] Wang, Y.-Y., Lei, L., Yuan, G.-W. & Fan, Y.-Z. Modeling the JWST High-redshift Galaxies with a General Formation Scenario and the Consistency with the CDM Model. ApJL 954, L48 (2023). 2307.12487.
- [24] Chen, Y., Mo, H. J. & Wang, K. Massive dark matter haloes at high redshift: implications for observations in the JWST era. MNRAS 526, 2542–2559 (2023). 2304.13890.
- [25] Dekel, A., Sarkar, K. C., Birnboim, Y., Mandelker, N. & Li, Z. Efficient formation of massive galaxies at cosmic dawn by feedback-free starbursts. MNRAS 523, 3201–3218 (2023). 2303.04827.
- [26] Li, Z. et al. Feedback-Free Starbursts at Cosmic Dawn: Observable Predictions for JWST. arXiv e-prints arXiv:2311.14662 (2023). 2311.14662.
- [27] Langeroodi, D. & Hjorth, J. Little Red Dots or Brown Dwarfs? NIRSpec Discovery of Three Distant Brown Dwarfs Masquerading as NIRCam-selected Highly Reddened Active Galactic Nuclei. ApJL 957, L27 (2023). 2308.10900.
- [28] Greene, J. E. et al. UNCOVER spectroscopy confirms a surprising ubiquity of AGN in red galaxies at . arXiv e-prints arXiv:2309.05714 (2023). 2309.05714.
- [29] Marley, M. S. et al. The Sonora Brown Dwarf Atmosphere and Evolution Models. I. Model Description and Application to Cloudless Atmospheres in Rainout Chemical Equilibrium. ApJ 920, 85 (2021). 2107.07434.
- [30] Planck Collaboration et al. Planck 2018 results. VI. Cosmological parameters. A&A 641, A6 (2020). 1807.06209.
- [31] Oke, J. B. & Gunn, J. E. Secondary standard stars for absolute spectrophotometry. ApJ 266, 713–717 (1983).
- [32] Bushouse, H. et al. JWST Calibration Pipeline (2023).
- [33] Bradley, L. et al. astropy/photutils: 1.5.0 (2022).
- [34] Kron, R. G. Photometry of a complete sample of faint galaxies. ApJS 43, 305–325 (1980).
- [35] Merlin, E. et al. A-PHOT: a new, versatile code for precision aperture photometry. A&A 622, A169 (2019). 1812.00727.
- [36] Brammer, G. B., van Dokkum, P. G. & Coppi, P. EAZY: A Fast, Public Photometric Redshift Code. ApJ 686, 1503–1513 (2008). 0807.1533.
- [37] Carnall, A. C., McLure, R. J., Dunlop, J. S. & Davé, R. Inferring the star formation histories of massive quiescent galaxies with BAGPIPES: evidence for multiple quenching mechanisms. MNRAS 480, 4379–4401 (2018). 1712.04452.
- [38] Bruzual, G. & Charlot, S. Stellar population synthesis at the resolution of 2003. MNRAS 344, 1000–1028 (2003). arXiv:astro-ph/0309134.
- [39] Calzetti, D. et al. The Dust Content and Opacity of Actively Star-forming Galaxies. ApJ 533, 682–695 (2000). arXiv:astro-ph/9911459.
- [40] Byler, N., Dalcanton, J. J., Conroy, C. & Johnson, B. D. Nebular Continuum and Line Emission in Stellar Population Synthesis Models. ApJ 840, 44 (2017). 1611.08305.
- [41] Weaver, J. R. et al. COSMOS2020: The galaxy stellar mass function. The assembly and star formation cessation of galaxies at 0.2 z 7.5. A&A 677, A184 (2023). 2212.02512.
- [42] Gommers, R. et al. scipy/scipy: SciPy 1.8.1. Zenodo (2022).
- [43] Moster, B. P., Somerville, R. S., Newman, J. A. & Rix, H.-W. A Cosmic Variance Cookbook. ApJ 731, 113 (2011). 1001.1737.
T.W. acknowledges support by National Natural Science Foundation of China (Project No. 12173017, and Key Project No. 12141301), National Key R&D Program of China (2023YFA1605600), and the China Manned Space Project (No. CMS-CSST-2021-A07). We are grateful for Dr. Zhoujian Zhang for his help with the synthetic JWST photometry of brown dwarfs. We are grateful for Dr. Gabriel Brammer for sharing the JWST/NIRCam and HST data. The JWST/NIRCam and HST data products presented herein were retrieved from the Dawn JWST Archive (DJA). DJA is an initiative of the Cosmic Dawn Center (DAWN), which is funded by the Danish National Research Foundation under grant DNRF140.
T.W. initiated the study, led the data analysis and authored the majority of the text. H. S. reduced the MIRI images, perform the MIRI photometry, derive the stellar mass functions, and led the comparison between models and data under instructions of T.W. K. X. perform the photometric redshift estimation and SED fitting. L. Z. helped explore the color distribution of high-z sources and SED fitting. C. C. helped the MIRI data reduction. Z. L. helped the comparison between the FFB model and data. All authors contributed to the overall interpretation of the results and various aspects of the analysis.
The authors declare no competing interests.
All HST and JWST/NIRCam images and source catalogs are available at https://dawn-cph.github.io/dja/imaging/v7. The JWST/MIRI raw images are available through the Mikulski Archive for Space Telescopes (MAST). Our own reduced MIRI/images will be made public once the paper is accepted.
All codes used in the paper are publicly available.