Massive Optically Dark Galaxies Unveiled by JWST Challenge Galaxy Formation Models
Abstract
Over the past decade, the existence of a substantial population of optically invisible, massive galaxies at has been implied from mid-infrared to millimeter observations[Walter2012, Wang2019, Xiao2023]. With the unprecedented sensitivity of the JWST, such extremely massive galaxy candidates have immediately been identified even at , in much larger numbers than expected[Labbé2023, Barrufet2023, Adams2023, Pérez-González2023]. These discoveries raised a hot debate. If confirmed, early, high-mass galaxies challenge the current models of galaxy formation[Boylan-Kolchin2023, Lovell2023]. However, the lack of spectroscopic confirmations leads to uncertain stellar mass () estimates, and the possible presence of active galactic nuclei (AGN) adds further uncertainty[Kocevski2023, Matthee2023, Labbe2023b]. Here, we present the first sample of 36 dust-obscured galaxies with robust spectroscopic redshifts at from the JWST FRESCO survey. The three most extreme sources at (1 billion years after the Big Bang) are so massive (log ) that they would require, on average, about 50% of the baryons in their halos to be converted into stars – two to three times higher than even the most efficient galaxies at later times. The extended emission of these galaxies suggests limited contribution by AGN. This population of ultra-massive galaxies accounts for 20% of the total cosmic star formation rate density[Madau2014] at , suggesting a substantial proportion of extremely efficient star formation in the early Universe.
Department of Astronomy, University of Geneva, Chemin Pegasi 51, 1290 Versoix, Switzerland
Cosmic Dawn Center (DAWN), Niels Bohr Institute, University of Copenhagen, Jagtvej 128, København N, DK-2200, Denmark
Université Paris-Saclay, Université Paris Cité, CEA, CNRS, AIM, 91191 Gif-sur-Yvette, France
Aix Marseille Université, CNRS, LAM, Laboratoire d’Astrophysique de Marseille, Marseille, France
Department for Astrophysical and Planetary Science, University of Colorado, Boulder, CO 80309, USA
MIT Kavli Institute for Astrophysics and Space Research, 77 Massachusetts Ave., Cambridge, MA 02139, USA
Leiden Observatory, Leiden University, NL-2300 RA Leiden, Netherlands
Department of Physics, ETH Zürich, Wolfgang-Pauli-Strasse 27, Zürich, 8093, Switzerland
Department of Physics, University of Bath, Claverton Down, Bath, BA2 7AY, UK
Department of Astronomy, The University of Texas at Austin, 2515 Speedway, Stop C1400, Austin, TX 78712-1205, USA
NSF’s National Optical-Infrared Astronomy Research Laboratory, 950 N. Cherry Ave., Tucson, AZ 85719, USA
Astronomy Department, Yale University, 52 Hillhouse Ave, New Haven, CT 06511, USA
Waseda Research Institute for Science and Engineering, Faculty of Science and Engineering, Waseda University, 3-4-1 Okubo, Shinjuku, Tokyo 169-8555, Japan
National Astronomical Observatory of Japan, 2-21-1, Osawa, Mitaka, Tokyo, Japan
Department of Astronomy and Astrophysics, University of California, Santa Cruz, CA 95064, USA
Centre for Astrophysics and Supercomputing, Swinburne University of Technology, Melbourne, VIC 3122, Australia
Department of Physics and Astronomy, Tufts University, 574 Boston Avenue, Medford, MA 02155, USA
Department of Astronomy, University of Wisconsin-Madison, 475 N. Charter St., Madison, WI 53706 USA
School of Physics, University of Melbourne, Parkville, VIC 3010, Australia
ARC Centre of Excellence for All Sky Astrophysics in 3 Dimensions (ASTRO 3D), Australia
Department of Physics and Astronomy, University of California, Riverside, 900 University Avenue, Riverside, CA 92521, USA
Department of Physics & Astronomy, University of California, Los Angeles, 430 Portola Plaza, Los Angeles, CA 90095, USA
Steward Observatory, University of Arizona, Tucson, AZ 85721, USA
Departament d’Astronomia i Astrofìsica, Universitat de València, C. Dr. Moliner 50, E-46100 Burjassot, València, Spain
Unidad Asociada CSIC “Grupo de Astrofísica Extragaláctica y Cosmología” (Instituto de Física de Cantabria - Universitat de València)
Department of Astronomy, University of Massachusetts, Amherst, MA 01003, USA
✉e-mail: mengyuan.xiao@unige.ch
Recent studies have revealed a significant population of galaxies at that are completely missed or only tentatively detected in the deepest optical observations, but brighter at longer wavelengths, such as Spitzer and ALMA[Walter2012, Franco2018, Wang2019, Alcalde2019, Fudamoto2021, Xiao2023] and more recently JWST[Barrufet2023, Gómez-Guijarro2023, Akins2023, Pérez-González2023b, McKinney2023, Barro2023], the so-called optically dark/faint galaxies. These galaxies are considered candidates of massive dusty star-forming galaxies at high redshift[Wang2019], which are essential to constrain the true star formation history, the number density, and formation mechanisms of massive galaxies in the early Universe. However, the major challenge in understanding the nature of these galaxies is the lack of systematic spectroscopic observations.
Here, we exploit the unprecedented imaging and spectroscopic data provided by the JWST FRESCO NIRCam/grism survey[Oesch2023]. Unlike slit spectroscopy, which can only target pre-selected sources, grism spectroscopy can effectively provide a complete sample of emission line galaxies, with the FRESCO survey reaching down to ( depth) over a continuous region of arcmin2 in the GOODS-South and North fields[Giavalisco2004]. This unique advantage of grism spectroscopy can help to explore missed galaxy populations, e.g., optically dark galaxies. With the deep 4-5m grism spectra in the F444W filter, we probe H+[NII] emission lines at and [OIII]+H at . The FRESCO survey also provides high-resolution NIRCam images (F182M, F210M, and F444W; typical 5 depth of 28.2 mag), that complement ancillary data from both HST[Whitaker2019] and now also JWST/JADES[Rieke2023].
Using the multi-wavelength imaging and grism spectroscopy, we select optically dark/faint galaxies that are red (F182M F444W 1.5 mag) and have clearly detected emission lines of at least for robust redshift identification. The color cut together with emission line detections are designed to select star-forming galaxies with significant Balmer breaks, i.e., massive and dusty star-forming galaxies. We identify 36 galaxies at in our parent sample (Extended Data Fig. 1, Methods). Thanks to the JWST spectroscopy, we can now obtain more accurate stellar masses by accounting for the true emission line contributions in photometric bands in the SED fit at a fixed . The are then determined by fitting the UV-to-NIR SED using multiple codes (Bagpipes[Carnall2018], CIGALE[Boquien2019]) and with different star formation histories, which produce consistent stellar mass values within the error range (see Methods for details). The redshift and stellar mass estimates are listed in Extended Data Table. 1. The parent sample of spectroscopically confirmed, optically dark/faint galaxies spans a redshift range of , with stellar masses covering a wide distribution of log(/) . This confirms the high-redshift, dusty, and high-mass nature of this elusive class of galaxies that has so far only been studied from photometry alone[Wang2019, Xiao2023, Barrufet2023, Labbé2023, Akins2023, Pérez-González2023b, McKinney2023].
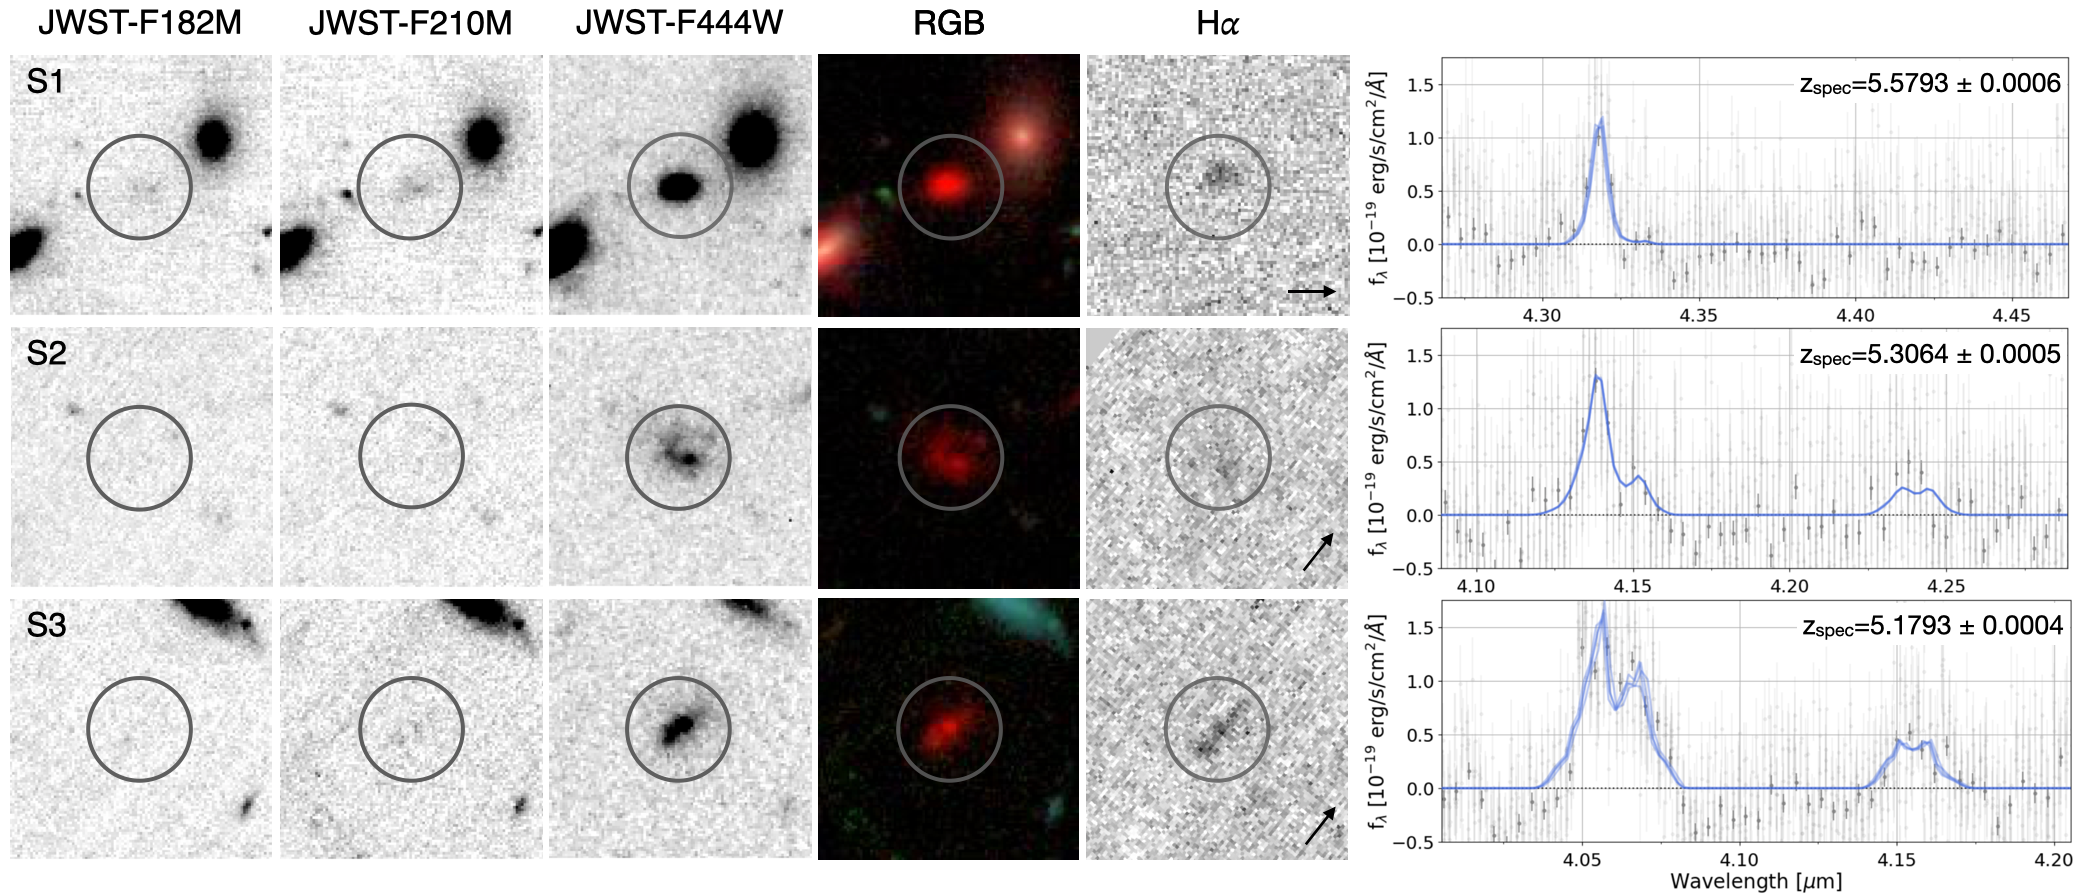
Among the parent sample, three optically dark galaxies at show the most extreme properties, i.e., extremely high masses with log() (Chabrier initial mass function, IMF[Chabrier2003]; Figs. 1, 2). These sources are named S1, S2, and S3. One of these has been known previously as a sub-millimeter galaxy GN10[Riechers2020]. Their extreme mass makes metals and dust inefficient to escape through stellar feedback from their ultra-deep gravitational potential, which is why they have been missed by optical observations until now. The detection of these optically dark galaxies shows another aspect of the power of JWST: it probes not only the very distant, but also the highly dusty and hidden Universe. Based on the deep JWST observations, we find that the three galaxies have extremely red properties (F182M F444W 3.5 mag; Fig. 1, Extended Data Fig. 1), due to their significant dust attenuation ( mag). Self-consistently, we find that they also have highly dust-obscured star formation rates (SFRIR), which are obtained from far-infrared SED fits with CIGALE, specifically yr-1 for S1, 1030 M⊙ yr-1 for S2, and M⊙ yr-1 for S3 (see Methods). This indicates that they are in the process of very efficient stellar mass build-up. We find no signs of a significant contribution to the rest-frame optical light by an AGN based on our investigation of the emission lines, source morphology, and multi-wavelength data. Therefore, we conclude that the ultra-massive nature of these three galaxies is reliable.
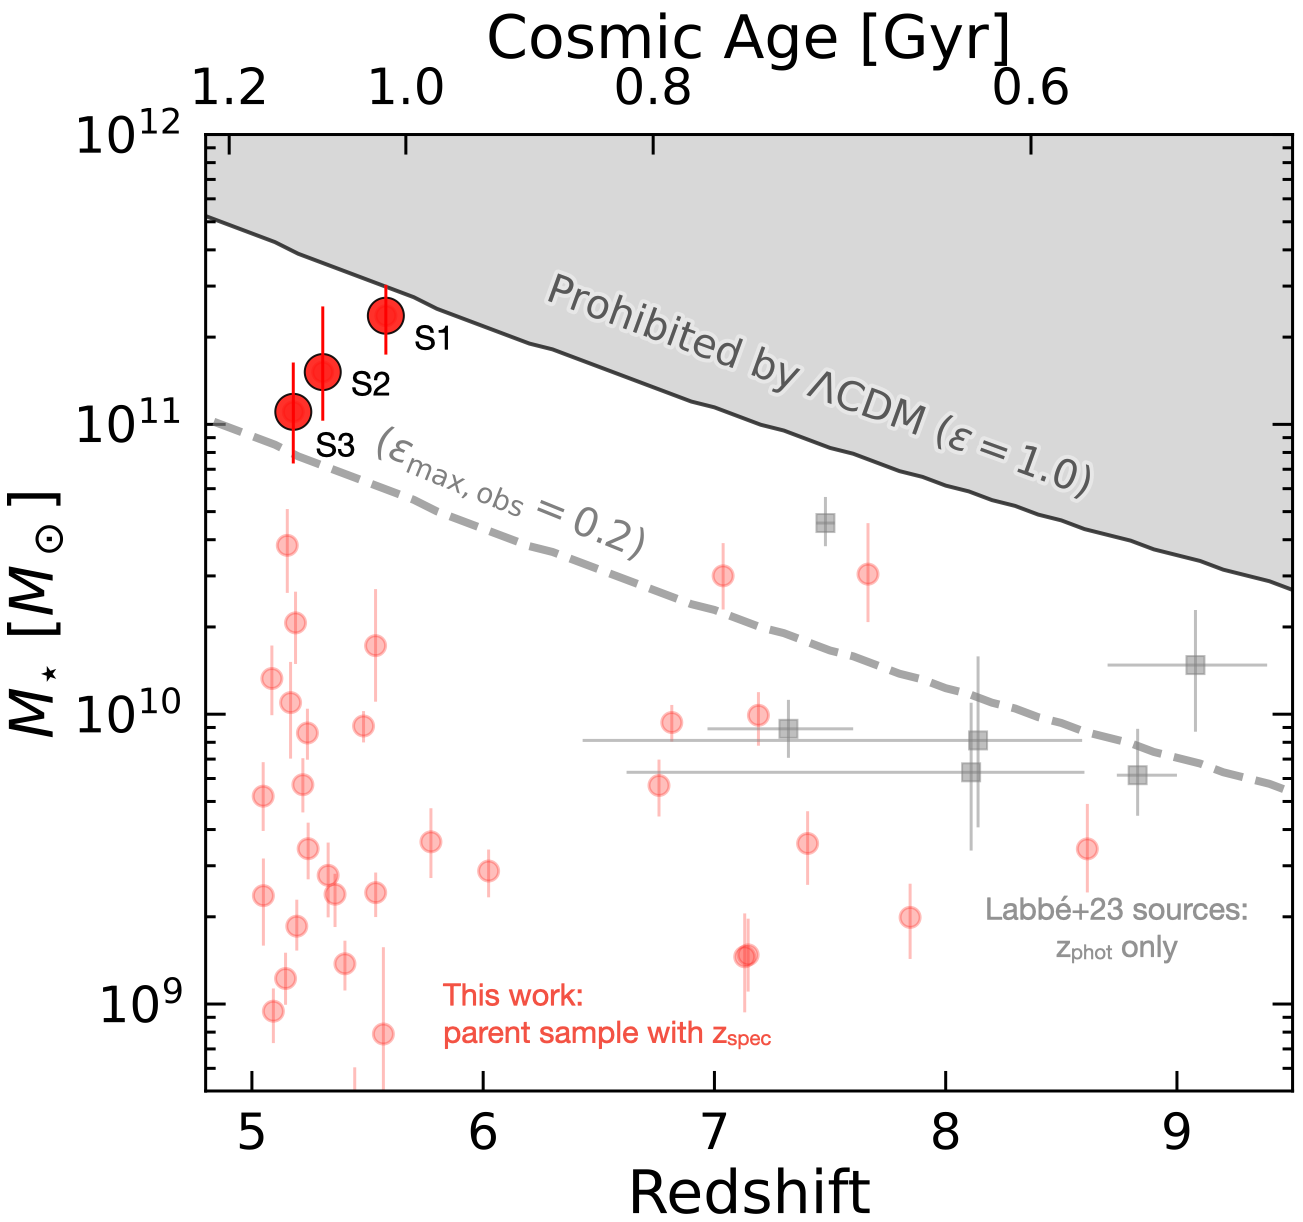
As shown in Fig. 2, we obtain robust spectroscopic redshift measurements at from the JWST/FRESCO NIRCam grism survey to characterize the population of 36 optically dark/faint galaxies. We highlight the three ultra-massive galaxies at and further reveal the extremity of their high stellar masses at their redshifts in comparison with the most massive galaxy which can be found according to the halo mass function and cosmic baryon fraction[Boylan-Kolchin2023, Lovell2023]. Under this paradigm, we derive the most massive dark matter halo mass at different redshifts in the corresponding FRESCO survey volume ( Mpc3 at ) according to the halo mass function. The maximum stellar mass is inferred from the maximum dark matter halo mass, based on , with a cosmic baryon fraction [Planck2020], and the maximum theoretical efficiency () of converting baryons into stars. Here, we consider two possible cases of , as shown in Fig. 2: the highest efficiency from observation-based phenomenological modelings, such as abundance matching and halo occupation distribution models (; dashed line)[Moster2013, Wechsler2018, Shuntov2022] and the maximum efficiency logically allowed (; solid line).
By comparing the masses of our galaxies with the predictions in Fig. 2, it is clear that these sources require an extremely efficient conversion of baryons to stars of about 0.5 on average – two to three times the highest efficiency observed at lower redshift (). These three galaxies lie at , demonstrating that the existence of ultra-massive galaxies that challenge our galaxy formation models is not restricted to the most distant Universe[Labbé2023], but extends over a wide period, which was previously hidden by heavy dust obscuration. This is also demonstrated by two further galaxies in our sample at that imply , similar to the photometrically selected sources from previous studies[Labbé2023]. However, their stellar masses are less robust, since the determination of stellar masses is mostly constrained by the F444W band. At , this band traces the emission of the rest-frame B-band, which is sensitive to dust attenuation and stellar age. Therefore, we mainly focus on the three ultra-massive galaxies at . At these lower redshifts, the determination of the stellar mass and SFR is more robust because F444W traces the rest-frame optical.
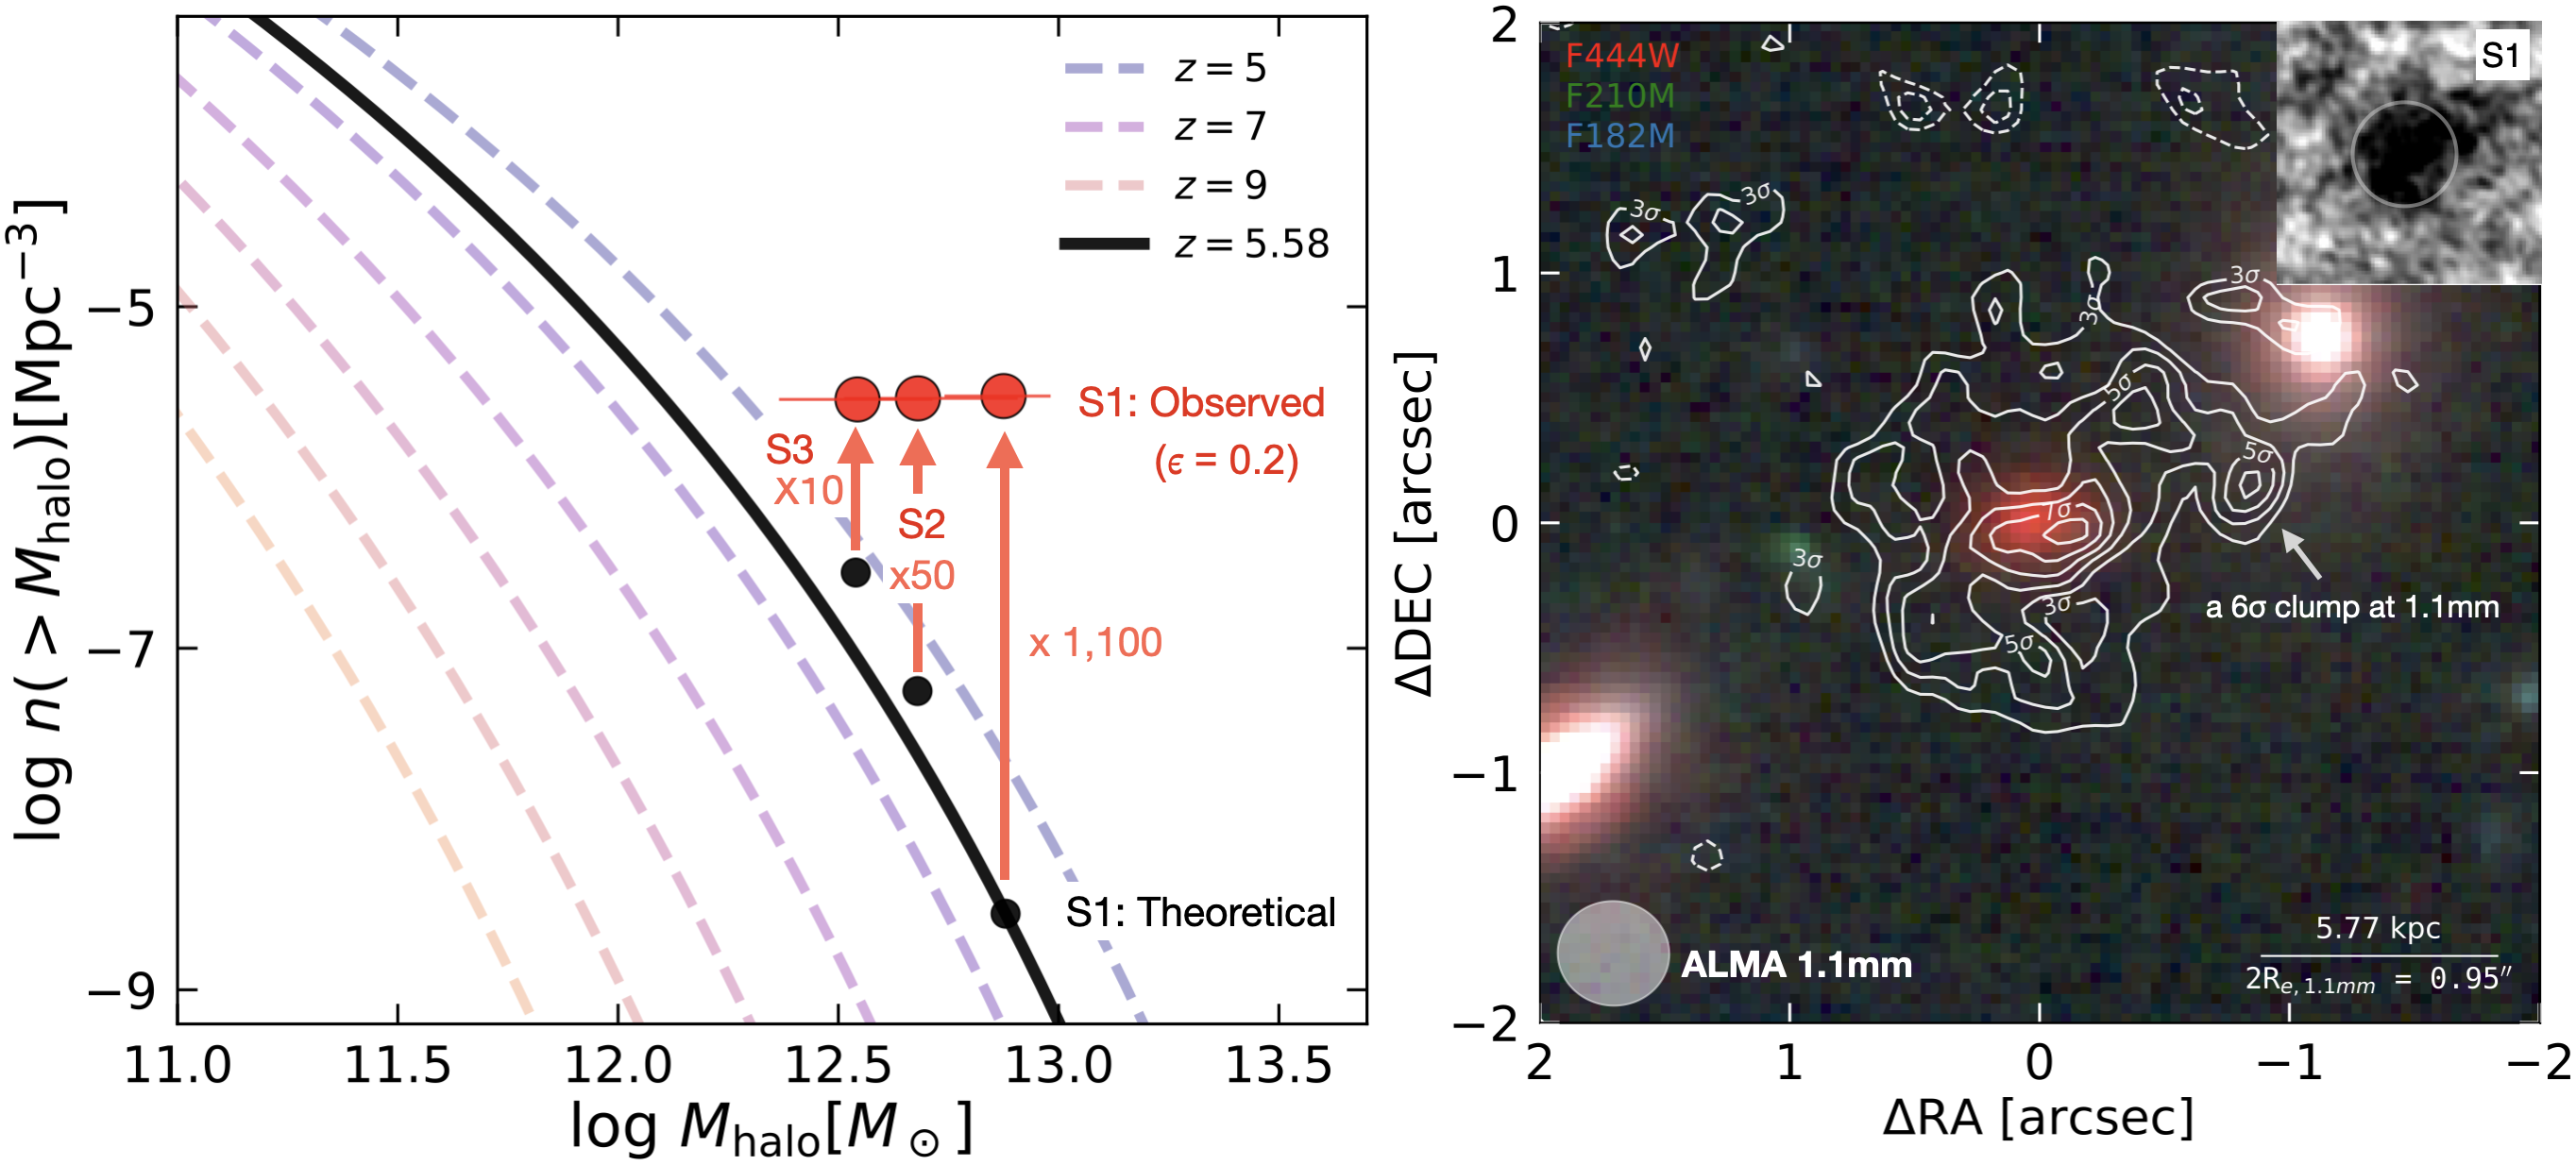
The high required baryon-to-stellar conversion efficiency in the three ultra-massive galaxies makes them extremely rare in simple galaxy formation models. Conservatively assuming a maximum observed efficiency of [Moster2013, Wechsler2018, Shuntov2022], the stellar masses of S1, S2, and S3 correspond to dark matter halo masses of log() , , and , respectively. The observed volume density is Mpc-3 at in the 124 arcmin2 of the FRESCO survey fields. For the most extreme case S1, compared to the theoretical cumulative halo number densities of Mpc-3, the probability of detecting such a source in a random field as large as the FRESCO survey is only 0.0009 (Fig. 3). It means that if the galaxy distribution in the Universe is homogeneous, and if , we would only have expected to detect one source such as S1 in a field 1,100 times the area of FRESCO. For S2 and S3, the probabilities are 0.02 and 0.09, respectively, which are also low enough to require 50 and 10 times the FRESCO field to detect them, respectively. This shows that the star-formation efficiencies in these galaxies must be significantly higher than normally found at lower redshifts in standard galaxy formation models within cold dark matter halos[White1978, Boylan-Kolchin2023].
Thanks to the combined power of ALMA and JWST, we now have the first insight into the physical mechanism at play in massive galaxy build-up (right panel of Fig. 3). In S1, we observe dust emission (half-light radius kpc) significantly more extended than the stellar component ( kpc), giving access to the circumgalactic region. We note that the dust distribution in dusty star-forming galaxies is typically more compact relative to the stellar distribution[Tadaki2020, Puglisi2021, Gómez-Guijarro2022], which is thought to be caused by angular momentum loss driven by mergers or counter-rotating gas accretion. Our findings for S1 seem to favor an opposite scenario, in which the galaxy activity may be triggered by a strong event of corotating and coplanar gas accretion through the cold streams[Danovich2012, Danovich2015, Kretschmer2022, Dekel2020, Xiao2022]. In addition, we find a 6 off-nuclear clump in the dust distribution map of S1 (see the right panel of Fig. 3). Surprisingly, no stellar emission associated with this clump is detected in the deep JWST data. It suggests that S1 might be undergoing a merger with an even more obscured galaxy that is still missed, even by JWST. Future ALMA data of the [CII] emission line will be able to test this scenario.
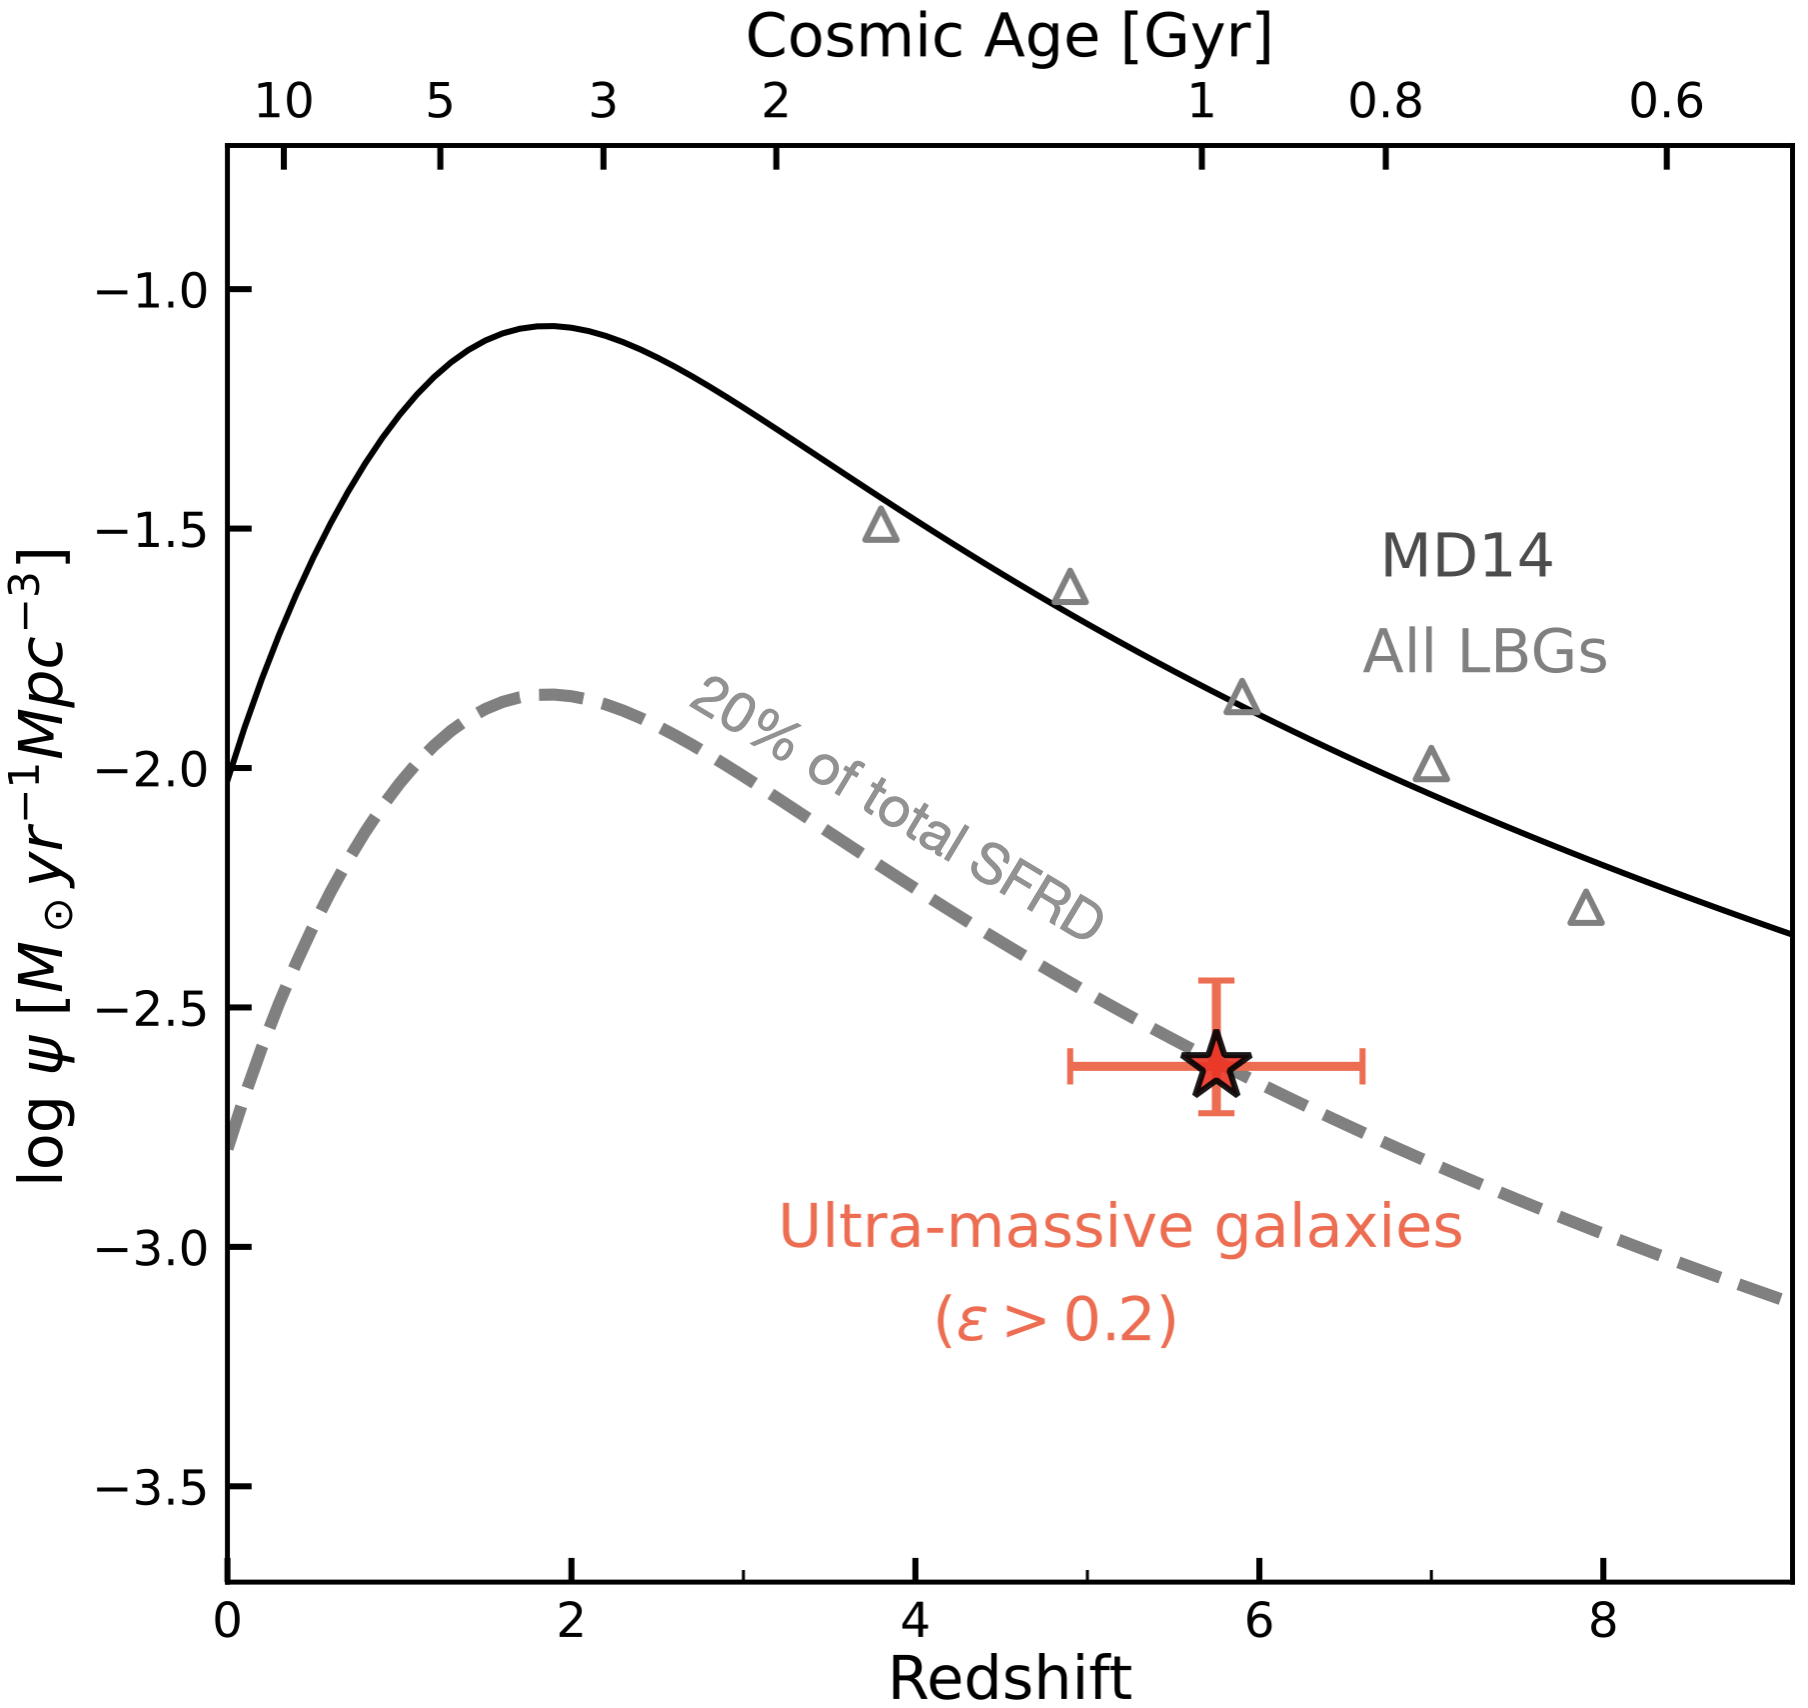
Extremely massive galaxies contribute significantly to the total cosmic star-formation rate density in the early Universe. We derive this in the redshift bin for our H sample (). Including only the three ultra-massive galaxies (), the SFR density reaches 2.4 10-3 yr-1Mpc-3 at 5.8. Compared to the total cosmic star-formation history[Madau2014] (Fig. 4), at , the existence of these galaxies implies a surprisingly high efficiency of baryon conversion into stars: about 20% of the stars formed above the peak value of . This finding suggests a substantial proportion of extremely efficient star formation in the early Universe.
With the secure spectroscopic redshift and stellar mass measurements, our results provide strong evidence that the early Universe has to be two to three times more efficient in forming massive galaxies than the average trend found by previous studies at later times. Our discovery, together with the possible excess of UV-luminous galaxies at revealed by JWST observations, indicates that early galaxy formation models may need to be revised. A top-heavy IMF[Zhang2018] or feedback-free starburst in the presence of extremely efficient gas infall from cold filaments[Dekel2023] could possibly reproduce the observed extreme properties of our sample. However, these scenarios still remain to be investigated with more detailed observations. With higher spatial resolution and (or) higher sensitivity, future ALMA/NOEMA and deep JWST spectroscopic observations could help consolidate the massive nature of these galaxies with dynamical mass measurements and test the different scenarios for their formation with the analysis of the kinematics and chemical composition of the interstellar medium.
References
Methods
.1 Cosmology.
Throughout this paper, we assume a Planck cosmology[Planck2020] and adopt a Chabrier IMF[Chabrier2003] to estimate stellar masses (M∗) and star formation rates (SFR). When necessary, data from the literature have been converted with a conversion factor of M∗ (Salpeter IMF)[Salpeter1955] = 1.7 M∗ (Chabrier IMF). All magnitudes are in the AB system[Oke1983], such that log(Sν [Jy]).
.2 FRESCO NIRCam grism spectra and imaging data.
The NIRCam data used in this paper stem from the JWST FRESCO survey111https://jwst-fresco.astro.unige.ch (GO-1895; PI: P. Oesch; see[Oesch2023] for details). FRESCO obtained direct images in three filters (F182M, F210M, and F444W) as well as NIRCam/grism spectroscopy in the F444W filter over 60 arcmin2 in each GOODS field, North and South, through two 24 NIRCam/grism mosaics. The grism spectra span a wavelength of 3.8 to 5.0 m, with some parts of the mosaic having slightly reduced coverage. With an exposure time of 7043 s, the grism data reach an average 5 line sensitivity of 210-18 erg s-1 cm-2 at a resolution of R1600. The FRESCO data were acquired between November 2022 and February 2023.
We use the publicly available grizli pipeline222https://github.com/gbrammer/grizli to reduce the slitless NIRCam/grism data (see also Brammer et al, in prep). The raw data are obtained from the MAST archive, and calibrated with the standard JWST pipeline, before being aligned to a Gaia-matched reference frame.
In order to produce a line-only dataset we remove the continuum along the dispersion direction following[Kashino2022]. We subtract a running median filter with a central 12-pixel gap (corresponding to rest-frame) along each row of the grism images. To minimize the self-subtraction of bright lines, the filtering is done in two passes, masking pixels with significant flux after the first pass.
Based on the direct F444W image an individual kernel is created for each source in order to perform optimal extractions of 1D spectra. Slightly modified sensitivity curves and spectral traces are used taking the publicly available v4 grism configuration files333https://github.com/npirzkal/GRISMCONF as the starting point.
In parallel to the long-wavelength grism data, FRESCO obtained short-wavelength imaging in F182M and F210M. At the end of each grism exposure, direct images in F444W are obtained to ensure that the grism data can be aligned. The 5 depths of the direct images in the F182M, F210M, and F444W filters are 28.3, 28.1, and 28.2 mag, respectively, as measured in circular apertures of 0\farcs32 diameter.
.3 Ancillary data and multi-wavelength catalogs.
In addition to the FRESCO NIRCam data, we also make use of public HST and JWST imaging over the GOODS fields. Most importantly, this includes the HST/ACS and WFC3/IR data from the original GOODS survey[Giavalisco1996] as well as CANDELS[Koekemoer2011, Grogin2011]. For a full list of all HST programs covering this field see the Hubble Legacy Field (HLF) release page444https://archive.stsci.edu/prepds/hlf/ (see also[Whitaker2019] and[Illingworth2016]). In GOODS-South, our data cover the Hubble Ultra Deep Field (HUDF[Beckwith2006]) and we include the deep JADES NIRCam imaging that was released in June 2023[Eisenstein2023, Rieke2023]. The images are all co-aligned and drizzled to a common 40 mas/pixel frame.
Multi-wavelength catalogs are derived using SExtractor[Bertin1996] in dual image mode, using an inverse-variance weighted stack of the NIRCam long-wavelength wide filters as the detection image. Fluxes are measured in 0\farcs16 radius circular apertures in images that are PSF-matched to the F444W band. Total fluxes are derived from the Kron AUTO aperture provided by the SExtractor in the F444W band, in addition to a correction based on the encircled energy of the Kron aperture on the F444W PSF.
Photometric redshifts are estimated through the SED-fitting code EAZY[Brammer2008], using the blue_sfhz_13 template set which imposes redshift-dependent SFHs, disfavoring SFHs that start earlier than the age of the Universe at a given redshift555https://github.com/gbrammer/eazy-photoz/tree/master/templates/sfhz. We apply an error floor of 5% prior to running eazy to account for possible remaining systematic uncertainties in the photometric fluxes[Labbé2023] and to allow for more flexibility in the SED-fitting. The methods used to derive the multi-wavelength catalogs with photometric redshifts will be presented in more detail in Weibel et al., in prep.
Far-infrared and millimeter data. In the GOODS-South field, the FRESCO survey overlaps with about 80% of the GOODS-ALMA 1.1mm survey[Franco2018, Gómez-Guijarro2022, Xiao2023] (PI: D. Elbaz). The GOODS-ALMA survey covers a continuous area of 72.42 arcmin2 and has a combined dataset[Xiao2023] of high- and low-resolution 1.1mm observations obtained from ALMA Cycle 3 and Cycle 5. The combined map achieves an rms sensitivity of 68.4 Jy beam-1 with a spatial resolution of 0\farcs447 0\farcs418. The GOODS-ALMA 2.0 source catalog is presented in ref.[Gómez-Guijarro2022]. In addition, the field is also covered by the JCMT/SCUBA-2 at 850m[Cowie2018]. The source S1, from our sample in GOODS-S, also has been observed by ALMA band-7 observations as a follow-up to a JCMT/SCUBA-2 target[Cowie2018]. In the GOODS-North field, the FRESCO coverage overlaps with the 450m and 850m surveys of JCMT/SCUBA-2[Cowie2017, Barger2022], as well as the 1.2mm and 2mm observations of the NIKA2 Cosmological Legacy Survey[Bing2023] and their NOEMA follow-up observations (PI: L. Bing, private communication).
.4 Optically dark/faint galaxies at .
The traditional approach used to systematically select optically dark/faint galaxies is based on photometric data only (pre- and present-JWST era). They are required to be faint or completely undetected at optical wavelengths, but bright in the infrared (e.g., 27 mag & [4.5] 24 mag for -dropouts[Wang2019]; 26.5 mag & [4.5] 25 mag for OFGs[Xiao2023]; see also[Alcalde2019, Barrufet2023, Gómez-Guijarro2023]). These magnitude and/or color cuts are designed to select red galaxies with strong Balmer or 4000 breaks at , so they should be either quiescent/passive galaxies or dusty star-forming galaxies with significant dust attenuation. The -band magnitude cut helps to avoid significant contamination from passive galaxies and low- sources[Xiao2023], but obviously, they cannot be entirely ruled out.
Now, by taking advantage of the unprecedented imaging and spectroscopic data provided by the JWST FRESCO survey, we no longer need to use the magnitude cuts described above to select optically dark/faint galaxies. The FRESCO grism spectra help us more securely identify high- star-forming sources through strong nebular emission lines. The spectral coverage of the FRESCO survey with F444W filter allows detections of either H+[NII]+[SII] lines or [OIII]+H lines at continuously.
We select candidate galaxies that are red (F182M F444W 1.5 mag; Extended Data Fig. 1) and have strong [OIII]+H or H+[NII]+[SII] emission line detections. The color threshold we set is similar to the lower color limit of optical dark/faint galaxy selection criteria in the literature[Xiao2023, Gómez-Guijarro2023, Akins2023, Pérez-González2023b, Barro2023], which helps to further compare our sample with those of the pre-JWST/spectra sample. We require all the galaxies to have 5 detections at F444W. With some galaxies not detected at F182M, we use the 2 limit as an upper limit in the color selection. For the emission line detection, we require the strongest line to be and the second strongest line to be . For some galaxies with only one line detected, we require that the line has detection and their must be within the 16-84th percentile uncertainties of the from the UV-to-NIR SED fitting with EAZY code. Finally, we have 36 galaxies at in our sample. Among these, 22 out of 36 galaxies have at least two emission line detections or measurements confirmed from the literature (see Extended Data Table. 1).
The Extended Data Fig. 1 presents our sample selection results on the full FRESCO field, as well as the comparison with previous selection methods and model expectations. Compared to previous selections of -dropouts from Spitzer/IRAC[Wang2019], our method extends the identification of optically dark/faint galaxies to fainter F444W/4.5m fluxes and bluer colors.
In Extended data Fig. 1, we present a comparison between the color and magnitude of our sample and the model-predicted SED of galaxies. The redshift evolution track of galaxies across the color-magnitude diagram is computed using BC03[Bruzual2003] stellar population synthesis model with constant star formation history starting at . The SEDs are further reddened using a Calzetti dust extinction law with E(B-V) at 0.2, 0.4, 0.6, and 0.8 to simulate the color and magnitude evolution of dusty star-forming galaxies. The evolution tracks of galaxies with a total stellar mass of and are presented.
While the optically faint selection criteria are defined to target dust-obscured sources, galaxies can also exhibit red F182M F444W colors due to emission line contamination in the F444W filter. Thanks to the FRESCO emission line measurements, we can now correct this and check which sources only appear red due to line emission. Therefore, we subtract the measured line fluxes from the broad-band photometry to derive pure continuum flux measurements (F444Wc). This shows that a small number (10 sources) at the faint end only satisfies our selection criteria due to line boosting (see Fig. 1). The brighter galaxies discussed in the main text, however, are only a little affected by this.
The emission-line corrected colors further ensure a fair comparison between our sample with the evolution tracks. This clearly reveals that our JWST imaging+spectroscopic selection could (1) select optically dark/faint galaxies with high purity and without contamination of passive galaxies, and (2) extend the selection of dusty galaxies to lower , lower amount of (but still significant) dust reddening and higher .
Our stellar mass estimation suggests the FRESCO dusty star-forming galaxy sample has log() and at (see Extended Data Table 1 and the section on stellar mass measurements for further details). For comparison, the traditional methods of selecting dusty galaxies (grey triangular regions[Wang2019] in Extended Data Fig. 1; see also[Xiao2023, Alcalde2019, Barrufet2023, Gómez-Guijarro2023]) miss the majority of high- and(or) faint sources in our sample, but still exclusively select the three ultra-massive and most reddened galaxies with log() at . This further suggests the power and importance of JWST data in providing a complete picture of dusty galaxies in the early Universe.
Stellar masses.
The physical properties of these 36 optically dark/faint galaxies in our parent sample are estimated by fitting the UV-to-NIR SED from the JWST+HST photometry using BAGPIPES[Carnall2018], with the fixed. We assume a constant star formation history (SFH), the Bruzual stellar population models[Bruzual2003], and a Calzetti dust attenuation law[Calzetti2000]. We adopt a broad metallicity grid from 0.1 to 2.0 , an grid from 0 to 5 mag, and an age grid from 10 Myr to 1.5 Gyr. For our SED fits, we use the emission line subtracted F444W fluxes in order to remove one free parameter of the emission line model and only fit the stellar continuum emission. We have also ensured that no other strong emission lines are contaminating other photometric bands. From this, we obtain the main physical properties of the 36 optically dark/faint galaxies: , , and SFR. These properties of our sample are listed in Extended Data Table 1. Their locations in the star-formation main sequence (SFMS) are shown in Extended Data Fig. 2. We would like to emphasize that due to the lack of far-infrared and millimeter data for most of the sources, the physical properties here are only obtained from UV-to-NIR SED fits. In this case, the and SFRs of these dusty star-forming galaxies (and the SFR densities in Fig. 4) might be underestimated, as they may contain hidden dust regions that absorb all the UV photons, which cannot be reproduced with dust extinction corrections[Xiao2023, Elbaz2018, Puglisi2017]. However, the possible underestimation of , SFR, and therefore the SFR density, would make our main results in this paper even more significant. A further comparison of the SFRs obtained from the UV-to-NIR fit with those derived from the IR SED for the three ultra-massive galaxies can be found in the section on Infrared luminosity and obscured star formation. Examples of best-fit SEDs for three ultra-massive galaxies are in Extended Data Figs. 3, 4, and 5.
We note that although we could accurately remove the contamination of the emission line in the F444W broad-band photometry, the contribution of the nebular continuum could still be important at shorter wavelengths. To check the possible impact of the nebular continuum, we performed SED modeling on our sample with the original FRESCO and HST broad-band photometry and stellar+nebular model of BAGPIPES. Here we model the nebular emission with a range of ionization parameters log from -4 to -2 and set the other parameters to be the same as the line-free modeling described above. With these setups, we obtain stellar mass consistent with that from the line-free modeling within 1 uncertainty. This indicates that the contribution of the nebular continuum to the broad-band photometry of our sample is negligible and the massive nature of our sample is robust.
To test the robustness of our results, we also use different SFH models (i.e., constant SFH, delayed SFH, and a combination of delayed SFH and a recent burst) and different codes (i.e., BAGPIPES[Carnall2018] and CIGALE[Boquien2019]) in the SED fitting for 36 optically dark/faint galaxies. The and SFR values derived from different codes are generally consistent within the errors. However, there are global differences in SFR at different SFHs. Overall, the delayed SFH+burst model returns the highest SFR, followed by the constant SFH, and the delayed SFH returns the lowest SFR. This is reasonable because the SFR values here trace the most recent star formation (i.e., the last 10 Myr in BAGPIPES; instantaneous star formation in CIGALE). In addition, we note that the fitting results are strongly constrained by the range of initial parameter values, especially in the delayed SFH and the delayed SFH+burst models (i.e., a long timescale of decrease will yield a constant-like SFH and a short will lead to a burst-like SFH). Considering the optically dark nature of our sources, so that the photometric data points at UV-to-NIR wavelength are limited, we adopt the constant SFH – the simplest and most constrained model – in this work. In the Extended Data Table 2, we show the consistent values derived from BAGPIPES and CIGALE for the three ultra-massive galaxies studied in this paper under different SFH models.
Overall, with the JWST FRESCO imaging and grism spectroscopic survey, we present a robust stellar mass and redshift determination for a sample of optically dark/faint galaxies at (Fig. 1). These galaxies are red (F182M F444W ), with a wide distribution of log(/) and at (see Extended Data Table 1). Most intriguingly, our sample contains three spectroscopically confirmed ultra-massive galaxies (log/ ) at and two ultra-massive galaxies (log/ ) at . They all present very efficient star formation with (Fig. 2). To conclude, our findings of the existence of ultra-massive galaxies over a wide period (not only limited to the first few hundred million years), suggest that the Universe is forming galaxies much more efficiently than we expected.
Reliability of the for S1.
Among our three ultra-massive galaxies at , S1 is the only source with a single emission line (14). Although the solution of the H line with is in excellent agreement with the from EAZY, we here also investigate the possibility of other emission lines. If the line with 14 detection was [OIII] () or [SIII] (), we should also detect [OIII] or [SIII] over the wavelength coverage of F444W at about 5, considering the theoretical flux ratios of these two pairs ([OIII]/[OIII] and [SIII]/[SIII][Landt2015]). Over the wavelength coverage of the F444W filter (3.8 to 5.0 m), the detection of only one line, i.e., the strongest line, can only be the Pa () line or Pa () line. Therefore, we mainly focus on the possibilities of H, Pa, and Pa in the following discussion.
We perform SED fitting with Bagpipes, with the same parameter settings as mentioned above. In the fitting process, we fix the corresponding to the H, Pa, and Pa lines, respectively. The fitting results are shown in the Extended Data Fig. 6. The chi-square values for the H, Pa, and Pa lines are 1.9, 6.4, and 29.9, respectively. This shows that the best fit is obtained for the case of the H line.
We also test the different redshift solutions using Bagpipes with more degrees of freedom in the dust attenuation law. The CF00 dust attenuation law[Charlot2000] combined with a wide Power-law slope value range from 0.5 to 2 returns values of 4.6, 12.3, and 47.5 for the H, Pa, and Pa lines, respectively. The Salim dust attenuation law[Salim2018] combined with a slope value range from -1.0 to 0.5 returns values of 3.0, 6.0, and 22.6 for the H, Pa, and Pa lines, respectively.
In addition, since S1 has a strong detection at ALMA 1.1mm ( mJy)[Gómez-Guijarro2022], we can calculate its SFRIR under different redshift solutions, and then compare the SFRIR with the SFR value derived from UV-to-NIR SED fitting (Extended Data Fig. 6). We calculate the SFRIR based on the infrared luminosity, which is obtained from the IR template library[Schreiber2018] normalized to the 1.1mm flux, following the method in the literature[Xiao2023] (see section on Infrared luminosity and obscured star formation). For the H, Pa, and Pa line solutions, the derived SFRIR values are yr-1, yr-1, and yr-1, respectively, and the SFRs are yr-1, yr-1, and yr-1, respectively. The SFRIR and SFR values for the H solution are in excellent agreement. However, for the Pa and Pa solutions, their SFRIR are about 20 and 200 times higher than their SFRs, respectively, resulting in a large discrepancy that cannot be explained by the uncertainties caused by the differences in the SED fitting models.
Furthermore, if we assume the observed line to be Pa (12821.6Å), it is expected to be less affected by dust attenuation as it falls into the rest-frame near-infrared. Therefore, we can make a direct comparison between SFRPaβ and SFRIR. We calculate the SFRPaβ following the equation of SFRPaβ [M⊙yr-1] = 3.84 10-41 (Pa [erg s-1][Reddy2023], where the (Pa is the luminosity of Pa. The derived SFRPaβ is yr-1, which is about 12 times lower than the SFRIR.
Overall, all of the above tests provide poorer results to the Pa and Pa lines compared to the H line. Therefore, we rule out these two lines in S1. On the other hand, the solution of from the H line is consistent with (1) the from EAZY; (2) the case of the excellent agreement between the SFRIR and SFR values; (3) the evolutionary tracks of theoretical dusty star-forming galaxy templates, suggesting the presence of extremely dust-obscured massive galaxies at (see Extended Data Fig. 1); and (4) the literature findings that optically dark/faint galaxies are generally located at [Wang2019, Zhou2020, Jin2022, Barrufet2023, Xiao2023].
Consequently, we consider the of H line in S1 reliable.
Possible AGN contamination. To confirm the reliability of the ultra-massive nature of the three galaxies S1, S2, and S3, we further examined whether their line-subtracted broadband photometry could potentially be contaminated by AGN. The contamination of AGN emission could lead to an overestimation of stellar mass values in SED modeling that only accounts for stellar emission in models. Type II (narrow emission lines only) AGN can produce strong, narrow line emission, whose flux contribution has been securely subtracted from the broadband photometry before we perform the Bagpipes SED fitting, following the analysis procedure of typical star-forming galaxies. However, type I (broad emission line) AGNs also show continuum emission of the accretion disk, which cannot be removed with our method. Therefore, the most important thing is to check if there is a type I AGN in our three ultra-massive galaxies.
In our parent sample of 36 optically dark/faint galaxies, seven galaxies have distinct broad H emission lines (full-width half maximum km s-1) with a red point source morphology, in agreement with the recently discovered “little red dot (LRD)” population[Matthee2023, Labbé2023]. These seven galaxies are presented in ref[Matthee2023] and marked with “LRD” in the Extended Data Table 1. Among our three ultra-massive galaxies, none of them are in the sample of these seven galaxies, suggesting the lack of the typical telltale signs of type I AGN in their spectra (see Fig. 1). Specifically, we note that S3 shows a relatively broader apparent line width compared to S1 and S2. However, the intrinsic of S3 is only found to be about 75 km s-1. Its broad appearance in the 1D spectra is mainly due to the coincidence of alignment between the dispersion direction of the F444W grism and the elongated disk morphology of S3. Furthermore, if S3 has a strong type I AGN, we should see the H line to be significantly wider than the [NII] line, but is not actually the case. On the other hand, we also investigate the structural properties of our three sources, to check whether they have a red point source morphology as type I AGN. The low values of best fit Sérsic index and extended morphology from Galfit[Peng2002] suggest that they are not dominated by a point source (see the following section on Stellar structures of S1, S2, and S3 for detailed discussion). All of the evidence above suggests that the stellar masses of these galaxies are not significantly affected by an AGN and that their ultra-massive nature is reliable.
Morphology of S1, S2, and S3
We place constraints on the structural properties of our three sources in F444W and H emission with Galfit[Peng2002]. Images are fit with a single Sersic profile convolved with the PSF allowing the centroid, total brightness, half-light radius, Sersic index, axis ratio, and position angle to vary. PSFs are derived from the WebbPSF software[Perrin2014] and rotated to match the position angle of the observations. Sources more than 3” away or more than 2.5 mag fainter are masked; closer and brighter sources are fit simultaneously. All three sources have a best fit Sérsic index and radii pixels, suggesting that they are not dominated by a point source (see Extended Data Table 3 and Extended Data Fig. 7). In order to quantify the potential contamination of their flux measurements by a Type I AGN, we compute the fraction of the total flux that remains in the central resolution element of the residual image. For all three sources, this is less than 2%, suggesting that flux contamination from a potential AGN is not likely to be the driving factor behind the large fiducial mass estimates.
Infrared luminosity and obscured star formation. S1, S2, and S3 are optically dark galaxies that have star formation heavily obscured by dust, with mag. Although we have obtained their SFRs from UV-to-NIR SED fits corrected for dust attenuation (Extended Data Table 1), we independently calculated their obscured star formation here using infrared wavelength data (SFRIR). Considering that the three sources have different far-infrared datasets, we used different methods to obtain their total infrared luminosity (; 8-1000m rest-frame) and SFRIR.
For S1, we only have the 850m flux from the JCMT/SCUBA-2 and ALMA band-7 observations[Cowie2018], and the 1.1mm flux from the GOODS-ALMA survey[Gómez-Guijarro2022, Xiao2023]. For S3, we obtain 450m and 850m fluxes from JCMT/SCUBA-2[Cowie2017, Barger2022], 1.2mm flux from NOEMA (PI: L. Bing, private communication), and 1.2mm and 2mm fluxes from the NIKA2 survey[Bing2023]. These two sources are either not detected in Herschel or are strongly affected by neighboring bright sources, so we do not include Herschel values in our analysis here.
We first perform the FIR SED fitting to S3 with CIGALE using fixed . We use the Draine dust emission templates[Draine2014] to derive , with the same parameter settings as in ref.[Xiao2023]. The SFRIR is then calculated based on the , following the method of ref.[Kennicutt2012]. The derived values for S3 are and SFRyr-1. In addition, for S1, due to its limited dataset, we use two different approaches for the SED fitting analysis. The first method assumes that it has the same SED shape as S3. We perform the SED fitting using CIGALE as described above, but with fixed parameter settings obtained from the best-fit model of S3. The second method is to re-normalize the IR templates[Schreiber2018] to the ALMA 1.1mm flux, according to the method of ref.[Xiao2023]. The two methods yielded very consistent values, i.e., and SFRyr-1 from the first methods and and SFRyr-1 from the second methods. In the main body of the paper, we show the values obtained by the first method.
For S2, the so-called GN10, we obtain its and SFRyr-1 from ref.[Riechers2020]. These values are also derived from CIGALE SED fits, based on extensive data from Herschel, JCMT/SCUBA, SMA, and NOEMA observations.
The SFRIR of S1 is similar to the SFR value derived from the UV-to-NIR SED fit (Extended Data Table 1). However, the SFRIR of S2 and S3 are about three times higher than their SFRSED, implying that there may be hidden dust regions in these galaxies that absorb all the UV photons, which cannot be reproduced with a dust extinction correction[Xiao2023, Elbaz2018, Puglisi2017], or that our assumed star-formation histories are not appropriate. Irrespective of this, the high SFRIR values indicate that our galaxies are in a very efficient mass assembly and accumulation process, which explains why they are so massive.
The maximal halo mass (). In this paper, we define the as the mass above which the cumulative dark matter halo mass function predicts one halo to be detected in the FRESCO survey volume (). Under the most updated Planck cosmology[Planck2020], we consider the full FRESCO survey volume as the comoving cube enclosed by the 124 arcmin2 survey area between and , where either H+[NII] or H+[OIII] fall into the spectral coverage. This corresponds to a total survey volume of comoving Mpc3. As for the halo mass function, we compute it following [Tinker2008] using the Python package hmf[Murray2013] under the same Planck cosmology[Planck2020]. With the halo mass function, we further derive the cumulative number density of dark matter halos above a certain mass (), as a function of redshift and halo mass. According to the definition, the maximum halo mass at a given redshift (z) thus satisfies n(M, ) = 1, from which we derive its redshift evolution and further constrain the maximal stellar mass of galaxies expected by very simplistic galaxy assembly models in Fig. 2.
References
This work is based on observations made with the NASA/ESA/CSA James Webb Space Telescope. The data were obtained from the Mikulski Archive for Space Telescopes at the Space Telescope Science Institute, which is operated by the Association of Universities for Research in Astronomy, Inc., under NASA contract NAS 5-03127 for JWST. These observations are associated with program # 1895.
Support for this work was provided by NASA through grant JWST-GO-01895 awarded by the Space Telescope Science Institute, which is operated by the Association of Universities for Research in Astronomy, Inc., under NASA contract NAS 5-26555.
This work has received funding from the Swiss State Secretariat for Education, Research and Innovation (SERI) under contract number MB22.00072, as well as from the Swiss National Science Foundation (SNSF) through project grant 200020_207349. The Cosmic Dawn Center (DAWN) is funded by the Danish National Research Foundation under grant No. 140.
RPN acknowledges funding from JWST programs GO-1933 and GO-2279. Support for this work was provided by NASA through the NASA Hubble Fellowship grant HST-HF2-51515.001-A awarded by the Space Telescope Science Institute, which is operated by the Association of Universities for Research in Astronomy, Incorporated, under NASA contract NAS5-26555.
YF acknowledges support from NAOJ ALMA Scientific Research Grant number 2020-16B.
YQ acknowledges support from the Australian Research Council Centre of Excellence for All Sky Astrophysics in 3 Dimensions (ASTRO 3D), through project number CE170100013.
MS acknowledges support from the CIDEGENT/2021/059 grant, from project PID2019-109592GB-I00/AEI/10.13039/501100011033 from the Spanish Ministerio de Ciencia e Innovación - Agencia Estatal de Investigación. MST also acknowledges the financial support from the MCIN with funding from the European Union NextGenerationEU and Generalitat Valenciana in the call Programa de Planes Complementarios de I+D+i (PRTR 2022) Project (VAL-JPAS), reference ASFAE/2022/025.
Cloud-based data processing and file storage for this work is provided by the AWS Cloud Credits for Research program.
The authors declare no competing interests.
M.X. performed the majority of the present analysis and wrote the majority of the text, with significant help from P.A.O., D.E., and L.B. E.N. performed Galfit modeling of the sources and emission line maps. A.W. produced the multi-wavelength catalogs used in this work. G.B. reduced the grism data. All authors contributed to the manuscript and helped with the analysis and interpretation.
All the raw data are publicly available through the Mikulski Archive for Space Telescopes666https://archive.stsci.edu/ (MAST), under program ID 1895. The FRESCO data are being released on MAST as a High-Level Science Product via https://doi.org/10.17909/gdyc-7g80. Images are already available. The spectra are being calibrated and will be discussed in an upcoming data paper (Brammer et al., in prep.). For updates, please check the survey webpage: https://jwst-fresco.astro.unige.ch/ or the MAST page https://archive.stsci.edu/hlsp/fresco/.
Extended Data
| S.No. | ID | RA | DEC | S/N | log() | log(SFR) | AGN | other ID | ||
| (deg) | (deg) | log() | log(yr-1) | (mag) | ||||||
| (1) | (2) | (3) | (4) | (5) | (6) | (7) | (8) | (9) | (10) | (11) |
| S-15496 | 03:32:24.66 | -27:44:40.08 | 5.049∗ | 17.2 | 9.72 | 1.05 | 1.7 | |||
| S-11579 | 03:32:20.82 | -27:47:14.76 | 5.330∗ | 20.9 | 9.44 | 0.82 | 1.4 | |||
| S-4166 | 03:32:35.44 | -27:50:31.38 | 5.402∗ | 19.6 | 9.14 | 0.42 | 0.2 | |||
| S-10944 | 03:32:27.46 | -27:47:31.63 | 5.445 | 9.14 | 8.64 | 0.41 | 0.3 | JADES-116930[Bunker2023] | ||
| S-11150 | 03:32:33.26 | -27:47:24.91 | 5.483 | 30.4 | 9.96 | 1.17 | 1.0 | JADES-204851[Bunker2023] | ||
| S1 | S-18258 | 03:32:28.91 | -27:44:31.53 | 5.579∗ | 14.3 | 11.37 | 2.81 | 3.2 | OFG28[Xiao2023], A2GS33[Gómez-Guijarro2022], ID68[Cowie2018], ID20[Yamaguchi2019] | |
| S-5661 | 03:32:20.87 | -27:49:54.85 | 5.774∗ | 10.6 | 9.56 | 1.00 | 1.4 | |||
| S-12686 | 03:32:34.63 | -27:46:47.48 | 6.090∗ | 15.5 | 8.29 | 0.33 | 1.0 | |||
| S-19392 | 03:32:38.73 | -27:44:15.60 | 6.815 | 20.9 | 9.97 | 1.30 | 1.1 | JADES-219000[Bunker2023] | ||
| S-6209 | 03:32:32.12 | -27:49:41.72 | 7.664 | 8.3 | 10.48 | 2.05 | 3.7 | JADES-90354[Bunker2023] | ||
| S-8010 | 03:32:20.99 | -27:48:53.71 | 7.846 | 26.8 | 9.30 | 0.88 | 0.3 | JADES-GS-53.08745-27.81492[Hainline2023] | ||
| N-1002 | 12:36:35.50 | +62:11:04.29 | 5.050∗ | 10.9 | 9.37 | 0.82 | 1.4 | |||
| N-15498 | 12:37:08.53 | +62:16:50.82 | 5.086 | 17.0 | 10.12 | 1.37 | 2.0 | LRD | ||
| N-6079 | 12:36:55.73 | +62:13:36.33 | 5.093∗ | 15.1 | 8.98 | 0.27 | 0.6 | |||
| N-14409 | 12:36:17.30 | +62:16:24.35 | 5.146 | 30.6 | 9.09 | 0.33 | 0.2 | LRD | ||
| N-1257 | 12:36:24.68 | +62:11:17.01 | 5.167 | 21.8 | 10.04 | 1.82 | 1.6 | |||
| S3 | N-2663 | 12:36:56.56 | +62:12:07.37 | 5.179 | 22.6 | 11.04 | 2.48 | 3.4 | ||
| N-3188 | 12:36:51.97 | +62:12:26.04 | 5.187 | 15.7 | 10.58 | 2.30 | 1.8 | HDF850.1[Walter2012, Herard-Demanche2023] | ||
| N-7162 | 12:37:16.90 | +62:14:00.90 | 5.189 | 21.7 | 10.32 | 1.71 | 1.6 | |||
| N-16116 | 12:36:56.62 | +62:17:07.97 | 5.194∗ | 14.6 | 9.27 | 0.51 | 0.5 | |||
| N-4014 | 12:37:12.03 | +62:12:43.36 | 5.221 | 34.1 | 9.76 | 1.05 | 1.2 | LRD | ||
| N-12839 | 12:37:22.63 | +62:15:48.11 | 5.240 | 40.2 | 9.94 | 1.16 | 1.0 | LRD | ||
| N-13733 | 12:36:13.70 | +62:16:08.18 | 5.243 | 25.0 | 9.54 | 0.77 | 1.0 | LRD | ||
| S2 | N-7496 | 12:36:33.42 | +62:14:08.57 | 5.306 | 14.3 | 11.18 | 2.58 | 3.4 | GN10[Riechers2020] | |
| N-16813 | 12:36:43.03 | +62:17:33.12 | 5.359 | 48.5 | 9.38 | 0.67 | 0.1 | LRD | ||
| N-9771 | 12:37:07.44 | +62:14:50.31 | 5.535 | 101.9 | 10.24 | 2.05 | 1.8 | LRD | ||
| N-6924 | 12:37:02.72 | +62:13:55.07 | 5.535∗ | 20.3 | 9.38 | 0.64 | 0.3 | |||
| N-14178 | 12:36:41.69 | +62:16:18.39 | 5.569∗ | 14.7 | 8.90 | 0.35 | 1.2 | |||
| N-1459 | 12:36:41.95 | +62:11:24.47 | 6.024∗ | 15.7 | 9.46 | 0.78 | 0.4 | |||
| N-12207 | 12:36:36.47 | +62:15:34.72 | 6.760∗ | 23.5 | 9.75 | 1.11 | 0.6 | |||
| N-9094 | 12:36:04.62 | +62:14:36.71 | 7.038 | 73.7 | 10.48 | 1.91 | 1.3 | |||
| N-489 | 12:36:47.52 | +62:10:37.27 | 7.131 | 31.4 | 9.16 | 0.80 | 0.7 | |||
| N-8697 | 12:37:00.04 | +62:14:29.00 | 7.146 | 19.3 | 9.17 | 0.69 | 0.4 | |||
| N-2756 | 12:36:20.04 | +62:12:09.29 | 7.190 | 18.4 | 10.00 | 1.42 | 0.8 | |||
| N-11316 | 12:36:10.84 | +62:15:16.32 | 7.403∗ | 14.2 | 9.55 | 1.09 | 0.8 | |||
| N-4380 | 12:36:41.09 | +62:12:53.12 | 8.613 | 16.4 | 9.54 | 1.14 | 1.0 | JADES-GN-189.17121+62.21476[Hainline2023] |
| Bagpipes | CIGALE | |||||
|---|---|---|---|---|---|---|
| S.No. | CSFH | DSFH | DSFH+burst | CSFH | DSFH | DSFH+burst |
| S1 | 11.37 | 11.34 | 11.33 | 11.16 | 11.27 | 11.42 |
| S2 | 11.18 | 11.17 | 11.14 | 11.11 | 11.40 | 11.36 |
| S3 | 11.04 | 11.01 | 10.96 | 10.99 | 11.00 | 11.04 |
| direct image | H | |||||
|---|---|---|---|---|---|---|
| S.No. | (kpc) | n | q | (kpc) | n | q |
| S1 | 0.760.01 | 1.570.03 | 0.540.01 | 0.890.08 | 0.200.19 | 0.720.08 |
| S2 | 2.570.25 | 1.180.14 | 0.640.04 | 1.920.46 | 1.550.43 | 0.770.13 |
| S3 | 2.220.09 | 2.310.09 | 0.420.01 | 2.100.09 | 0.200.11 | 0.180.02 |
![[Uncaptioned image]](/html/2309.02492/assets/ext_fig1_chabrier.png)
![[Uncaptioned image]](/html/2309.02492/assets/x1.png)
![[Uncaptioned image]](/html/2309.02492/assets/ext_S1.png)
![[Uncaptioned image]](/html/2309.02492/assets/ext_S2.png)
![[Uncaptioned image]](/html/2309.02492/assets/ext_S3.png)
![[Uncaptioned image]](/html/2309.02492/assets/S1_solution_chabrier_.png)
![[Uncaptioned image]](/html/2309.02492/assets/x2.png)