Infrared color selection of massive galaxies at
Abstract
We introduce a new color-selection technique to identify high-redshift, massive galaxies that are systematically missed by Lyman-break selection. The new selection is based on the () and Infrared Array Camera (IRAC) 4.5 µm bands, specifically mag. These galaxies, dubbed “HIEROs”, include two major populations that can be separated with an additional color. The populations are massive and dusty star-forming galaxies at () and extremely dusty galaxies at (). The 350 arcmin2 of the GOODS-North and GOODS-South fields with the deepest HST/WFC3 near-infrared and IRAC data contain as many as 285 HIEROs down to mag. Inclusion of the most extreme HIEROs, not even detected in the band, makes this selection particularly complete for the identification of massive high-redshift galaxies. We focus here primarily on () HIEROs, which have a median photometric redshift and stellar mass and are much fainter in the rest-frame UV than similarly massive Lyman-break galaxies (LBGs). Their star formation rates (SFRs), derived from their stacked infrared spectral energy distributions, reach 240 yr-1 leading to a specific SFR, Gyr-1, suggesting that the sSFRs for massive galaxies continue to grow at but at a lower growth rate than from to . With a median half-light radius of 2 kpc, including as compact as quiescent galaxies at similar redshifts, HIEROs represent perfect star-forming progenitors of the most massive ( ) compact quiescent galaxies at and have the right number density. HIEROs make up of all galaxies with identified at from their photometric redshifts. This is five times more than LBGs with nearly no overlap between the two populations. While HIEROs make up 15–25% of the total SFR density at –5, they completely dominate the SFR density taking place in galaxies, and HIEROs are therefore crucial to understanding the very early phase of massive galaxy formation.
Subject headings:
galaxies: evolution — galaxies: formation — galaxies: high-redshift — galaxies: structure1. Introduction
Our current understanding of the cosmic star formation history at is mostly based on studies of UV-selected samples, e.g., Lyman-break galaxies (LBGs). Yet the LBG selection is known to be biased significantly against massive galaxies ( , because of both the relative faintness and redder UV slopes for massive galaxies (van Dokkum et al., 2006; Bian et al., 2013). On the other hand, studies of the stellar mass function based on photometric-redshift-selected galaxies from CANDELS reveals a deficiency of galaxies at the massive end at (Grazian et al., 2015), suggesting that even the deepest near-infrared-selected sample misses some massive (dusty) galaxies. Understanding the selection bias of different samples and studying star formation in more complete massive-galaxy populations at are key to mapping the full cosmic star formation history as well as understanding the very early phases of massive galaxy formation.
In the last decade, a variety of massive, non-UV-selected galaxy populations have been revealed and spectroscopically confirmed at , e.g., high-redshift submillimeter galaxies (Dunlop et al., 2004; Chapman et al., 2005; Younger et al., 2007; Daddi et al., 2009; Riechers et al., 2010; Capak et al., 2011; Vieira et al., 2013; Huang et al., 2014), quasars (Wang et al., 2013; Wagg et al., 2014), radio galaxies (Seymour et al., 2007), and red SPIRE sources (Casey et al., 2012; Riechers et al., 2013). These galaxy populations usually exhibit enormous star formation rates but low space densities ( Mpc-3) and are unlikely to represent the major population of massive galaxies. On the other hand, recent observations reveal massive galaxies already formed and quenched at with space densities of Mpc-3 (Daddi et al., 2004; Fontana et al., 2009; Brammer et al., 2011; Muzzin et al., 2013; Ilbert et al., 2013; van der Wel et al., 2014). This requires the existence of a significant population of massive (star-forming) galaxies at , as also predicted in cosmological simulations (see., e.g., Dekel & Mandelker, 2014; Zolotov et al., 2015; Feldmann & Mayer, 2015). However, an efficient way to identify the bulk population of massive galaxies is still lacking.
One of the most efficient ways of selecting massive galaxies is color selection, a method that relies on the strong spectral breaks prevalent in massive galaxies. This technique allows a rather clean selection of galaxies at certain redshifts and enables fair comparisons between different studies. A number of color-selection methods have been proposed to select galaxies, making use of either the Balmer break (Nayyeri et al., 2014) or the 1.6 m stellar bump (Mancini et al., 2009) as redshift indicators. One concern of these selection methods is contamination from dusty galaxies and AGNs at lower redshifts (): extremely dusty galaxies or AGNs at lower redshifts present similarly red colors (due to attenuation or intrinsic red SEDs ) which mimic those of the massive galaxies at high redshift (due to Balmer or the 1.6 m break). This is similar to what we have learned from color-selection techniques at , e.g., Distant Red Galaxies (Franx et al., 2003), IRAC-selected Extremely Red Objects (Yan et al., 2004; Wang et al., 2012), and and IRAC-selected Extremely Red Objects (Wang et al. 2012). How to separate true high-redshift () from these low-redshift contaminants remains a challenge for color-selection techniques. In practice, to recover the bulk populations with color-selection techniques, we need a large range of NIR to mid-infrared (MIR) colors. This requires deep NIR and MIR imaging, which has now become available thanks to the recently completed Cosmic Assembly Near-infrared Deep Extragalactic Legacy Survey (CANDELS; Koekemoer et al. 2011; Grogin et al. 2011), the Spitzer Extended Deep Survey (SEDS; Ashby et al. 2013) and the S-CANDELS survey (Ashby et al., 2015).
A number of recent studies attempt to provide mass-selected samples of galaxies at based on photometric redshifts (see, e.g., Fontana et al., 2006; Pérez-González et al., 2008; Spitler et al., 2014; Straatman et al., 2014; Marchesini et al., 2014; Pannella et al., 2015; Schreiber et al., 2015). However, the quality of photometric redshifts of galaxies at is quite uncertain due to the lack of large training samples with spectroscopic redshifts. Although photometric redshifts are believed to be more reliable in deep fields, e.g., in the HUDF and GOODS fields, massive galaxies are rare, and larger fields are needed to obtain statistically significant results. In this case, color selection that requires only a few bands with high-quality photometry has the advantage of efficiently identifying large samples of certain populations of galaxies. Most existing studies are based on near-infrared-selected samples, mostly band, which probes the rest-frame UV. As a consequence, they may miss some of the most massive and/or dustiest galaxies, as illustrated by Huang et al. (2011) (see also, e.g., Caputi et al., 2012), who reported a sample of galaxies that are bright in the IRAC bands yet undetected in deep HST /WFC3 -band, i.e., -dropouts. Photometric redshifts indicate that these galaxies are likely massive and dusty galaxies. Similarly, Wang et al. (2012) identified a population of massive galaxies that are bright in IRAC but not detected in the -band. These are believed to be massive and dusty galaxies at high redshift. Determining the number density and star formation properties of these galaxies is essential to obtain a complete view of both galaxy stellar mass functions and cosmic star formation rate densities at high redshifts.
This paper presents a new color selection of Extremely Red Objects with and IRAC colors (HIEROs, ). This color-selection technique is designed to select massive galaxies at that are systematically missed by the Lyman-break selection technique. We further show that combining colors breaks the degeneracy between redshift and attenuation and enables a clean selection of galaxies. We use the deep HST /WFC3 -band imaging from CANDELS and IRAC imaging from the SEDS survey and select both -detected and -dropout HIEROs. Utilizing the exquisite multi-wavelength dataset in the GOODS fields, we explore both their star formation and structural properties.
This paper is organized as follows. We describe the data and the selection of HIEROs in Section 2. Photometric redshift and stellar population analysis are presented in Sections 3 and 4, respectively. Section 5 explores star formation properties and Section 6 structural properties of HIEROs. Section 7 discusses the completeness of the HIERO criteria in selecting massive galaxies, and Section 8 summarizes. Throughout the paper, we assume cosmological parameters of = 70 km s-1 Mpc-1, = 0.3, and = 0.7. All magnitudes are in the AB system, where an AB magnitude is defined as .
2. Multi-Wavelength Data sets and sample selection
| RA111Positions are from the IRAC 3.6 and 4.5 m selected catalogs based on the SEDS survey (Ashby et al., 2013) | Dec | F160W | 3.6 m | 4.5 m | 5.8 m | 8.0 m | Notes222have X-ray or 24 m counterparts within 2″ after crossmatching with X-ray and 24 m catalogs. These galaxies are most likely AGNs if they are indeed at . But also we note that their photometric redshifts estimate with FAST is less reliable. | ||
| J2000 | [Jy] | [Jy] | [Jy] | [Jy] | [Jy] | [Jy] | |||
| GOODS-South | |||||||||
| 53.19988 | -27.90455 | 0.320.03 | 0.850.06 | 3.560.42 | 5.500.53 | 8.550.56 | 11.850.65 | 4.78 | 24 m |
| 53.12757 | -27.70675 | 0.310.02 | 0.930.06 | 2.830.36 | 3.840.41 | 4.870.52 | 6.070.58 | 4.62 | – |
| 53.04768 | -27.86865 | 0.260.04 | 0.390.14 | 1.560.23 | 1.960.27 | 3.541.02 | 3.221.07 | 5.17 | – |
| 53.08476 | -27.70800 | 0.050.02 | 0.150.06 | 1.240.20 | 2.250.29 | 3.270.56 | 4.240.58 | 5.26 | X-ray |
| 53.11912 | -27.81396 | 0.120.01 | 0.460.04 | 1.180.19 | 1.570.22 | 1.970.34 | 3.080.36 | 4.16 | – |
| 53.06091 | -27.71833 | 0.260.02 | 0.480.06 | 1.040.16 | 1.470.20 | 1.020.69 | 2.400.67 | 3.19 | – |
| 53.13463 | -27.90748 | 0.040.03 | 0.420.06 | 1.640.23 | 1.720.24 | 3.140.58 | 5.880.70 | 4.16 | – |
| 53.19654 | -27.75699 | 0.130.02 | 0.620.05 | 0.910.15 | 1.360.20 | 3.240.44 | 2.630.52 | 3.96 | – |
| 53.13270 | -27.72021 | 0.090.02 | 0.290.06 | 1.030.16 | 1.330.20 | 0.680.84 | 2.400.65 | 4.68 | – |
| 53.02079 | -27.69903 | 0.050.03 | 0.170.50 | 0.790.14 | 1.190.18 | 0.000.02 | 2.320.65 | 4.58 | – |
| GOODS-North | |||||||||
| 189.30783 | 62.30737 | 0.240.02 | 1.030.26 | 3.600.46 | 6.030.58 | 8.740.47 | 15.590.54 | 3.99 | 24 m,X-ray |
| 189.18352 | 62.32741 | 0.250.01 | – | 2.680.37 | 4.370.47 | 4.760.75 | 9.670.66 | 7.00 | 24 m |
| 189.42834 | 62.26596 | 0.100.03 | 0.460.19 | 1.270.22 | 1.220.18 | 2.030.62 | 5.140.55 | 7.00 | 24 m |
| 189.25689 | 62.25028 | 0.220.01 | 0.230.16 | 1.130.19 | 1.140.18 | 1.240.47 | 2.500.46 | 6.95 | – |
| 189.39476 | 62.31691 | 0.170.02 | 0.260.17 | 1.050.18 | 1.200.19 | 1.860.48 | 2.850.60 | 6.92 | – |
| 189.02396 | 62.22296 | 0.020.05 | 0.200.16 | 0.950.17 | 1.280.20 | 1.590.52 | 2.570.63 | 4.54 | – |
2.1. A combined F160W and IRAC 4.5m-selected catalog
The GOODS-South and GOODS-North fields have been the target of some of the deepest surveys ever conducted over a broad wavelength range by space observatories and the foremost ground-based telescopes. In particular, the new HST/WFC3 near-infrared survey from CANDELS and the Spitzer/IRAC mid-infrared survey from SEDS have significantly improved measurements of galaxy properties at . Here we utilize the UV to mid-infrared multi-wavelength catalogs based on detections in the /WFC3 F160W band from CANDELS for both GOODS-South and GOODS-North as described by Guo et al. (2013) and Barro et al. (in preparation), respectively. Both fields include deep photometry in the F435W, F606W, F775W, F814W, F850LP, F105W, F125W, F140W, and F160W bands from and 3.6, 4.5, 5.8, and 8.0 m bands from Spitzer/IRAC (Ashby et al., 2013). The GOODS-South catalog also includes photometry in the -band from both CTIO/MOSAIC and VLT/VIMOS and -band imaging from the Infrared Spectrometer and Array Camera (ISAAC) and the High Acuity Wide field K-band Imager (HAWK-I) on the VLT (HUGS survey, Fontana et al., 2014). Similarly, the GOODS-North catalog includes photometry in the -band from both KPNO and LBT and -band imaging from both the Multi-Object Infrared Camera and Spectrograph (MOIRCS) and CFHT. Both fields reach 5 depth of mag and are 80% complete down to .
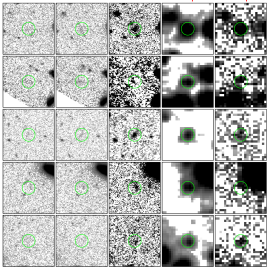
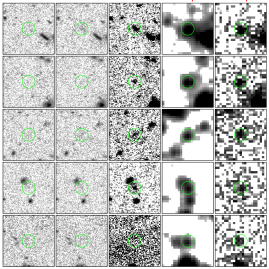
We also performed a systematic search for objects that are bright in the IRAC bands but are missed in the -selected catalog, i.e., -dropouts. We crossmatched the CANDELS -selected catalog with an IRAC 3.6 and 4.5 m selected catalog (Ashby et al., 2013) from the SEDS survey. The SEDS survey covers the two GOODS fields to a depth of 26 AB mag (3) at both 3.6 and 4.5 m and is 80% complete down to [4.5] 24 mag. We first matched sources with mag in the SEDS catalog to the -selected catalog and identified those without -band counterparts within a 2″ radius. This 4.5 m magnitude cut was applied to enable sufficient color range to identify extremely red objects and also give a complete 4.5 m-selected sample. We then visually inspected the IRAC images and excluded sources whose flux is likely contaminated by bright neighbors as well as those falling on the edge of the F160W image. We dubbed this catalog of IRAC sources with no -band counterparts the “H-dropout” catalog. Figure 1 shows examples of -dropouts identified in GOODS-South. With knowledge of their positions, some of these -dropouts are marginally detected in the band but exhibit extended profiles and are unidentifiable as real sources without that prior knowledge. We measured aperture magnitudes in and -bands with a 1″ radius aperture at the position of their IRAC 3.6 and 4.5 m counterparts, and then applied an aperture correction to get the total flux. For IRAC 5.8 and 8.0 m bands, we used a 1.2 ″radius aperture plus aperture correction, the same as that used for IRAC 3.6 and 4.5 m bands (directly taken from Ashby et al. (2013)). Their measured flux densities across /WFC3 to IRAC bands are listed in Table 1.
The combined F160W and IRAC 4.5 m-selected catalog is not only complete to [4.5] = 24 mag but also ensures that all the -dropouts have . As shown by Guo et al. (2013), the agreement of the IRAC 4.5 m photometry between the CANDELS F160W-selected catalog and the SEDS 3.6 m and 4.5 m selected catalog is excellent for objects with mag. The magnitude cut of our selection, [4.5] = 24, is much brighter than the detection limit in the SEDS survey, and therefore Eddington bias is also negligible (Guo et al., 2013).
We searched for infrared and X-ray counterparts within a 2″ radius for all the sources in both the -selected and -dropout catalogs based on their -band or IRAC positions. For infrared counterparts, we employed the MIPS 24 m-selected catalog of Magnelli et al. (2013), which also includes 100 m and 160 m photometry from the combination of PACS Evolutionary Probe (PEP; Lutz et al. 2011) and GOODS- (Elbaz et al., 2011) key programs. For X-ray counterparts, we used the 4 Ms catalog (Xue et al., 2011) for GOODS-South and the 2 Ms catalog (Alexander et al., 2003) for GOODS-North.
2.2. Selection of massive galaxies
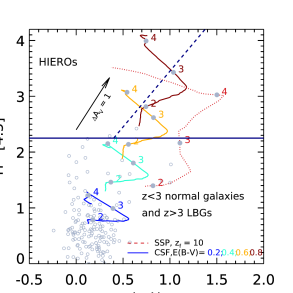
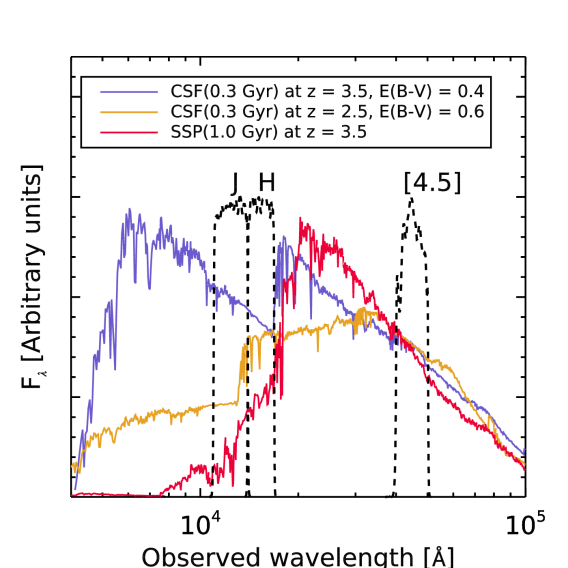
At , the Balmer/4000 Å break shifts redward of the band while the 4.5 m band probes the rest-frame band. Thus both quiescent galaxies with strong Balmer/4000 Å breaks and dusty galaxies with significant UV attenuation appear red in . Figure 2 plots the evolution of as a function of redshift for different sets of templates. These templates are based on BC03 models, including a non-evolving constant star formation (CSF) model computed for an age of 300 Myr and various levels of reddening (using the Calzetti et al. (2000) extinction law and solar metallicity). This figure illustrates that an color cut can effectively select old or dusty galaxies at . On the other hand, most commonly used LBG selection techniques (e.g., Bouwens et al., 2012) are designed specifically to select young and less attenuated galaxies, with UV slope or equivalently for a young star-forming galaxy. Therefore, the proposed red galaxy selection is complementary to the LBG selection and is crucial for a complete census of galaxy populations at . As a further illustration of this point from Figure 2, almost none of the spectroscopically confirmed galaxies (mostly LBGs) have . In the following sections, we refer to galaxies with as HIEROs.
Figure 2 also reveals that while passive or dusty galaxies at are expected to be identified as HIEROs, extremely dust-obscured galaxies () at could also enter the HIERO selection. This is similar to other red galaxy selection technique at lower redshifts. For instance, Wuyts et al. (2009) found that 15% of their distant red galaxy (DRGs, Franx et al. 2003) sample, which is intended to select galaxies at , have spectroscopic redshifts (also see, e.g., Grazian et al., 2007). These low-redshift DRGs are on average more obscured with higher by 1.2 mag than the high-redshift DRGs. The situation is expected to be more serious in selecting galaxies at due to the prevalence of dusty galaxies at (see, e.g., Yan et al., 2007; Dey et al., 2008; Huang et al., 2009).
| Sample | Number | Number | Number | Number | Number | Number |
|---|---|---|---|---|---|---|
| (-detected) | (-detected, clean333see Section 3.2.) | (-dropouts) | (final sample) | ( Jy) | (X-ray444detected at 0.5–8 keV) | |
| 243 | 206 | – | 206 | 123 | 39 | |
| 116 | 61 | 18 | 79 | 18 | 14 | |
| All | 359 | 267 | 18 | 285 | 141 | 53 |
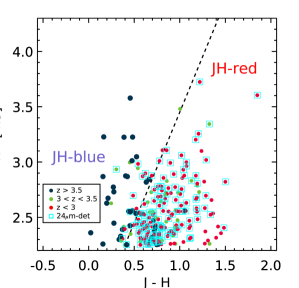
To enable a cleaner selection of galaxies, we use an additional color to separate galaxies from low-redshift contaminants, following the color track of theoretical templates. As shown in Figure 3, although a heavily attenuated galaxy () at could have a similar color as normal massive star-forming galaxies at , the Balmer/4000 Å break falling between the and bands at –3 leads to a much redder (and also ) color than for galaxies at . Similarly, passive galaxies at also have redder colors due to much redder rest UV slopes than star-forming galaxies. Therefore, an additional color criterion separates these different populations and approaches a pure selection of massive (star-forming) galaxies. Based on the color tracks of theoretical models and the photometric redshifts of HIEROs (details of photometric redshift determinations are discussed in Section 3), we separate star-forming galaxies ( HIEROs) from contaminants ( HIEROs) as:
| (1) | ||||
| (2) |
Because both and are poorly constrained for -dropouts, we classify all the -dropouts as HIEROs (the redder color of -dropouts suggests that they are in general at higher redshift). In total, we identify 359 HIEROs (116 and 243 ) in the two GOODS fields, 18 of which are -dropouts. After examining the reliability of the color measurements of independent sources with an approach described in Section 3.2, our final sample includes 285 (80% of the original sample) HIEROs. We list respective fractions of the two categories of HIEROs in Table 2.
Caputi et al. (2012) studied a sample of extremely red galaxies with in UDS. Only 15 galaxies in our sample present such extremely red colors. While nearly all of these 15 galaxies have , the majority of the massive galaxies will be missed by this extreme criterion. (A more extreme color cut leads to fewer contaminants at lower redshifts but also to a lower completeness in selecting high-redshift galaxies.) Similarly, Wang et al. (2012) studied a sample of - and IRAC-selected extremely red objects (KIEROs, ) in GOODS-North, aiming to identify specifically dusty galaxies at . They showed that the majority of KIEROs are at –3.5. 46% of our HIERO sample satisfy the color criterion of KIEROs. Compared to both previous studies, the advantage of our color selection is a more complete sample of massive (including both passive and star-forming) galaxies at because our selection was specifically designed to complement the LBG selection. This allows us to perform a complete census of massive galaxy evolution at . Moreover, with the proposed and diagram, we are able to distinguish high-redshift galaxies from low-redshift contaminants, enabling a much cleaner (and also complete) selection of massive galaxies compared to previous studies.
3. Redshifts of HIEROs
3.1. Photometric Redshifts
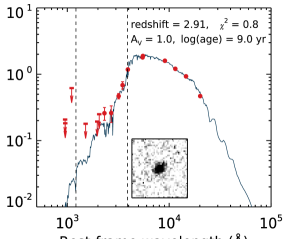
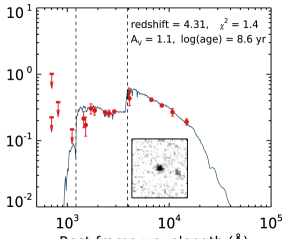
The HIEROs are extremely faint at observed UV and visible wavelengths. Even though the GOODS fields have been extensively covered by spectroscopic observations, only 11 HIEROs have spectroscopic redshifts (Kajisawa et al., 2010; Dahlen et al., 2013; Hsu et al., 2014, and references therein). Therefore we use photometric redshifts to gain insight into their nature. The unique features of these galaxies, e.g., many of them are consistent with being extremely dusty with exceeding , lead to concerns that they may be not represented in the templates used by most photometric redshift methods. Hence we used galaxy templates spanning a larger parameter space particularly a larger range of to determine their photometric redshifts. To this aim, we employed FAST (Kriek et al., 2009) to fit the full -band to 8.0 m photometry for all galaxies in the HIERO sample. FAST also provides self-consistent estimates of stellar masses. We constructed stellar templates from the Bruzual & Charlot (2003) (BC03, hereafter) stellar population synthesis model with a Chabrier (2003) initial mass function and solar metallicity, assuming exponentially declining star-formation histories (SFHs) with -folding times –10 Gyr. We allowed the galaxies to be attenuated with mag with reddening following the Calzetti et al. (2000) law. To avoid strong influence on the fitting from one single band (in some cases due to an emission line or bad photometry), we restricted the maximum in the photometry to be 20. Examples of the fitting are shown in Figure 4.
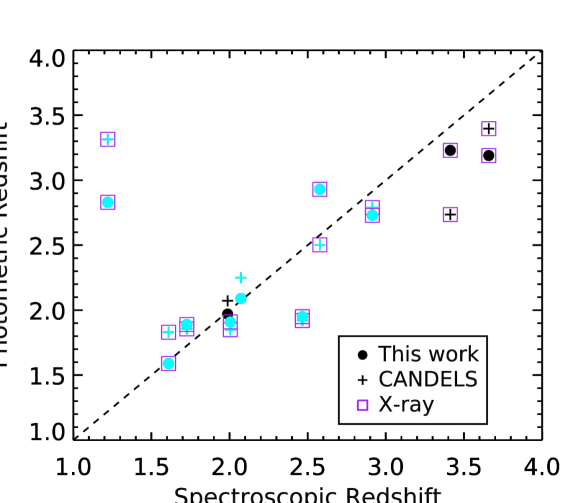
For the few galaxies with spectroscopic redshifts in our sample, Figure 5 shows the comparison between spectroscopic and photometric redshifts. Our photometric redshift estimates in general agree with spectroscopic redshifts with the normalized median absolute deviation (Brammer et al., 2008) . (The significant outlier at is a type-1 AGN.) However, the spectroscopic sample is significantly biased with 9 of 11 objects detected in X-rays and a median -band magnitude (compared to for the total sample). Hence, larger and deeper spectroscopic samples are needed to verify the accuracy of the photometric redshifts. On the other hand, based on photometric redshifts estimates from CANDELS (see e.g., Dahlen et al., 2013), we derive . Specifically for HIEROs at , the photometric redshifts from CANDELS are systematically higher by –0.3, likely due to the absence of highly attenuated galaxy templates in the CANDELS photometric redshift codes, (favoring a high redshift solution to account for the red color actually due to attenuation). This trend is also confirmed based on the photometric comparisons between ours and from CANDELS for the whole HIERO sample.
3.2. Identifying sources with unreliable IRAC photometry
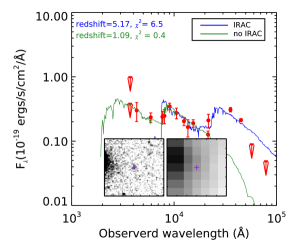
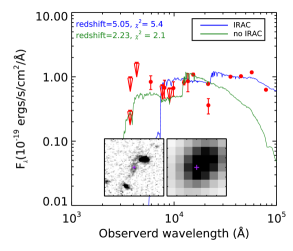
While the majority of HIEROs yield a good fit, a substantial number of galaxies can not be well fitted with FAST and the BC03 models. We checked in detail their SEDs and F160W and IRAC images and found that most of them have bright stars or galaxies within a few arcseconds, hence their photometry is likely unreliable. This is particularly a problem in the IRAC bands due to their larger PSFs. To explore whether this is the origin of the problem, we re-fit the SEDs with the same set of templates but excluding the IRAC photometry. A better fit (much smaller ) was achieved for many sources with a significantly different redshift solution. Figure 6 presents two such examples. This illustrates that indeed the IRAC photometry for these sources is problematic (in most cases boosted) due to contamination by close neighbors. As a result, the true color of these sources is likely much bluer (as can also be seen from their best-fitted SED in the second fit).
Although in principle we can simply reject all sources with a bad fit in the first run to clean our sample, it will introduce a bias towards the choice of SED-fitting methods and templates, i.e., some sources with a bad fit may be due to the wrong templates instead of bad photometry. To be conservative, we borrow the “clean index” concept in dealing with the source confusion at far-infrared wavelengths (Elbaz et al., 2011) to identify sources whose IRAC fluxes are reliable. We define a source as “clean” only if it satisfies at least one of the following two criteria: (a) it has no neighbor within 2 (rougly the size of the FWHM of the IRAC PSF) and a good SED(photometric redshift)-fitting result (, corresponding roughly to the one-tailed (right-tail) probability 0.95) when including IRAC photometry; (b) similar redshift solutions are achieved during the two SED-fitting runs, i.e., (For sources that only satisfy the second criterion, it is unclear whether their IRAC photometry is contaminated or not: the bad fit could be because there are no perfect templates in the library or because the data quality is not good enough.) This leaves us 285 clean HIEROs including the 18 -dropouts (Table 2). Among these 285 HIEROs, 223 of them (78%) have a good fit with when including the IRAC photometry.
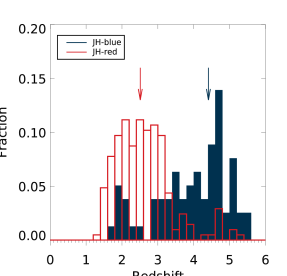
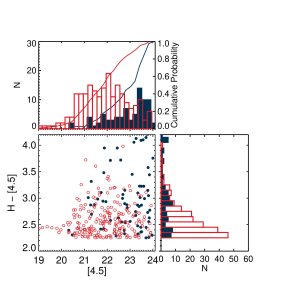
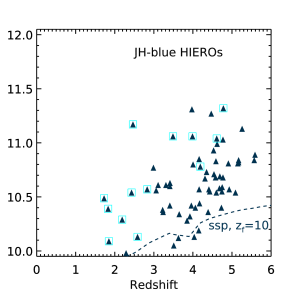
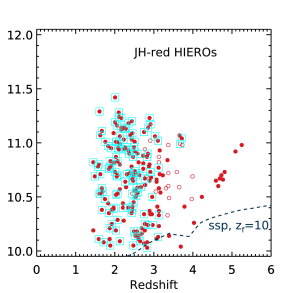
Figure 7 shows the photometric redshift distribution for the final clean samples. Our classification based on and colors successfully separates galaxies at from those at relatively lower redshifts, i.e., . The median redshifts for and HIEROs are and , respectively. Among the 79 HIEROs, only 14 (18%) have photometric redshifts . Most of these 14 are detected at MIPS 24 m, in contrast to the HIEROs. On the other hand, 52 out of 206 (28%) of HIEROs are at with the majority (30 out of 52) being at . Figure 7 also compares the distribution of the two populations of HIEROs in the versus color-magnitude diagram. As expected, the HIEROs are in general fainter at 4.5 m as well as redder in .
4. Stellar populations of HIEROs
4.1. HIEROs: Normal massive star-forming galaxies at
Our analysis on photometric redshifts (both from our own estimates based on FAST and those from CANDELS) confirms that the selection criterion of HIEROs yields a clean selection of galaxies. Remaining low-redshift contaminants can be removed based on SED modeling or on their strong 24 m detections (with a median Jy). The F160W images of these contaminants show that most of them are either extremely faint or likely mergers, leading to uncertain colors or unusual extinction properties, which explains why they enter our selection.
The advantage of using FAST to derive photometric redshifts is that it also gives self-consistent estimates of stellar masses. Figure 8 shows the stellar mass estimates of HIEROs. The modeling assumptions are described in Section 3, i.e., the BC03 stellar library, Calzetti et al. (2000) extinction law with , and exponentially declining star formation histories (single model) with -folding times ranging from 0.1 to 10 Gyr. Delayed models give nearly identical estimates of stellar masses. Our mass estimates imply that the HIEROs are massive star-forming galaxies at with a median .
The best-fit ages for HIEROs from single models range from to = 1.6 Gyr with a median Gyr for galaxies at and Gyr for galaxies a . The median attenuation is , with galaxies at much dustier than those at ( vs. ). These best-fit stellar properties do not change significantly by using delayed models. These results suggest that most HIEROs are massive, dusty star-forming galaxies which have already assembled relatively old stellar populations. Their red colors thus appear to be caused by a combination of moderately old stellar populations (strong 4000 Å break) and dust attenuation. The few contaminants tend to be less massive, younger, and also much dustier, suggesting that the red colors are mostly caused by severe dust attenuation.
4.2. HIEROs: Massive dusty star-forming galaxies at and passive galaxies at
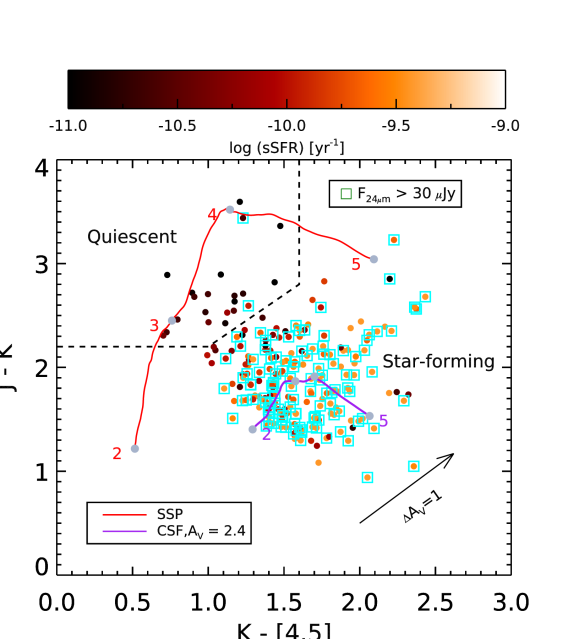
As discussed in Section 2.2 and Section 3, HIEROs include in general two populations, –3 dusty star-forming galaxies and passive galaxies at –4. As illustrated in Figure 3, it is possible to distinguish between the two populations based on their different behaviors in the observed near-infrared to mid-infrared colors. Here we propose to separate the two populations with the observed versus color-color diagram, which for resembles the rest-frame versus diagram (Williams et al., 2009). Figure 9 shows the distribution of HIEROs in this diagram. Galaxies with lower sSFR (from SED fitting) populate the upper left region while galaxies with higher sSFR locate in the lower right region. As independent evidence, most 24 m detections fall in the star-forming region, consistent with star-forming galaxies at . Based on the distribution of galaxies with different sSFRs and the direction of reddening from the Calzetti et al. (2000) law, we define the criteria for quiescent galaxies as : , , and . The remaining galaxies are classified as star-forming. This diagram is not only limited to classifications of HIEROs but also provides an efficient way to identify quiescent galaxies at in general.
As shown in Figure 9, roughly 10% (21 out of 206) of the HIEROs are classified as quiescent galaxies. The median redshift of these is , suggesting that they are among the earliest quenched systems in the Universe. Among these 21 quiescent HIEROs, 15 are at out of 52 HIEROs altogether.
The HIEROs are also primarily massive galaxies (the right panel of Figure 8) with a for both quiescent and star-forming subpopulations. The median best-fit age and attenuation for quiescent galaxies are Gyr and while for star-forming galaxies Gyr and , respectively. These results are consistent with the classifications based on the observed versus diagram. The high attenuation value for star-forming galaxies in this HIERO population is also consistent with their high 24 m flux densities with Jy, which corresponds roughly to a total infrared luminosity at .
Based on X-ray luminosity estimates, of HIEROs are classified as X-ray AGNs ( erg s-1), consistent with the X-ray AGN fraction in massive galaxies at (Wang et al. 2015, submitted). The HIEROs have similar AGN fraction, . These results indicate that our selection criteria are not particularly biased towards AGNs compared to non-AGN massive galaxies.
| Sample | 16 m | 24 m | 70 m | 100 m | 160 m | 250 m | 350 m | 500 m | 870 m | 1.1 mm |
|---|---|---|---|---|---|---|---|---|---|---|
| [Jy] | [Jy] | [Jy] | [mJy] | [mJy] | [mJy] | [mJy] | [mJy] | [mJy] | [mJy] | |
| HIEROs | 5.83.7 | 14.63.8 | 184260 | 0.220.05 | 0.900.20 | 3.090.54 | 3.670.83 | 4.600.62 | 1.150.19 | 0.920.22 |
| HIEROs(SF) | 28.65.9 | 74.47.4 | 177.727.2 | 0.630.04 | 2.010.16 | 6.210.55 | 7.220.64 | 5.610.49 | 1.090.14 | 0.720.15 |
| HIEROs(QS) | 5.75.6 | 6.33.4 | 84.340 | 0.10.05 | 0.20.1 | 0.30.3 | 0.30.5 | 20.7 | -0.060.1 | -0.40.1 |
5. Star formation properties of HIEROs
5.1. UV properties
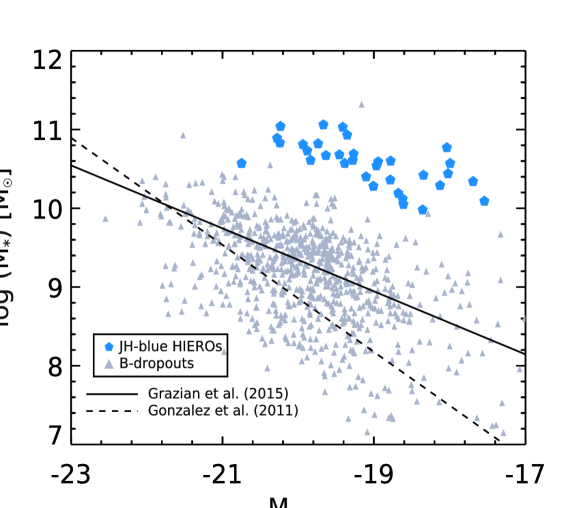
By selection, the HIEROs are faint in their rest-frame UV despite their high stellar masses. Specifically, the HIEROs are generally massive star-forming galaxies at . Previous studies of LBGs at these redshifts reveal a tight correlation between stellar mass and UV luminosity (see, e.g., González et al., 2011). This allows the UV luminosity function to translate directly to the stellar mass function, as is commonly adopted in studying high-redshift stellar mass functions. It is therefore interesting to compare HIERO and LBG stellar masses at similar redshifts and UV luminosities to explore how the HIEROs affect the stellar mass estimate.
We selected a sample of LBGs (-dropouts) that are on average at similar redshifts as the HIERO population in the two GOODS fields using the same criteria as Bouwens et al. (2012). The rest-frame UV luminosities () were derived using (Brammer et al., 2008) at fixed redshifts from CANDELS. Figure 10 compares the – relations. (The HIERO rest-frame UV luminosities came from the best-fit SED templates at fixed redshifts estimated by FAST.) Compared to LBGs at similar masses, the HIEROs are generally 2–3 magnitudes fainter in the rest-frame UV. The existence of these galaxies suggests that using a simple – relation (or using only UV-selected samples) to determine the stellar mass function underestimates the massive end. We will illustrate this point further in Section 7.
| Number | log | log () | UV slope () | SFR | sSFR | ||
|---|---|---|---|---|---|---|---|
| [arcmin-2] | [median] | [mean, ] | [] | [ yr-1] | [Gyr-1] | ||
| HIEROs | |||||||
| 66 | 0.2 | 4.43 | 10.78 | 12.38 | -0.05 | 240 | 4.2 |
| HIEROs (SF) | |||||||
| 185 | 0.54 | 2.51 | 10.77 | 12.10 | 1.12 | 120 | 1.9 |
| HIEROs (QS) | |||||||
| 21 | 0.06 | 3.42 | 10.7 | – |
5.2. Determining total infrared luminosities of HIEROs through stacking
The general faintness of HIEROs in the UV suggests that most of their star formation is hidden by dust. The amount of this hidden star formation can be inferred through infrared emission, which originates from the thermal reradiation by dust of their absorbed ultraviolet light. Therefore, understanding the Spectral Energy Distributions (SEDs) in the infrared is essential to get a complete view of star formation in HIEROs. Alternatively, we could use dust-unbiased tracers of star formation, e.g., radio continuum, to measure the total star formation rate. However, although both the far-infrared and radio surveys in the GOODS fields are among the deepest ever conducted, only a few HIEROs are individually detected. Moreover, most of the detected ones are HIEROs. For instance, crossmatching with the VLA 1.4 GHz catalog in GOODS-North (Morrison et al., 2010), 33 out of 142 HIEROs are detected at 1.4 GHz with uJy, but only 6 out of 33 are classified as HIEROs. This is likely caused by the high redshifts of the HIERO population and that most of them are not extreme starbursts (contrary to bright submillimeter galaxies). To probe lower star formation rates that are typical of HIEROs, a stacking approach is required.
For the HIERO population, we excluded contaminants at low redshifts by applying a redshift cut of , which leaves us 66 galaxies. For the HIERO population, we separately stacked star-forming (SF) and quiescent (QS) galaxies. The exquisite multi-wavelength data in GOODS allow us to perform stacking across the whole infrared wavelength range, including the 16 and 24 m bands from Spitzer, 100, 160, 250, 350 and 500 m from Herschel, 850 m from SCUBA, 870 m from LABOCA, and 1.1 mm from AzTEC. This permits a comprehensive understanding of their infrared SEDs. Moreover, the combination of stacked far-infrared and submillimeter colors provides an independent and complementary estimate of their redshift from the position of their peak far-infrared emission (Hughes et al., 2002; Daddi et al., 2009).
To avoid contamination from a few relatively bright members, we conducted a median stacking in the infrared and submillimeter bands (16 µm–1.1 mm) using the IAS stacking code library (Béthermin et al., 2010). (Using mean stacking would leave the main results unchanged, likely because the fraction of bright members is small.) We retrieved flux densities by PSF-fitting the stacked images. A correction factor ranging from 0.92 at 250 to 0.75 at 500 was applied to account for clustering, which does not change much with redshift and stellar mass of the galaxies (Béthermin et al., 2012; Schreiber et al., 2015). We determine uncertainties on the flux densities with bootstrapping.
The stacked flux densities for all populations are listed in Table 3. For HIEROs, significant detections are revealed except at 16 and 70 µm due to shallower depths. For SF HIEROs, significant detections are found at all wavelengths while there are no detections with in any infrared bands for QS HIEROs. This provides independent evidence that our approach successfully separates the QS and SF populations. Moreover, the peak of the infrared SED for and SF HIEROs falls respectively at µm and 350 µm, lending evidence that they are most likely at and , consistent with our photometric redshifts.
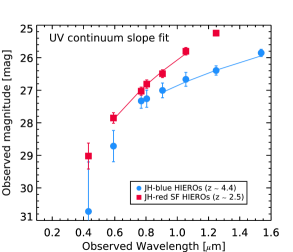
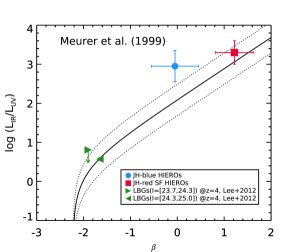
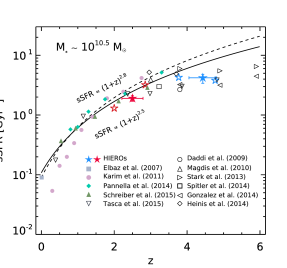
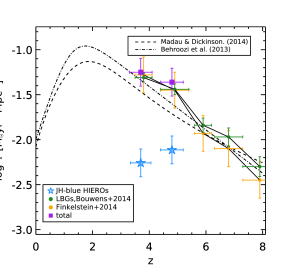
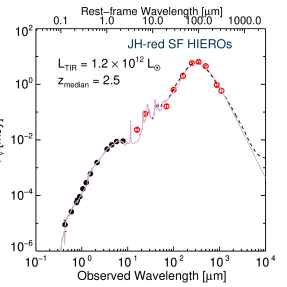
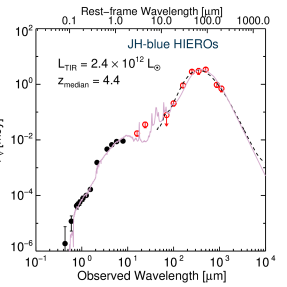
Figure 11 shows the median SEDs of the two populations of HIEROs. With the well-constrained SED shape, their total infrared luminosities (TIR) constrain their star formation rates. We fit the stacked 160 m1.1 mm (to avoid rest-frame µm wavelengths, which may suffer from AGN contamination) SEDs using a suite of infrared templates, including the 105 template SEDs from Chary & Elbaz (2001) (CE01, hereafter). During the fitting, we fixed the redshift at the median value of the sample and left the template normalizations as free parameters. The best-fit model is the template that minimizes . The total infrared luminosity for and HIEROs are and , respectively. We also fit the full-band SED from UV to far-IR for HIEROs using the code CIGALE (Noll et al., 2009; Serra et al., 2011) using BC03 models in the UV-to-NIR and Draine & Li (2007) models in the infrared. This gives a consistent measurement of as shown in Figure 11.
To derive realistic uncertainties on star formation rates and specific star formation rates, we bootstraped galaxies simultaneously in all the infrared bands, i.e., bootstrapping SEDs. Each time we randomly selected a subsample of the galaxies, performed median stacking in all the bands, and determined the SFR and sSFRs from the TIR and median stellar mass of the subsample. We repeated this process 50 times and determined the dispersion of SFR and sSFR. This method avoids the drawback that the uncertainties in different bands as derived from bootstrapping galaxies in a single band are likely correlated, e.g., galaxies that are fainter in the shorter wavelength may tend to be brighter in the larger wavelength due to the variations in dust temperature and/or redshifts.
5.3. Dust attenuation of HIEROs
A tight correlation between and UV continuum slope exists for UV-selected L∗ star-forming galaxies in the local universe and up to (Meurer et al., 1999; Kong et al., 2004; Reddy et al., 2012). At higher redshifts, it becomes more difficult to directly measure both and . Based on infrared stacking analysis, Lee et al. (2012) derived IR luminosities for a statistical sample of , LBGs and showed that they are consistent with the IRX– relation presented by Meurer et al. (1999). For HIEROs, because most of them are relatively faint in the rest-frame UV, we first performed a median stacking across the observed-frame HST/ACS F435W to HST/WFC3 F160W bands for HIEROs and HIEROs, respectively, and then measured their flux densities based on the stacked images. We then used the measurements for rest-frame 1400–2800 Å to derive . This process is illustrated in Figure 12. The strong break between observed-frame -, -, and -band for HIEROs provides additional independent evidence that most HIEROs should be at similar redshifts as -dropouts and -dropouts, i.e., –5.
The right panel of Figure 12 compares the relation between and for both HIEROs and LBGs. The HIEROs have significantly redder UV slopes () than the brightest/most massive LBGs () at similar redshifts. On the other hand, the effective dust attenuation, , is extremely high for HIEROs, reaching 1000 for both HIEROs and HIEROs. The HIEROs fall on the Meurer relation within uncertainties while HIEROs tend to be above the Meurer relation, which is consistent with the results on a -selected massive galaxy sample at by Pannella et al. (2015). This is at odds with recent findings on UV-selected samples at , which are systematically below the Meurer relation (Capak et al., 2015). This may be caused by UV selection tending to select less massive and less dusty galaxies, leading to a biased view of galaxy populations at high redshift.
5.4. Star formation rates of HIEROs
Using a Kennicutt (1998) conversion of SFR [ yr-1] = (Chabrier (2003) IMF), the SFR for and HIEROs are 120 yr-1 and 240 yr-1, respectively. These and other properties are listed in Table 4. Figure 13 shows the sSFR for and SF HIEROs. The sSFR for HIEROs, 4.2 Gyr-1, is twice as high as that for similarly massive galaxies at (Schreiber et al., 2015). This suggests that the sSFR of massive galaxies continues to increase at and up to . However, the growth rate at is slower than that at –2. For instance, Sargent et al. (2014) found that the evolution of sSFR at roughly follows , which predicts sSFR Gyr-1, much higher than we observed here at . Based on simple analytic arguments on the accretion rates into halos and the accretion of baryons into galaxies, Dekel & Mandelker (2014) showed the evolution of sSFR for typical galaxies should follow , which also predicts a higher sSFR at than observed for HIEROs. Several recent studies report similar slow evolution of sSFR at but for less massive or for UV-selected galaxies (e.g., González et al., 2014; Tasca et al., 2015). Our finding suggests that the slow evolution of sSFR at (or the fast evolution of sSFR at ) is likely a universal behavior for all masses of galaxies.
Most previous studies on the cosmic star formation rate densities at contain only contributions from LBGs. The cosmic SFRD contributed by HIEROs needs to be added to have a complete view of cosmic SFR densities at high redshift. Using a total area of 340 arcmin2 and assuming that individual HIEROs have the same sSFR as derived from stacking, the total SFRD contributed by HIEROs is yr-1 Mpc-3 at and yr-1 Mpc-3 at . By comparison, recent studies showed that the total SFRD of LBGs is 0.049 and 0.036 yr-1 Mpc-3 at and , respectively (Bouwens et al., 2014). Thus despite the small number of HIEROs, they contribute 15–25% to the SFRD at –5, not taken into account in previous studies based on UV-selected samples. (There is essentially no overlap between the HIERO and LBG selections.) Figure 13 plots the SFRD from HIEROs identified in this work and from LBGs in previous work (Bouwens et al., 2014; Finkelstein et al., 2015).
6. Structural properties of HIEROs
Recent work has revealed a significant population of massive compact quiescent galaxies at –3 with typical ages of Gyr (Daddi et al., 2005; Buitrago et al., 2008; Szomoru et al., 2012; Cassata et al., 2013; van der Wel et al., 2014). It is suggested that the formation of these galaxies must have been through a compact star-forming phase (Barro et al., 2013; Patel et al., 2013; Stefanon et al., 2013; Williams et al., 2014; Zolotov et al., 2015). Indeed, a significant population of massive compact star-forming galaxies exists at –3 (Barro et al., 2013, 2014). These are likely to form the bulk population of compact quiescent galaxies at . However, when and how these compact galaxies formed remains unclear. Moreover, a significant number of passive galaxies have already formed at –4 (Gobat et al., 2012; Fan et al., 2013; Buitrago et al., 2013; Straatman et al., 2014), as also shown in this work, and the star-forming progenitors of these earliest quenched systems remain elusive (Straatman et al., 2015). Studying structural properties of HIEROs, which are representative massive galaxies at , should provide us important insights into these questions.
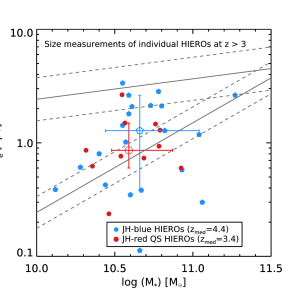
For both the and the QS HIERO populations, we limit sample galaxies to those with photometric redshifts . We then retrieved their F160W-band half-light radii from the CANDELS structural parameters catalogs as described by van der Wel et al. (2014). The median F160W magnitudes for the HIERO and QS HIERO are mag and mag, respectively. Therefore, in the left panel of Figure 14 we only plot galaxies that have reliable size measurements (with flag = 0 in the catalog of structural parameters, as described in van der Wel et al. (2012)). This leaves us 22 (out of 66) and 11 (out of 15) QS HIEROs with respective median F160W magnitudes of mag and mag. Quiescent galaxies at are as compact as their counterparts.
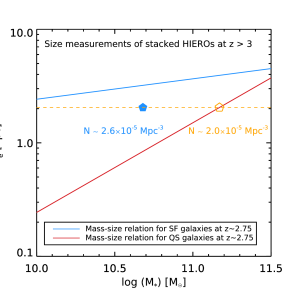
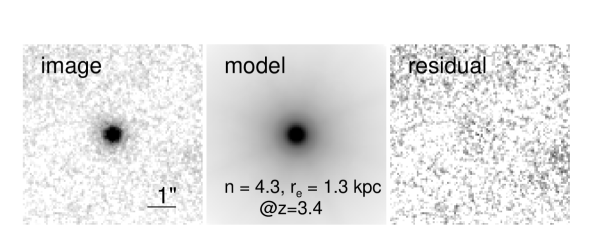
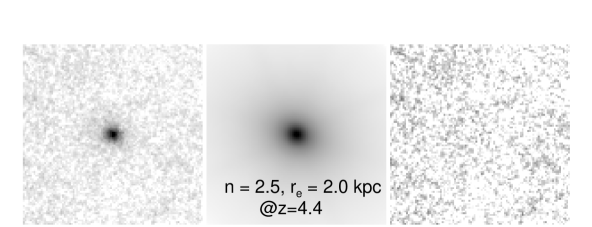
There are similar numbers of compact star-forming HIEROs compared to quiescent HIEROs, though the star-forming ones tend to be at higher redshifts. If we define galaxies below the 1 upper bound of the mass-size relation for quiescent galaxies as compact, then there are 7/11 compact quiescent and 10/22 compact star-forming HIEROs, respectively. This corresponds to a number density of Mpc-3 and Mpc-3 for compact quiescent () and star-forming HIEROs (), respectively. The actual fraction of compact galaxies for star-forming HIEROs are likely lower because most of them are not shown in this figure due to unreliable size measurements, which tend to have larger sizes based on stacking. This seems at odds with the findings of Straatman et al. (2015), who revealed a paucity of compact star-forming galaxies in their galaxy samples. We argue that this is likely due to the difference in the sample selection methods and cosmic variance. (Straatman et al. selected their sample based on and catalogs and focused on galaxies with at .) The majority of the HIEROs are too faint to have reliable size measurements, so we measured the size of the stacked F160W image (Figure 14). We derived the half-light radius of the stacked image with single Sérsic model fitting using GALFIT (Peng et al., 2010), as shown in Figure 15. The best-fit Sérsic model yields and kpc (assuming a median redshift of ) for star-forming HIEROs while it yields and kpc (assuming a median redshift of ) for quiescent HIEROs.
Based on the mass-size relation of quiescent galaxies at (Figure. 14, van der Wel et al., 2014), the stellar mass of quiescent galaxies with similar sizes is . With current SFR of 240 yr-1, the HIEROs can reach this stellar mass within 0.6 Gyr, less than the time interval between the median redshift of HIEROs () and quiescent galaxies. This time scale, 0.6 Gyr, is similar to the gas depletion time for typical (main-sequence) star-forming galaxies at (Tacconi et al., 2013). We thus conclude that the HIEROs can evolve into the most massive quiescent galaxies at by in situ star formation and subsequent quenching. Moreover, the number density of massive quiescent galaxies with at is Mpc-3 (Muzzin et al., 2013; Ilbert et al., 2013), similar to the number density of HIEROs, 2.6 Mpc-3. The HIEROs are in general at much higher redshift than the compact star-forming galaxies identified by Barro et al. (2013) and Williams et al. (2014) and are also more massive than those identified by Williams et al. (2014). We propose that the HIEROs in our sample likely include the majority of the progenitors of the most massive, also likely to be the first quenched, quiescent galaxies at . Further investigations of the HIEROs would be key to unveil the formation mechanism of the earliest-quenched massive (compact) quiescent galaxies.
7. Completeness of the HIERO selection for massive galaxies at
The new color selection technique identifies massive red galaxies at . Both photometric analysis on individual optical-to-NIR SED and the stacked infrared SED suggest that we reveal a population of massive galaxies that was largely missed in previous UV-selected samples. A critical question is then to what extent these HIEROs represent massive galaxy populations at .
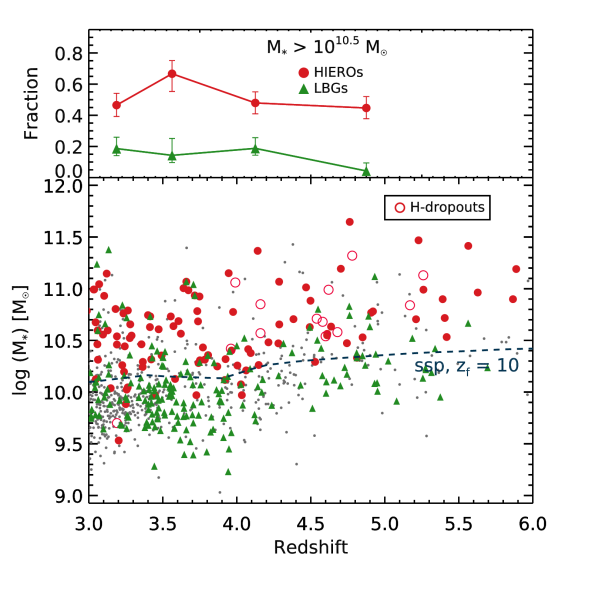
Unfortunately it is difficult to precisely estimate the selection efficiency of HIEROs because there are no complete spectroscopically confirmed massive galaxy samples at these redshifts. Bearing in mind the uncertainty in photometric redshifts (especially for those galaxies that are neither LBGs nor HIEROs), we seek a rough estimate of the selection efficiency of the HIERO criterion in selecting massive galaxies at by comparing to photometric-redshift-selected samples. Figure 16 presents the stellar mass versus redshift for all galaxies with and in the two GOODS fields, which are selected based on the F160W-band selected catalogs from CANDELS and those -dropouts identified in this work. For galaxies in the CANDELS catalog, we use the stellar mass and redshifts from the official CANDELS catalog while for the -dropouts we use the stellar mass and redshifts estimated in this work. We emphasize again that no significant differences are found for HIEROs in terms of their redshift and stellar mass estimates between this work and those from CANDELS.
Figure 16 shows that of the galaxies with at can be identified by our HIERO selection, while only are selected as LBGs (-, -, or -dropouts) using the same criteria as Bouwens et al. (2012). Moreover, of the massive galaxies are -dropouts, which are not included in the CANDELS -band-selected catalog. To explore whether these results strongly depend on the photometric redshift estimation, we also derived the fraction of HIEROs and LBGs at the high mass end in the GOODS-South field using photometric redshift estimation from Hsu et al. (2014), yielding similar results on the fraction of massive galaxies selected as -dropouts and HIEROs in general. These results suggest that the HIEROs dominate the high-mass end of the stellar mass function at , and their properties are thus representative of the massive galaxies at these redshifts. On the other hand, the LBG selection misses the majority of the most massive galaxies at high redshifts and significantly underestimates the high-mass end of the stellar mass function. Similarly, using the -band selected samples alone would also miss a significant fraction of massive galaxies.
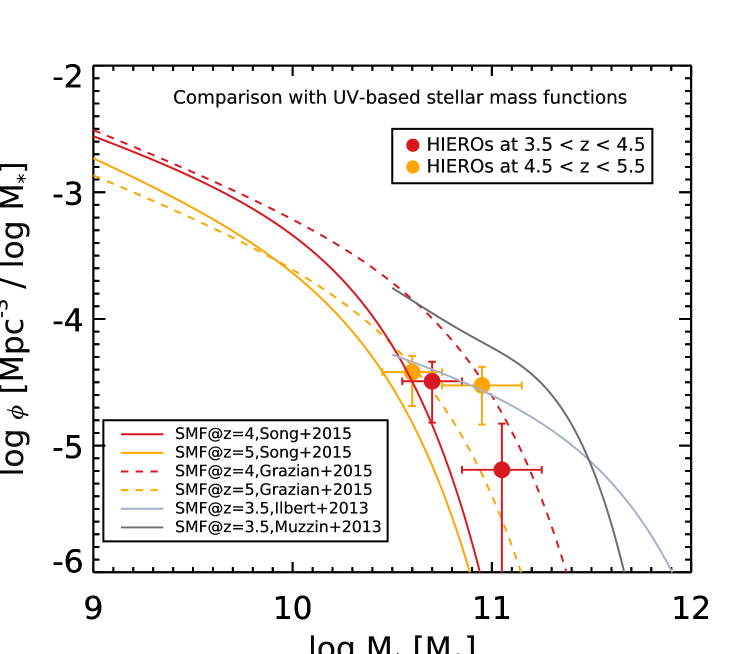
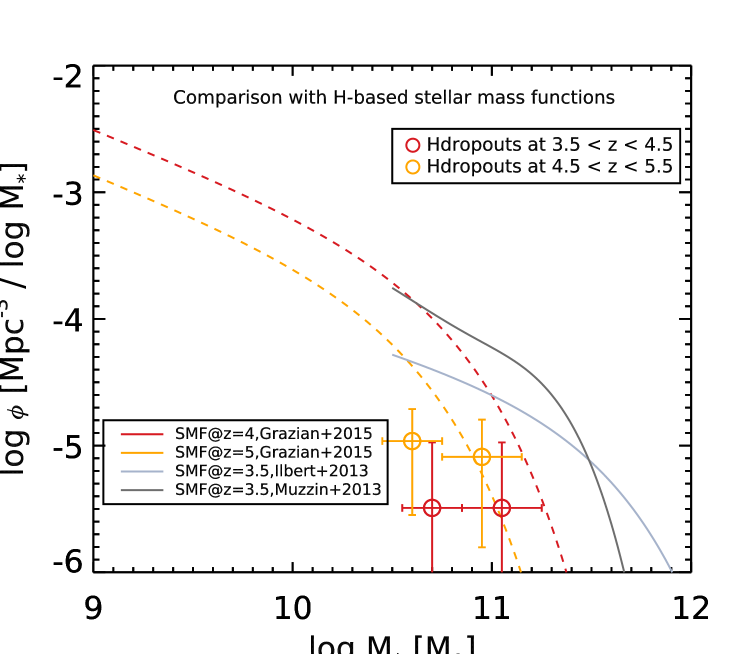
Figure 17 presents the comparison between the number density of HIEROs and the galaxy stellar mass functions (SMF) based on both UV and -selected samples. We separated the HIEROs with into two stellar mass bins. Figure 17 reveals that the HIEROs dominate at the high-mass end and represent the key population that reconciles the discrepancies between UV-based SMFs (Song et al., 2015) and SMFs based on stellar-mass-selected samples (Grazian et al., 2015) at –5 (but we caution that the uncertainty at the massive end of the SMF for both estimates is quite large). On the other hand, we also compare particularly the number density of -dropouts with the SMF based on -band-selected samples (Grazian et al., 2015). In this way we can derive the fraction of massive galaxies missed by -band selection. As shown in the bottom panel of Figure 17, at , the number density of -dropouts is comparable to that of -detected galaxies (down to the limit of the CANDELS survey). This suggests that, even based on -band-selected samples (or more precisely, mass-selected samples based on -band catalogs), we may still substantially underestimate the most massive end and get a steeper exponential tail while the true exponential tail may be much shallower. Unfortunately, spectroscopic confirmation of these most massive galaxies at the highest redshift is not possible with current optical and NIR facilities. Instead, JWST and ALMA would be the most promising tools to fully address this question.
8. Conclusion
This paper demonstrates a new and IRAC color selection technique (HIEROs: ) to identify massive, UV-faint galaxies at that are systematically missed by the Lyman-break selection technique. The HIEROs also include a significant population of massive and dusty galaxies at –3, which can be separated from the true star-forming galaxies with an additional color, enabling a clean selection of (dusty) star-forming galaxies at . The HIEROs dominate the high-mass end of the stellar mass function, making up 60% of galaxies with while LBGs contribute only . The fact that only the , , and IRAC m bands are involved in this selection allows us to efficiently select large samples of massive galaxies at .
The high-redshift nature of HIEROs are independently confirmed through their stacked UV-to-NIR and FIR SEDs: the stacked rest-frame UV SED resembles those of - and -dropouts while the stacked FIR SED peaks at 500 m. Based on the stacked SEDs, UV and infrared properties of HIEROs are representative of massive star-forming galaxies at . They are 2–3 magnitudes fainter in the rest-frame UV than LBGs with the same stellar mass and tend to be above the IRX– relation. Thus both stellar mass and star formation rates based purely on UV are underestimated. The HIEROs have typical SFR 240 yr-1 and sSFR 4.2 Gyr-1, double the rates for similarly massive galaxies and suggesting that the sSFR for massive galaxies continue to increase at yet with a decreased growth rate compared to that at . This is consistent with recent findings for less massive and for UV-selected galaxies.
There are similar numbers of compact quiescent and star-forming galaxies among the HIEROs, with the star-forming ones being at higher redshifts than quiescent galaxies ( vs. ). This suggests that even the earliest quenched systems may have gone through a compact star-forming phase which started at an even earlier epoch, providing important constraints on the formation of compact quiescent galaxies. For the total HIERO population, both their number densities and sizes match those of the most massive ( ) quiescent galaxies at , providing the most plausible star-forming progenitors.
The HIERO selection provides a reliable and representative sample of massive galaxies at . Although rough constraints on their typical physical properties can be obtained through stacking, their general faintness in the rest-frame UV-to-optical inhibits accurate determination of the physical properties for individual galaxies with current optical and NIR facilities. On the other hand, their brightness in the mid- to far-infrared make JWST and ALMA promising tools to further explore their nature in great detail.
References
- Alexander et al. (2003) Alexander, D. M., et al. 2003, AJ, 126, 539
- Ashby et al. (2013) Ashby, M. L. N., et al. 2013, ApJ, 769, 80
- Ashby et al. (2015) —. 2015, ApJS, 218, 33
- Barro et al. (2013) Barro, G., et al. 2013, ApJ, 765, 104
- Barro et al. (2014) —. 2014, ApJ, 791, 52
- Behroozi et al. (2013) Behroozi, P. S., Wechsler, R. H., & Conroy, C. 2013, ApJ, 770, 57
- Béthermin et al. (2010) Béthermin, M., Dole, H., Beelen, A., & Aussel, H. 2010, A&A, 512, A78
- Béthermin et al. (2012) Béthermin, M., et al. 2012, A&A, 542, A58
- Bian et al. (2013) Bian, F., et al. 2013, ApJ, 774, 28
- Bouwens et al. (2012) Bouwens, R. J., et al. 2012, ApJ, 754, 83
- Bouwens et al. (2014) —. 2014, ApJ, 793, 115
- Brammer et al. (2008) Brammer, G. B., van Dokkum, P. G., & Coppi, P. 2008, ApJ, 686, 1503
- Brammer et al. (2011) Brammer, G. B., et al. 2011, ApJ, 739, 24
- Bruzual & Charlot (2003) Bruzual, G., & Charlot, S. 2003, MNRAS, 344, 1000
- Buitrago et al. (2008) Buitrago, F., Trujillo, I., Conselice, C. J., Bouwens, R. J., Dickinson, M., & Yan, H. 2008, ApJ, 687, L61
- Buitrago et al. (2013) Buitrago, F., Trujillo, I., Conselice, C. J., & Häußler, B. 2013, MNRAS, 428, 1460
- Calzetti et al. (2000) Calzetti, D., Armus, L., Bohlin, R. C., Kinney, A. L., Koornneef, J., & Storchi-Bergmann, T. 2000, ApJ, 533, 682
- Capak et al. (2011) Capak, P. L., et al. 2011, Nature, 470, 233
- Capak et al. (2015) —. 2015, Nature, 522, 455
- Caputi et al. (2012) Caputi, K. I., et al. 2012, ApJ, 750, L20
- Casey et al. (2012) Casey, C. M., et al. 2012, ApJ, 761, 139
- Cassata et al. (2013) Cassata, P., et al. 2013, ApJ, 775, 106
- Chabrier (2003) Chabrier, G. 2003, PASP, 115, 763
- Chapman et al. (2005) Chapman, S. C., Blain, A. W., Smail, I., & Ivison, R. J. 2005, ApJ, 622, 772
- Chary & Elbaz (2001) Chary, R., & Elbaz, D. 2001, ApJ, 556, 562
- Daddi et al. (2004) Daddi, E., Cimatti, A., Renzini, A., Fontana, A., Mignoli, M., Pozzetti, L., Tozzi, P., & Zamorani, G. 2004, ApJ, 617, 746
- Daddi et al. (2005) Daddi, E., et al. 2005, ApJ, 626, 680
- Daddi et al. (2009) —. 2009, ApJ, 694, 1517
- Dahlen et al. (2013) Dahlen, T., et al. 2013, ApJ, 775, 93
- Dekel & Mandelker (2014) Dekel, A., & Mandelker, N. 2014, MNRAS, 444, 2071
- Dey et al. (2008) Dey, A., et al. 2008, ApJ, 677, 943
- Draine & Li (2007) Draine, B. T., & Li, A. 2007, ApJ, 657, 810
- Dunlop et al. (2004) Dunlop, J. S., et al. 2004, MNRAS, 350, 769
- Elbaz et al. (2007) Elbaz, D., et al. 2007, A&A, 468, 33
- Elbaz et al. (2011) —. 2011, A&A, 533, A119
- Fan et al. (2013) Fan, L., Fang, G., Chen, Y., Pan, Z., Lv, X., Li, J., Lin, L., & Kong, X. 2013, ApJ, 771, L40
- Feldmann & Mayer (2015) Feldmann, R., & Mayer, L. 2015, MNRAS, 446, 1939
- Finkelstein et al. (2015) Finkelstein, S. L., et al. 2015, ApJ, 810, 71
- Fontana et al. (2006) Fontana, A., et al. 2006, A&A, 459, 745
- Fontana et al. (2009) —. 2009, A&A, 501, 15
- Fontana et al. (2014) —. 2014, A&A, 570, A11
- Franx et al. (2003) Franx, M., et al. 2003, ApJ, 587, L79
- Gobat et al. (2012) Gobat, R., et al. 2012, ApJ, 759, L44
- González et al. (2014) González, V., Bouwens, R., Illingworth, G., Labbé, I., Oesch, P., Franx, M., & Magee, D. 2014, ApJ, 781, 34
- González et al. (2011) González, V., Labbé, I., Bouwens, R. J., Illingworth, G., Franx, M., & Kriek, M. 2011, ApJ, 735, L34
- Grazian et al. (2007) Grazian, A., et al. 2007, A&A, 465, 393
- Grazian et al. (2015) —. 2015, A&A, 575, A96
- Grogin et al. (2011) Grogin, N. A., et al. 2011, ApJS, 197, 35
- Guo et al. (2013) Guo, Y., et al. 2013, ApJS, 207, 24
- Heinis et al. (2014) Heinis, S., et al. 2014, MNRAS, 437, 1268
- Hsu et al. (2014) Hsu, L.-T., et al. 2014, ApJ, 796, 60
- Huang et al. (2009) Huang, J., et al. 2009, ApJ, 700, 183
- Huang et al. (2011) Huang, J.-S., Zheng, X. Z., Rigopoulou, D., Magdis, G., Fazio, G. G., & Wang, T. 2011, ApJ, 742, L13
- Huang et al. (2014) Huang, J.-S., et al. 2014, ApJ, 784, 52
- Hughes et al. (2002) Hughes, D. H., et al. 2002, MNRAS, 335, 871
- Ilbert et al. (2013) Ilbert, O., et al. 2013, A&A, 556, A55
- Kajisawa et al. (2010) Kajisawa, M., Ichikawa, T., Yamada, T., Uchimoto, Y. K., Yoshikawa, T., Akiyama, M., & Onodera, M. 2010, ApJ, 723, 129
- Karim et al. (2011) Karim, A., et al. 2011, ApJ, 730, 61
- Kennicutt (1998) Kennicutt, Jr., R. C. 1998, ARA&A, 36, 189
- Koekemoer et al. (2011) Koekemoer, A. M., et al. 2011, ApJS, 197, 36
- Kong et al. (2004) Kong, X., Charlot, S., Brinchmann, J., & Fall, S. M. 2004, MNRAS, 349, 769
- Kriek et al. (2009) Kriek, M., van Dokkum, P. G., Labbé, I., Franx, M., Illingworth, G. D., Marchesini, D., & Quadri, R. F. 2009, ApJ, 700, 221
- Lee et al. (2012) Lee, K.-S., Alberts, S., Atlee, D., Dey, A., Pope, A., Jannuzi, B. T., Reddy, N., & Brown, M. J. I. 2012, ApJ, 758, L31
- Lutz et al. (2011) Lutz, D., et al. 2011, A&A, 532, A90
- Madau & Dickinson (2014) Madau, P., & Dickinson, M. 2014, ARA&A, 52, 415
- Magdis et al. (2010) Magdis, G. E., et al. 2010, ApJ, 720, L185
- Magnelli et al. (2013) Magnelli, B., et al. 2013, A&A, 553, A132
- Mancini et al. (2009) Mancini, C., Matute, I., Cimatti, A., Daddi, E., Dickinson, M., Rodighiero, G., Bolzonella, M., & Pozzetti, L. 2009, A&A, 500, 705
- Marchesini et al. (2014) Marchesini, D., et al. 2014, ApJ, 794, 65
- Meurer et al. (1999) Meurer, G. R., Heckman, T. M., & Calzetti, D. 1999, ApJ, 521, 64
- Morrison et al. (2010) Morrison, G. E., Owen, F. N., Dickinson, M., Ivison, R. J., & Ibar, E. 2010, ApJS, 188, 178
- Muzzin et al. (2013) Muzzin, A., et al. 2013, ApJ, 777, 18
- Nayyeri et al. (2014) Nayyeri, H., et al. 2014, ApJ, 794, 68
- Noll et al. (2009) Noll, S., Burgarella, D., Giovannoli, E., Buat, V., Marcillac, D., & Muñoz-Mateos, J. C. 2009, A&A, 507, 1793
- Pannella et al. (2015) Pannella, M., et al. 2015, ApJ, 807, 141
- Patel et al. (2013) Patel, S. G., et al. 2013, ApJ, 766, 15
- Peng et al. (2010) Peng, C. Y., Ho, L. C., Impey, C. D., & Rix, H.-W. 2010, AJ, 139, 2097
- Pérez-González et al. (2008) Pérez-González, P. G., et al. 2008, ApJ, 675, 234
- Reddy et al. (2012) Reddy, N., et al. 2012, ApJ, 744, 154
- Riechers et al. (2010) Riechers, D. A., et al. 2010, ApJ, 720, L131
- Riechers et al. (2013) —. 2013, Nature, 496, 329
- Sargent et al. (2014) Sargent, M. T., et al. 2014, ApJ, 793, 19
- Schreiber et al. (2015) Schreiber, C., et al. 2015, A&A, 575, A74
- Serra et al. (2011) Serra, P., Amblard, A., Temi, P., Burgarella, D., Giovannoli, E., Buat, V., Noll, S., & Im, S. 2011, ApJ, 740, 22
- Seymour et al. (2007) Seymour, N., et al. 2007, ApJS, 171, 353
- Song et al. (2015) Song, M., et al. 2015, ArXiv e-prints
- Spitler et al. (2014) Spitler, L. R., et al. 2014, ApJ, 787, L36
- Stark et al. (2013) Stark, D. P., Schenker, M. A., Ellis, R., Robertson, B., McLure, R., & Dunlop, J. 2013, ApJ, 763, 129
- Stefanon et al. (2013) Stefanon, M., Marchesini, D., Rudnick, G. H., Brammer, G. B., & Whitaker, K. E. 2013, ApJ, 768, 92
- Straatman et al. (2014) Straatman, C. M. S., et al. 2014, ApJ, 783, L14
- Straatman et al. (2015) —. 2015, ApJ, 808, L29
- Szomoru et al. (2012) Szomoru, D., Franx, M., & van Dokkum, P. G. 2012, ApJ, 749, 121
- Tacconi et al. (2013) Tacconi, L. J., et al. 2013, ApJ, 768, 74
- Tasca et al. (2015) Tasca, L. A. M., et al. 2015, A&A, 581, A54
- van der Wel et al. (2012) van der Wel, A., et al. 2012, ApJS, 203, 24
- van der Wel et al. (2014) —. 2014, ApJ, 788, 28
- van Dokkum et al. (2006) van Dokkum, P. G., et al. 2006, ApJ, 638, L59
- Vieira et al. (2013) Vieira, J. D., et al. 2013, Nature, 495, 344
- Wagg et al. (2014) Wagg, J., et al. 2014, ApJ, 783, 71
- Wang et al. (2013) Wang, R., et al. 2013, ApJ, 773, 44
- Wang et al. (2012) Wang, T., et al. 2012, ApJ, 752, 134
- Wang et al. (2012) Wang, W.-H., Barger, A. J., & Cowie, L. L. 2012, ApJ, 744, 155
- Williams et al. (2014) Williams, C. C., et al. 2014, ApJ, 780, 1
- Williams et al. (2009) Williams, R. J., Quadri, R. F., Franx, M., van Dokkum, P., & Labbé, I. 2009, ApJ, 691, 1879
- Wuyts et al. (2009) Wuyts, S., van Dokkum, P. G., Franx, M., Förster Schreiber, N. M., Illingworth, G. D., Labbé, I., & Rudnick, G. 2009, ApJ, 706, 885
- Xue et al. (2011) Xue, Y. Q., et al. 2011, ApJS, 195, 10
- Yan et al. (2004) Yan, H., et al. 2004, ApJ, 616, 63
- Yan et al. (2007) Yan, L., et al. 2007, ApJ, 658, 778
- Younger et al. (2007) Younger, J. D., et al. 2007, ApJ, 671, 1531
- Zolotov et al. (2015) Zolotov, A., et al. 2015, MNRAS, 450, 2327