Little Red Dots or Brown Dwarfs?
NIRSpec Discovery of Three Distant Brown Dwarfs Masquerading as NIRCam-Selected
Highly-Reddened AGNs
Abstract
Cold, substellar objects such as brown dwarfs have long been recognized as contaminants in color-selected samples of active galactic nuclei (AGNs). In particular, their near- to mid-infrared colors (1–5 m) can closely resemble the V-shaped () spectra of highly-reddened accreting supermassive black holes (“little red dots”), especially at . Recently, a NIRCam-selected sample of little red dots over 45 arcmin2 has been followed up with deep NIRSpec multi-object prism spectroscopy through the UNCOVER program. By investigating the acquired spectra, we identify three of the 14 followed-up objects as T/Y dwarfs with temperatures between 650 and 1300 K and distances between 0.8 and 4.8 kpc. At kpc, Abell2744-BD1 is the most distant brown dwarf discovered to date. We identify the remaining 11 objects as extragalactic sources at . Given that three of these sources are strongly-lensed images of the same AGN (Abell2744-QSO1), we derive a brown dwarf contamination fraction of 25% in this NIRCam-selection of little red dots. We find that in the near-infrared filters, brown dwarfs appear much bluer than the highly-reddened AGN, providing an avenue for distinguishing the two and compiling cleaner samples of photometrically selected highly-reddened AGN.
1 Introduction
JWST photometry has revealed a population of red and extremely compact sources, the little red dots, representing faint and/or highly-reddened active galactic nuclei (AGNs) at (Endsley et al., 2023; Furtak et al., 2023a; Onoue et al., 2023; Juodžbalis et al., 2023; Bogdan et al., 2023; Barro et al., 2023; Yang et al., 2023; Labbe et al., 2023). The nature of some of these sources is being confirmed through NIRCam wide field slitless spectroscopy (Matthee et al., 2023) and NIRSpec follow-up campaigns (Carnall et al., 2023; Harikane et al., 2023; Kocevski et al., 2023; Larson et al., 2023; Übler et al., 2023; Barro et al., 2023; Maiolino et al., 2023a, b; Furtak et al., 2023b). Constraining the number density of faint AGN at these high redshifts can be fundamental for distinguishing between different massive black hole formation and growth scenarios as well as understanding their role in reionizing the Universe. Moreover, constraining the properties of their host galaxies can be crucial in calibrating the massive black hole-host galaxy co-evolution models, and in particular, the role of AGN feedback in regulating star formation.
Samples of tens of faint AGNs at are being confirmed spectroscopically (Harikane et al., 2023; Matthee et al., 2023; Maiolino et al., 2023b), enabling tremendous progress in constraining their number density. However, due to small survey areas, insufficient depths, or the complex selection functions of spectroscopic surveys, tight constraints on the luminosity function of faint and/or highly reddened AGN might prove challenging without fully leveraging wide photometry-only surveys of NIRCam and MIRI. Inferring the luminosity function of broad-band color-selected AGN is subject to contaminants, especially in the form of Galactic, cold, substellar objects, such as brown dwarfs (see, e.g., Kirkpatrick et al., 2011; Stern et al., 2012; Wilkins et al., 2014). Depending on the available filters, the 1m spectral features of brown dwarfs can closely mimic a Ly break at –7.5 (Wilkins et al., 2014; Bowler et al., 2015; Hainline et al., 2023). Moreover, their V-shaped spectra, driven by temperature-dependent broad features at m and m (see, e.g., Burgasser, 2014), can resemble the V-shaped spectra of highly-reddened AGN at , characterized by a blue continuum at observed 1–3 m and a red continuum at 3–5 m (see, e.g., Labbe et al., 2023; Furtak et al., 2023a, b).
Fully leveraging the wide survey areas, depths, and simple selection criteria of photometry-only surveys in constraining the cosmic distribution and redshift evolution of red AGNs requires an accurate understanding of the prevalence of potential contaminants. In this work, we analyze the NIRSpec multi-object prism follow-up (UNCOVER program; Bezanson et al., 2022) of a NIRCam-selected sample of 13 highly-reddened AGN (Labbe et al., 2023) to investigate the fraction of brown dwarf contaminants. We confirm three objects as brown dwarfs, and the remaining ten as extragalactic sources. Given that three of the extragalactic spectra correspond to the triply imaged AGN Abell2744-QSO1 (Furtak et al., 2023a, b), we infer a brown dwarf contamination fraction of . By comparing the distribution of these objects on near- and mid-infrared color-color diagrams, we find that brown dwarfs are on average much bluer in near-infrared filters than extragalactic sources. Hence, simple color cuts can potentially minimize the contamination of brown dwarfs in color-selected samples of faint/highly-reddened AGN.
So far, only a handful of brown dwarfs have been targeted/discovered with JWST. These include the serendipitous discovery of a late T-type at –0.7 kpc in NIRCam photometry (Nonino et al., 2023); NIRCam photometry of the late T-type HD 19467 B at kpc (Greenbaum et al., 2023); discovery of a Y+Y-type brown dwarf binary at kpc in NIRCam photometry (Calissendorff et al., 2023); discovery of a T-type at kpc in NIRCam photometry (Wang et al., 2023); and the NIRSpec and MIRI spectroscopy of a Y-type at kpc (Beiler et al., 2023), marking the first JWST spectrum of a nearby brown dwarf.
In this work, we report the first NIRSpec spectra of three distant brown dwarfs. One of these spectra (Abell2744-BD3) confirms the brown dwarf discovered in NIRCam photometry by Nonino et al. (2023). By fitting their spectral energy distributions, we infer effective temperatures of 1300 K, 1100 K, and 650 K for the early T-type Abell2744-BD1, mid T-type Abell2744-BD2, and the late T-type Abell2744-BD3, respectively. We infer distances of kpc, kpc, and kpc for Abell2744-BD1, -BD2, and -BD3 respectively. Abell2744-BD1 at 4.8 kpc is the farthest spectroscopically confirmed brown dwarf to date.
2 Data
| filter | Abell2744-BD1 | Abell2744-BD2 | Abell2744-BD3aaThis is the brown dwarf discovered in NIRCam photometry by Nonino et al. (2023). |
|---|---|---|---|
| MSA ID | 32265 | 33437 | 39243 |
| RAbbJ2000.0 (deg) | 3.537529 | 3.546420 | 3.513891 |
| DecbbJ2000.0 (deg) | |||
| F090W | |||
| F115W | |||
| F150W | |||
| F200W | |||
| F277W | |||
| F356W | |||
| F410M | |||
| F444W |
Labbe et al. (2023) identified a sample of 26 little red dots in a 45 arcmin2 NIRCam coverage of the Abell 2744 field (the UNCOVER program; Bezanson et al., 2022). These objects were color selected based on their V-shaped spectra, to be blue in the rest-UV (1216–3500Å) and red at rest-optical (Å) wavelengths. They were selected to be dominated by a point-source-like central component. Through spectral energy distribution fitting (SED fitting), a subsample of 17 sources was identified as being dominated by an AGN component at the reddest end of the spectrum (i.e., the F444W photometry). 14 out of these 17 objects were recently followed up by deep NIRSpec multi-object prism spectroscopy through the UNCOVER program.
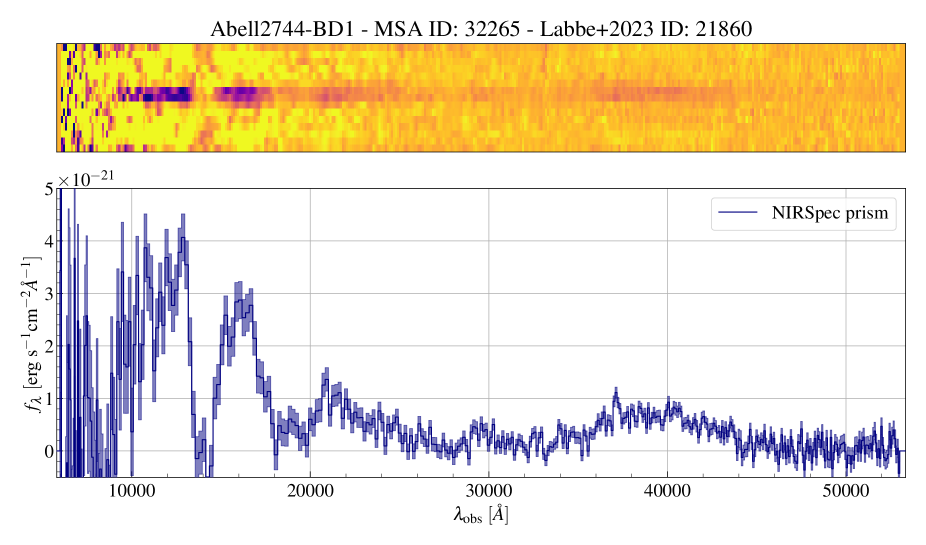
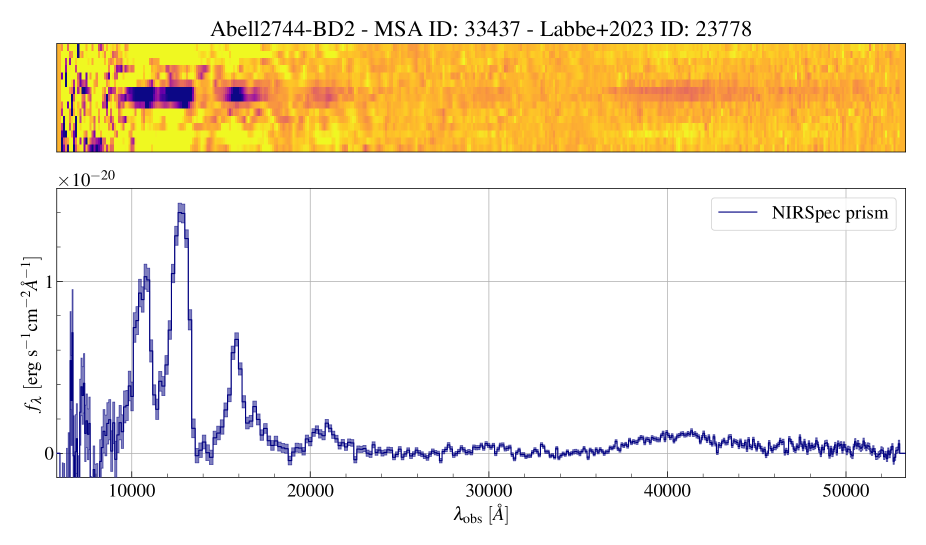
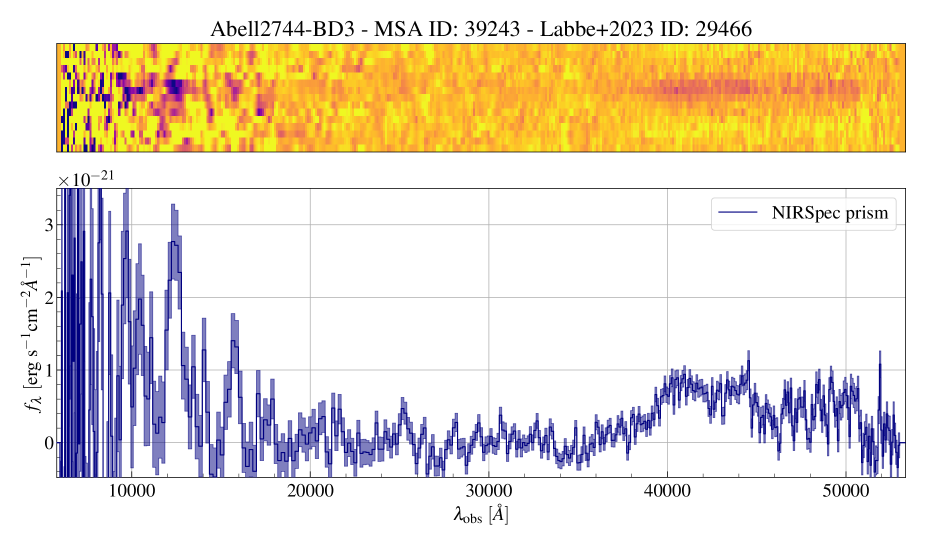
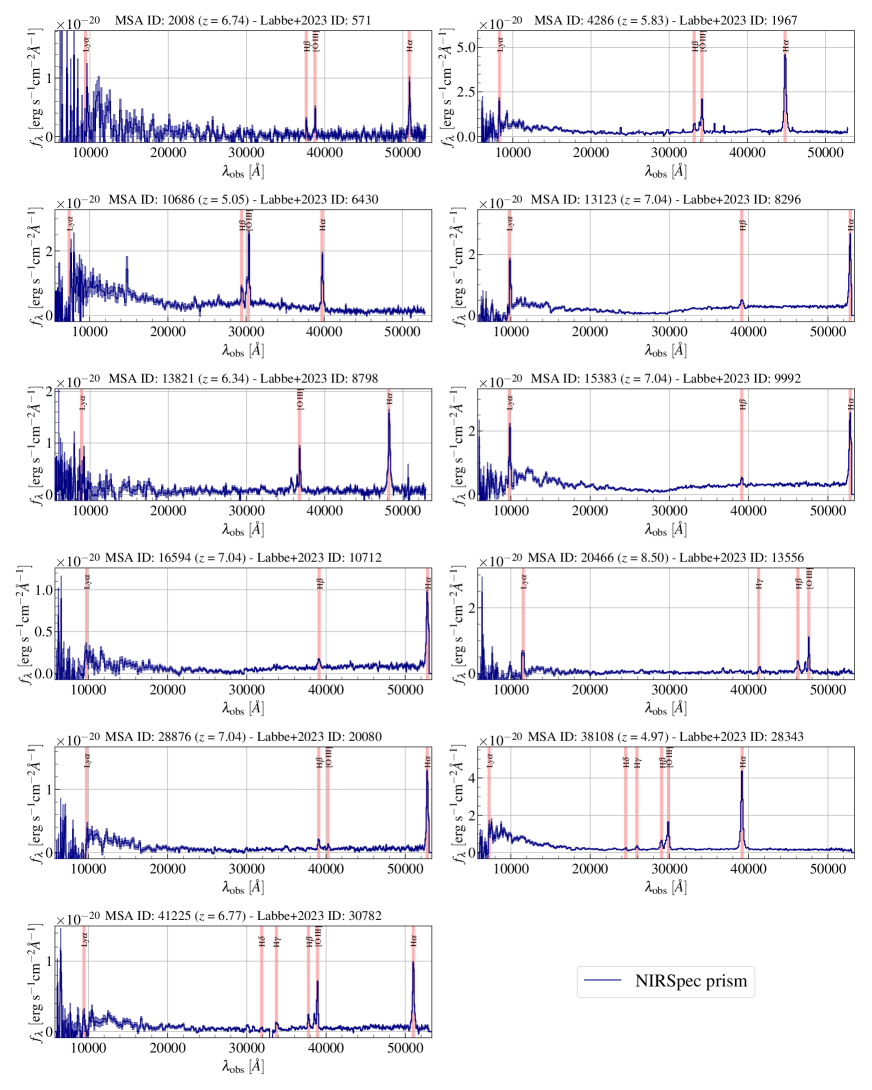
We reduced the NIRSpec prism data for the 14 targeted little red dots using the pipeline described in detail in Langeroodi & Hjorth (2023). In brief, we converted the raw data into count-rate images (the stage 1 reduction) using the 1.10.0 version of the official STScI JWST pipeline (Ferruit et al., 2022; Bushouse et al., 2023) and the jwst_1106.pmap Calibration Reference Data System (CRDS) context file. We used the msaexp software (Brammer, 2022) for the 2nd and 3rd reduction levels. This includes correcting the residual noise, removing the “snowball” artifacts, WCS registration, flat-fielding, slit path-loss correction, flux calibration, background subtraction, and extracting the optimal 1D spectra. The extracted spectra of these objects are shown in Figures 1, 3, 5, and 7.
Visual inspection confirms three out of 14 objects as brown dwarfs (Abell2744-BD1, Abell2744-BD2, and Abell2744-BD3); the spectra of these sources are shown in Figures 1, 3, and 5. All three objects exhibit the characteristic three-peak features around m, primarily associated with H2O and CH4 absorption. In Section 3 we infer the physical properties of these objects through SED-fitting. We note that Abell2744-BD3 was previously identified as a brown dwarf candidate in NIRCam photometry (Nonino et al., 2023). This object was later identified as a potential highly obscured AGN (see the initial arXiv submission of Labbe et al., 2023), and hence followed up by UNCOVER’s deep NIRSpec MOS.
We confirm the remaining 11 objects (shown in Figure 7) as extragalactic sources at through the identification of Ly breaks and/or emission lines such as Ly, H, [O III]4959,5007, or H. It is worth noting that three of these extragalactic sources (MSA IDs 13123, 15383, 16594) are the three images of the triply imaged AGN Abell2744-QSO1 at (Furtak et al., 2023a, b). Moreover, MSA ID 20466 was recently confirmed as a broad line AGN at (Kokorev et al., 2023). The nature of the entire sample of these 11 galaxies is discussed in detail in Greene et al. (2023), where 6 of them are confirmed as broad-line AGNs.
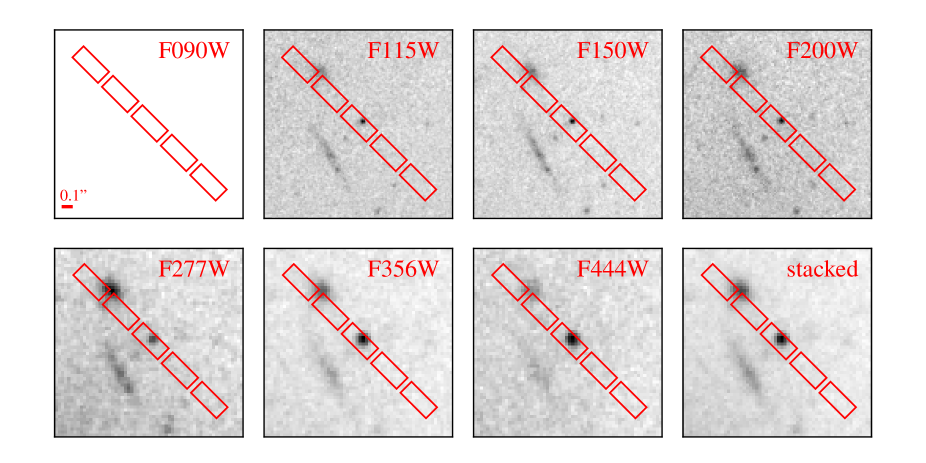
We measured the multi-band HST and NIRCam photometry of the 14 targeted little red dots using the pipeline detailed in Langeroodi & Hjorth (2023). The reduced images were acquired from the Grizli Image Release (v6.0) repository111https://grizli.readthedocs.io/en/latest/grizli/image-release-v6.html. Using empirical PSFs, we PSF-matched all the images to the F444W imaging. This excludes the HST WFC3_IR filters which generally have PSF FWHMs larger than that of F444W; for these filters, we adopted the correction factors measured in Finkelstein et al. (2022a) (derived through source injection simulations; see also Finkelstein et al., 2022b).
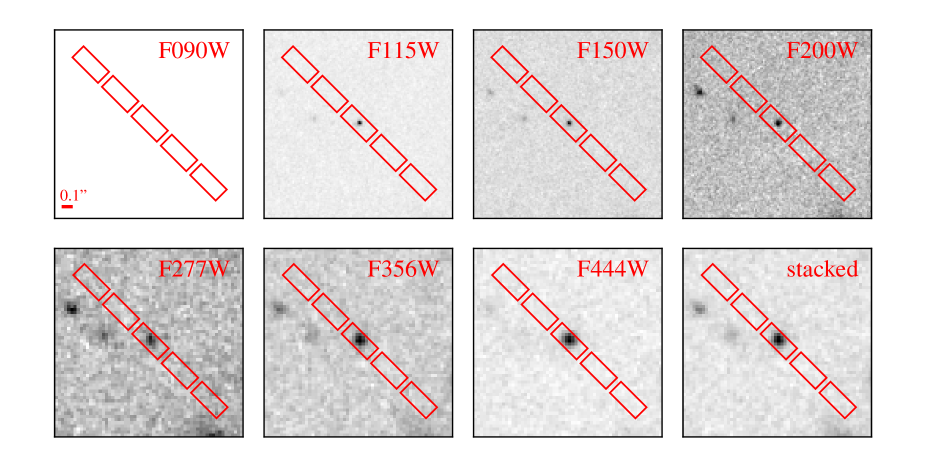
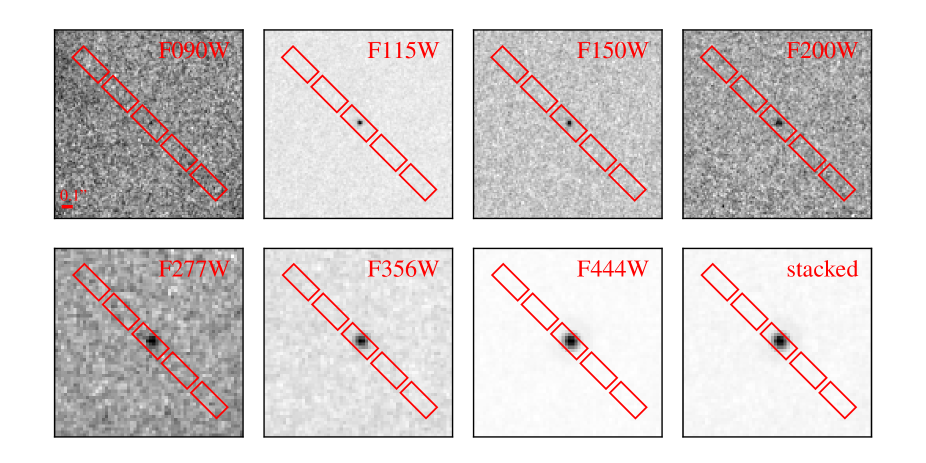
Source photometry was measured in circular apertures (diameter) using Source Extractor (Bertin & Arnouts, 1996) in dual image mode. We set DETECT_MINAREA = 5, DETECT_THRESH = 3.0, DEBLEND_NTHRESH = 32, and DEBLEND_MINCOUNT = 0.005. Aperture correction was performed by scaling all the measured MAG_APER magnitudes by the difference between the MAG_AUTO and MAG_APER flux in the F444W filter (for more details, see Langeroodi & Hjorth, 2023). We corrected for Galactic extinction of the extragalactic sources using the reddening values from Schlafly & Finkbeiner (2011) and assuming a Cardelli et al. (1989) attenuation curve with . We corrected the lensing magnification for the extragalactic sources adopting the Furtak et al. (2023c) lens model. Figures 2, 4, and 6 show cutouts of the NIRCam imaging of the three brown dwarfs; their extracted photometry are reported in Table 1. The colors of all the targeted little red dots are discussed in Section 4.
3 Characterizing the Brown Dwarfs
We use the Sonora brown dwarf cloud-free atmosphere and evolution models (Marley et al., 2021; Karalidi et al., 2021) to fit the SED of the brown dwarfs discovered in the Abell 2744 field and infer their physical properties and distance. We use the solar metallicity grid of atmosphere models from Karalidi et al. (2021) as spectral templates. This grid is parameterized by an effective temperature in the range = 500–1300 K, a surface gravity in = 3–5.5 , and an eddy diffusion coefficient of = 2, 4, or 7 . This corresponds to 459 unique models.
| parameter | Abell2744-BD1 | Abell2744-BD2 | Abell2744-BD3bbThis is the brown dwarf discovered in NIRCam photometry by Nonino et al. (2023). |
|---|---|---|---|
| MSA ID | 32265 | 33437 | 39243 |
| RAccJ2000.0 (deg) | 3.537529 | 3.546420 | 3.513891 |
| DecccJ2000.0 (deg) | |||
| type | T2.51 | T61 | T5 |
| aaThe upper limits on the uncertainties of , , and are dictated by the grid resolution of brown dwarf templates used for the template fitting. | aaThe upper limits on the uncertainties of , , and are dictated by the grid resolution of brown dwarf templates used for the template fitting. | aaThe upper limits on the uncertainties of , , and are dictated by the grid resolution of brown dwarf templates used for the template fitting. | |
| aaThe upper limits on the uncertainties of , , and are dictated by the grid resolution of brown dwarf templates used for the template fitting. | aaThe upper limits on the uncertainties of , , and are dictated by the grid resolution of brown dwarf templates used for the template fitting. | aaThe upper limits on the uncertainties of , , and are dictated by the grid resolution of brown dwarf templates used for the template fitting. | |
| aaThe upper limits on the uncertainties of , , and are dictated by the grid resolution of brown dwarf templates used for the template fitting. | aaThe upper limits on the uncertainties of , , and are dictated by the grid resolution of brown dwarf templates used for the template fitting. | aaThe upper limits on the uncertainties of , , and are dictated by the grid resolution of brown dwarf templates used for the template fitting. | |
| distance [pc] |
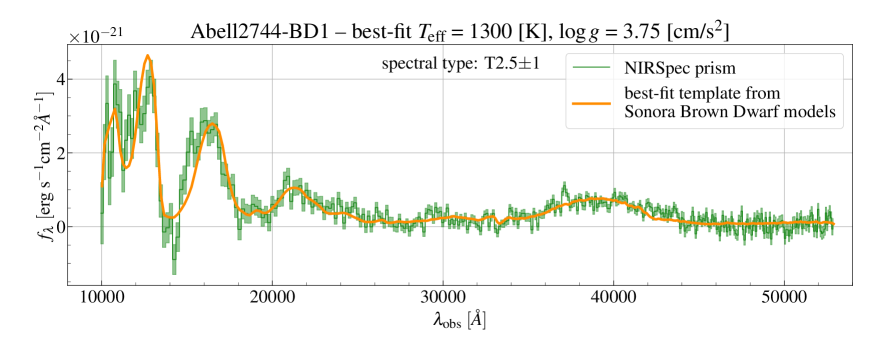
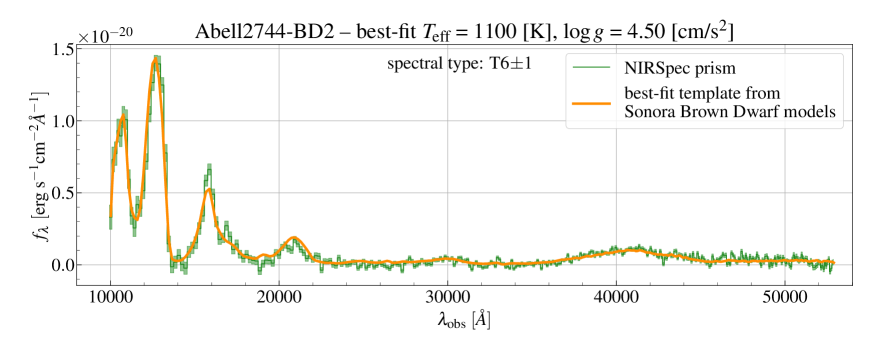
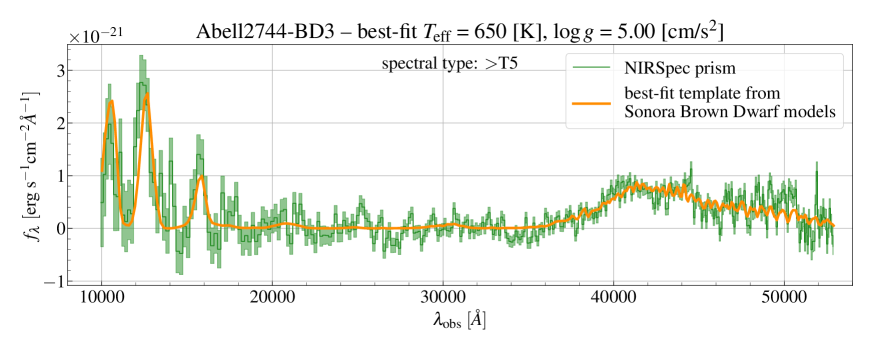
For each brown dwarf discovered in this work, we find the model template that best fits its spectrum. We convolve and resample each model template to match the spectral resolution and sampling of the NIRSpec prism. For each brown dwarf and model template, we use the scipy.optimize.curve_fit library (Virtanen et al., 2020) to derive the scaling factor that re-scales the model template to the observed spectrum. For each brown dwarf, we calculate the Gaussian of all the re-scaled model templates and choose the one with the smallest as the best-fit model. The best-fit models for Abell2744-BD1, Abell2744-BD2, and Abell2744-BD3 are shown as the orange curves in Figures 8, 9, and 10, respectively; their reduced values are 1.75, 2.51, and 1.91, respectively.
We use the brown dwarf evolution tables of Marley et al. (2021) to convert the and of the best-fit models to physical properties including mass (), radius (), helium mass fraction (Y), bolometric luminosity (), and age. For each best-fit and , we derive the parameters of interest by considering the full range of metallicities available in the tables. This typically results in 3 distinct values for each parameter of interest, corresponding to the three different metallicities included in the evolution tables. We use these 3 values as the median and uncertainty of each parameter of interest. The best-fit parameters are summarized in Table 2.
Following a similar approach, we use the photometry tables of Marley et al. (2021) to derive the absolute NIRCam magnitudes for each best-fit model. For each brown dwarf, we calculate one distance per photometry band by comparing the absolute and apparent magnitudes. We report the median and 1 distribution of the distances calculated for each object as its measured distance. Distances are reported in Table 2.
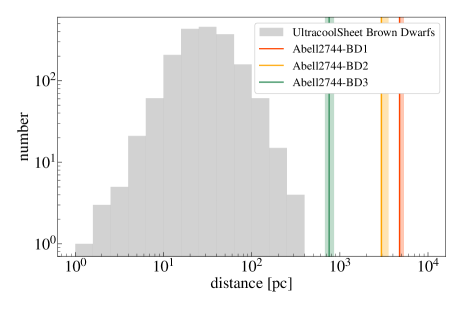
In Figure 11 we compare the distances of the brown dwarfs discovered in this work with those from the UltracoolSheet compilation (Best et al., 2020). UltracoolSheet is a catalog of more than 3000 ultracool brown dwarfs (spectral types of M6 and later) and imaged planets, aiming to provide a complete inventory of all ultracool dwarfs with measured parallaxes. The grey histogram in Figure 11 shows a subsample of UltracoolSheet with accurate parallaxes (i.e., a parallax S/N of better than ). All three brown dwarfs discovered in this work are at distances farther than what was probed prior to the launch of JWST. Interestingly, Abell2744-BD1 at kpc turns out to be the farthest brown dwarf spectroscopically confirmed to date. Such a high distance, at the given high Galactic latitude of this source ( deg), most likely places this brown dwarf outside the thin disk of the Milky Way (scale height of 0.3 kpc; see also Figure 6 in Hainline et al., 2023, and the discussion therein).
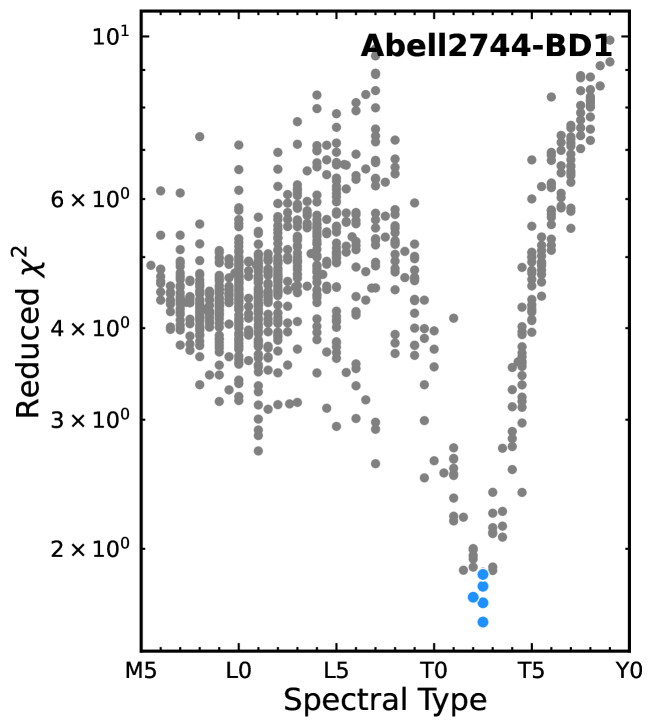
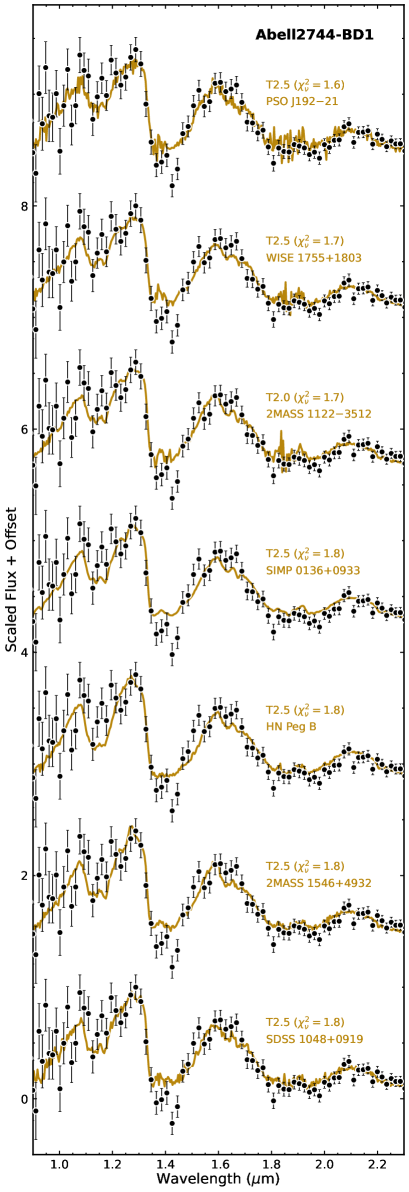
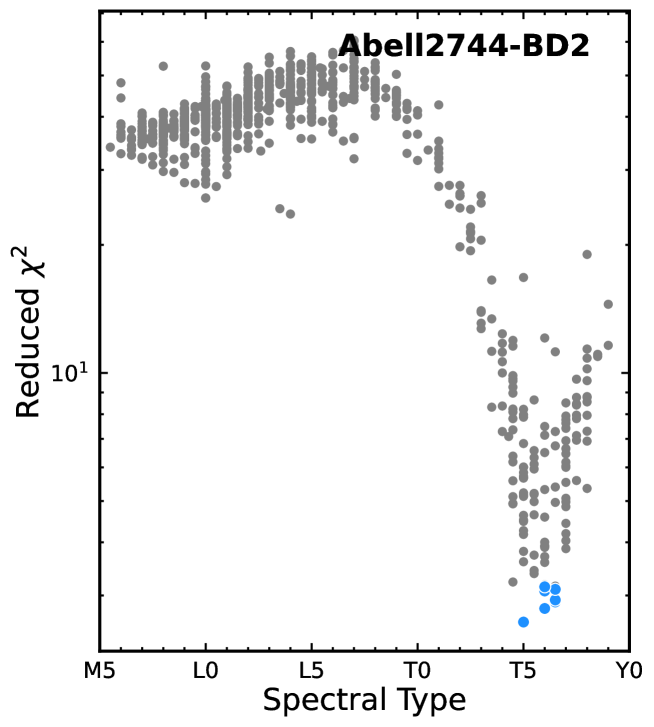
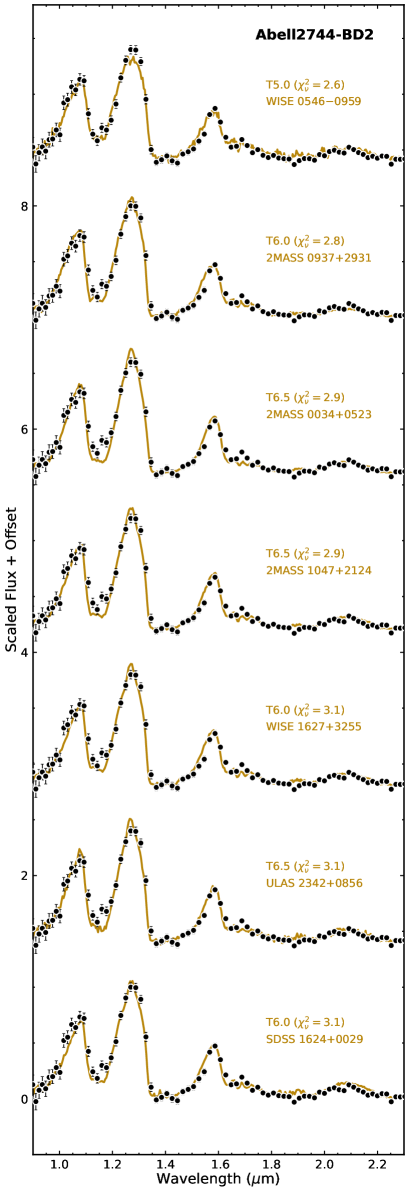
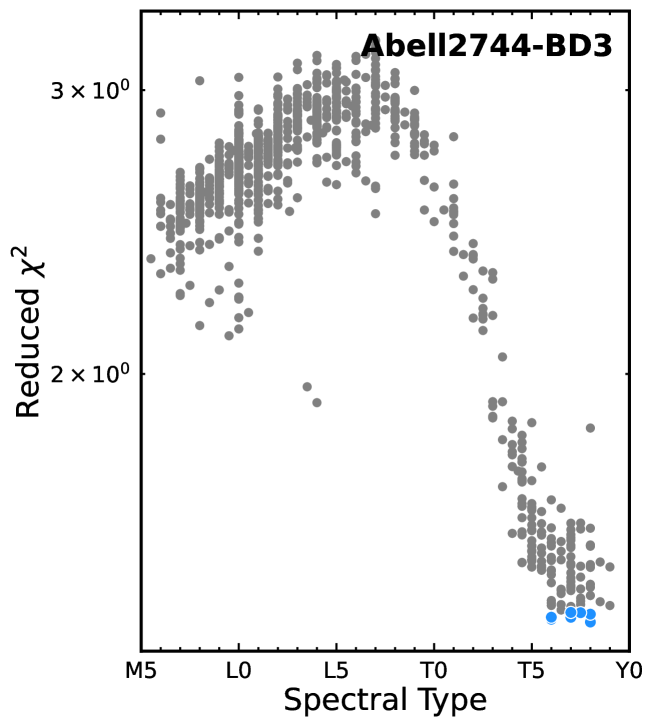
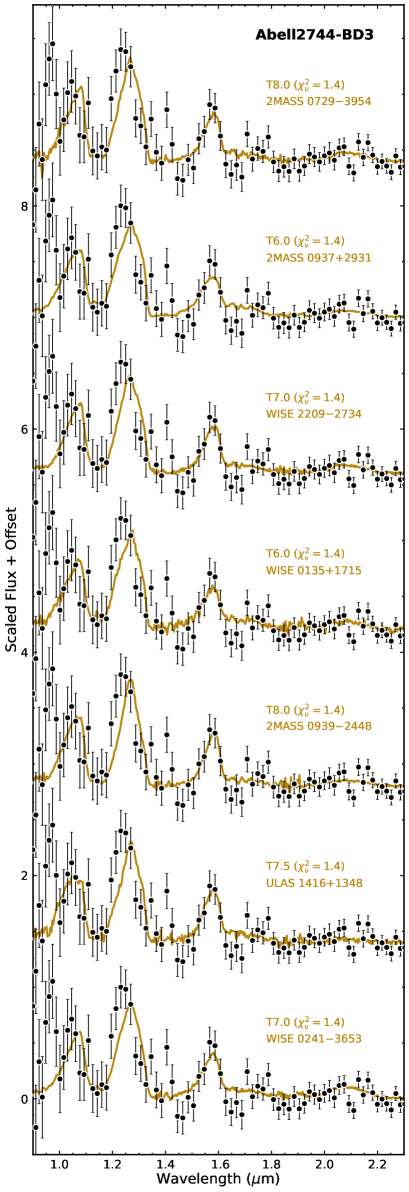
We determine the spectral type of each discovered brown dwarf by comparing its spectrum with a spectroscopically uniform library of brown dwarfs with known spectral types. This library is established using the ground-based IRTF/SpeX spectra of brown dwarfs, following (Zhang et al., 2021). These template spectra have S/N per pixel in the J-band and are likely single objects (as opposed to unresolved binaries). Each spectral template is scaled to minimize the between the science target and the template. The best-matched templates inform the spectral type of the target.
Figures 14-19 in Appendix A show the reduced as a function of spectral type as well as the best-matching spectral types for the brown dwarfs discovered in this work. Abell2744-BD1: the reduced -spectral type diagram (Figure 14) strongly indicates a type T; this is further confirmed through visual inspection of the best-matching templates (Figure 15). Abell2744-BD2: similarly, we classify this sources as a type T (Figures 16 and 17). Abell2744-BD3: The spectral type of this brown dwarf appears to be later than the majority of the templates, suggesting a spectral type later than T5 (Figures 18 and 15).
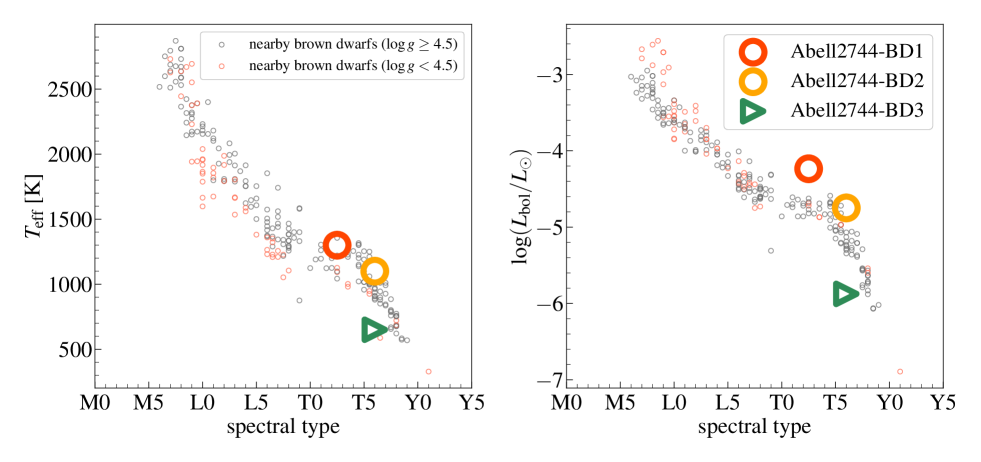
We investigate if the physical properties of the distant brown dwarfs discovered in this work are consistent with those of other brown dwarfs of similar spectral types. This is shown in Figure 12, where we compare the (left) and (right) of Abell2744-BD1, -BD2, and -BD3 with those of a sample of 274 brown dwarfs compiled from Filippazzo et al. (2015), Zhang et al. (2020), and Zhang et al. (2021). Together, Zhang et al. (2020) and Zhang et al. (2021) provide a compilation of all 75 known L6-Y1 benchmark brown dwarfs, sufficiently covering the spectral types of the distant brown dwarfs discovered here. As shown in Figure 12, our brown dwarfs have effective temperatures and bolometric luminosities consistent with those of the benchmark brown dwarfs with similar spectral types.
As an independent check we estimated the spectral types based on the relation between effective temperature and spectral type from Kirkpatrick et al. (2021) (Figure 22 in that study, similar to Figure 12 here), adopting the classification of Kirkpatrick et al. (2010). This relation is consistent with our template fitting and suggests that Abell2744-BD1 is an L8-L9 spectral type, close to the border between the L- and T-types; Abell2744-BD2 is a T5 type; and Abell2744-BD3 is a T8-T9 type, close to the border between T- and Y-types.
4 Brown Dwarfs as Contaminants in NIRCam-Selected AGNs
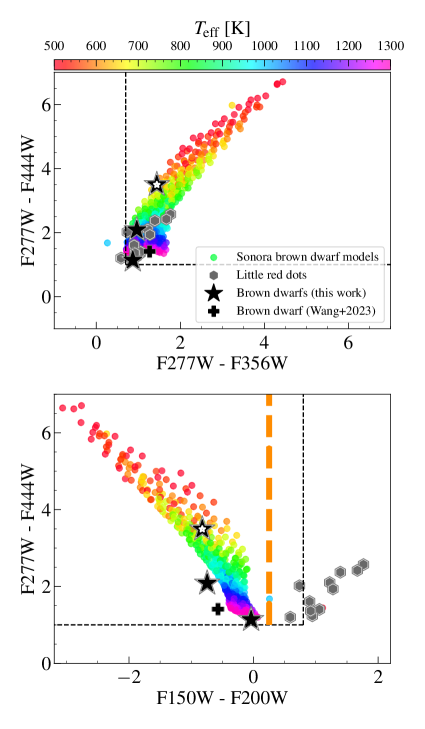
As shown in Section 2, three out of the 14 targeted NIRCam-selected little red dots turned out to be brown dwarfs. Moreover, another three spectra correspond to the triply imaged AGN Abell2744-QSO1 (Furtak et al., 2023a, b). This results in a 3/12 25% brown dwarf contamination fraction in NIRCam-selected highly reddened AGN, if the color selection criteria of Labbe et al. (2023) are adopted 222Either “criteria 1” = (F115W–F150W mag) & (F200W–F277W mag) & (F200W–F356W mag); or “criteria 2” = (F150W–F200W mag) & (F277W–F356W mag) & (F277W–F444W mag). These selection criteria are shown in Figure 13 as the thin dashed lines..
The reason for this high contamination rate becomes clear when considering the distribution of brown dwarfs and highly-reddened AGN in the F277WF444W vs. F277WF356W color-color diagram. This is shown in the top panel of Figure 13, where the Sonora brown dwarf models are color-coded with their effective temperatures and the NIRCam-selected highly-reddened AGN candidates from Labbe et al. (2023) (that did not turn out to be brown dwarfs) are shown as grey hexagons (we are only showing the sources which were spectroscopically followed-up). The dashed lines indicate the selection criteria of Labbe et al. (2023). As brown dwarfs become warmer, they resemble more closely the location of little red dots in this diagram.
The top panel of Figure 13 shows that it would be difficult to distinguish between the brown dwarfs warmer than K and highly-reddened AGN solely based on the F277WF444W vs. F277WF356W diagram. This is the case for two of the brown dwarfs discovered in this work with effective temperatures above 1100 K, as shown by the black stars. However, since the m feature in the spectra of brown dwarfs becomes stronger with decreasing temperature, the extremely red mid-infrared colors of brown dwarfs at effective temperatures below 700 K become difficult to replicate by highly-reddened AGN. This can help minimize the contamination of brown dwarfs in the NIRCam selection of little red dots.
The bottom panel in Figure 13 shows the distribution of brown dwarfs and little red dots on the F150WF200W vs. F277WF444W color-color diagram. Like the top panel, as brown dwarfs become warmer they resemble the colors of the little red dots more closely. However, brown dwarfs never seem to match the colors of the little red dots in this diagram: in the near-infrared filters, brown dwarfs are in general much bluer than the highly-reddened AGN. This can be leveraged to minimize the brown dwarf contamination in color-selected samples of highly obscured AGNs. The AGN selection criteria (e.g., like those of Labbe et al., 2023) can be supplemented with a simple color cut at F150WF200W = 0.25 mag to distinguish the brown dwarfs from highly-reddened AGN; objects with F150WF200W 0.25 mag should be classified as brown dwarfs. This color cut is shown as the dashed orange line in Figure 13.
The above selection criteria seem more intuitive in the context of the inferred UV slopes of color-selected highly-reddened AGNs. If brown dwarfs are misclassified as high-redshift sources, their extremely blue near-infrared colors (F150WF200W 0.25 mag) can yield UV slopes that are much steeper than . For instance, Abell2744-BD2 was classified as a source with a UV slope of (Labbe et al., 2023). Such steep slopes are widely considered unphysical, as they cannot be reproduced even with un-reddened spectra (i.e., 100% escape fraction) of extremely young and metal-poor stars (see, e.g., Topping et al., 2022).
5 Conclusion
We analyzed the NIRSpec multi-object prism follow-ups of a NIRCam-selected sample of 14 candidate highly-reddened AGNs. We identified three sources as brown dwarfs with effective temperatures between 650 and 1300 K and distances between 0.8 and 4.8 kpc. Abell2744-BD1 at 4.8 kpc is the most distant brown dwarf discovered to date; its distance and Galactic latitude place it out of the thin disk of the Milky Way. We confirm the remaining 11 objects as extragalactic sources at . This corresponds to a 25% brown dwarf contamination fraction in NIRCam-selected samples of little red dots. The NIRCam photometry shows that brown dwarfs are in general much bluer than highly-reddened AGNs in near-infrared filters. This indicates that a simple near-infrared color cut at F150WF200W = 0.25 mag can minimize the brown dwarf contamination in NIRCam selection of highly-reddened AGNs: objects with F150WF200W 0.25 mag should be classified as brown dwarfs.
Following the submission of this work, an independent analysis conducted by Burgasser et al. (2023) appeared, in general agreement with our findings. We also note that following the submission of this work, Holwerda et al. (2023) reported the spectroscopic discovery of a candidate brown dwarf in CEERS NIRSpec prism spectroscopy (MSA ID 1558). We reduced the CEERS data (see Langeroodi & Hjorth, 2023) and find that the candidate appears to be substantially hotter than the maximum temperature of the Sonora brown dwarf models (1300 K).
Acknowledgments
We express our gratitude to the UNCOVER team (PIs: Labbe and Bezanson) for designing the NIRCam survey of the Abell 2744 field, the initial selection of the red compact sources, and conducting the NIRSpec follow-ups. We are indebted to Zhoujian Zhang for his swift assistance with spectral typing the brown dwarfs and his guidance in preparing Figures 11 and 12. The authors were supported by a VILLUM FONDEN Investigator grant (project number 16599). The JWST data presented in this paper were obtained from the Mikulski Archive for Space Telescopes (MAST) at the Space Telescope Science Institute. The specific observations analyzed can be accessed via http://dx.doi.org/10.17909/8enx-3310 (catalog DOI).
References
- Barro et al. (2023) Barro, G., Perez-Gonzalez, P. G., Kocevski, D. D., et al. 2023, arXiv e-prints, arXiv:2305.14418, doi: 10.48550/arXiv.2305.14418
- Beiler et al. (2023) Beiler, S. A., Cushing, M. C., Kirkpatrick, J. D., et al. 2023, ApJ, 951, L48, doi: 10.3847/2041-8213/ace32c
- Bertin & Arnouts (1996) Bertin, E., & Arnouts, S. 1996, A&AS, 117, 393, doi: 10.1051/aas:1996164
- Best et al. (2020) Best, W. M. J., Dupuy, T. J., Liu, M. C., Siverd, R. J., & Zhang, Z. 2020, The UltracoolSheet: Photometry, Astrometry, Spectroscopy, and Multiplicity for 3000+ Ultracool Dwarfs and Imaged Exoplanets, 1.0.1, Zenodo, doi: 10.5281/zenodo.4570814
- Bezanson et al. (2022) Bezanson, R., Labbe, I., Whitaker, K. E., et al. 2022, arXiv e-prints, arXiv:2212.04026, doi: 10.48550/arXiv.2212.04026
- Bogdan et al. (2023) Bogdan, A., Goulding, A., Natarajan, P., et al. 2023, arXiv e-prints, arXiv:2305.15458, doi: 10.48550/arXiv.2305.15458
- Bowler et al. (2015) Bowler, R. A. A., Dunlop, J. S., McLure, R. J., et al. 2015, MNRAS, 452, 1817, doi: 10.1093/mnras/stv1403
- Brammer (2022) Brammer, G. 2022, msaexp: NIRSpec analyis tools, 0.3.4, Zenodo, Zenodo, doi: 10.5281/zenodo.7299500
- Burgasser (2014) Burgasser, A. J. 2014, in Astronomical Society of India Conference Series, Vol. 11, Astronomical Society of India Conference Series, 7–16, doi: 10.48550/arXiv.1406.4887
- Burgasser et al. (2023) Burgasser, A. J., Gerasimov, R., Bezanson, R., et al. 2023, arXiv e-prints, arXiv:2308.12107, doi: 10.48550/arXiv.2308.12107
- Bushouse et al. (2023) Bushouse, H., Eisenhamer, J., Dencheva, N., et al. 2023, JWST Calibration Pipeline, 1.10.0, Zenodo, doi: 10.5281/zenodo.7795697
- Calissendorff et al. (2023) Calissendorff, P., De Furio, M., Meyer, M., et al. 2023, ApJ, 947, L30, doi: 10.3847/2041-8213/acc86d
- Cardelli et al. (1989) Cardelli, J. A., Clayton, G. C., & Mathis, J. S. 1989, ApJ, 345, 245, doi: 10.1086/167900
- Carnall et al. (2023) Carnall, A. C., McLure, R. J., Dunlop, J. S., et al. 2023, Nature, 619, 716, doi: 10.1038/s41586-023-06158-6
- Endsley et al. (2023) Endsley, R., Stark, D. P., Whitler, L., et al. 2023, MNRAS, 524, 2312, doi: 10.1093/mnras/stad1919
- Ferruit et al. (2022) Ferruit, P., Jakobsen, P., Giardino, G., et al. 2022, A&A, 661, A81, doi: 10.1051/0004-6361/202142673
- Filippazzo et al. (2015) Filippazzo, J. C., Rice, E. L., Faherty, J., et al. 2015, ApJ, 810, 158, doi: 10.1088/0004-637X/810/2/158
- Finkelstein et al. (2022a) Finkelstein, S. L., Bagley, M., Song, M., et al. 2022a, ApJ, 928, 52, doi: 10.3847/1538-4357/ac3aed
- Finkelstein et al. (2022b) Finkelstein, S. L., Bagley, M. B., Ferguson, H. C., et al. 2022b, arXiv e-prints, arXiv:2211.05792, doi: 10.48550/arXiv.2211.05792
- Furtak et al. (2023a) Furtak, L. J., Zitrin, A., Plat, A., et al. 2023a, ApJ, 952, 142, doi: 10.3847/1538-4357/acdc9d
- Furtak et al. (2023b) Furtak, L. J., Labbé, I., Zitrin, A., et al. 2023b, arXiv e-prints, arXiv:2308.05735, doi: 10.48550/arXiv.2308.05735
- Furtak et al. (2023c) Furtak, L. J., Zitrin, A., Weaver, J. R., et al. 2023c, MNRAS, 523, 4568, doi: 10.1093/mnras/stad1627
- Greenbaum et al. (2023) Greenbaum, A. Z., Llop-Sayson, J., Lew, B. W. P., et al. 2023, ApJ, 945, 126, doi: 10.3847/1538-4357/acb68b
- Greene et al. (2023) Greene, J. E., Labbe, I., Goulding, A. D., et al. 2023, arXiv e-prints, arXiv:2309.05714, doi: 10.48550/arXiv.2309.05714
- Hainline et al. (2023) Hainline, K. N., Helton, J. M., Johnson, B. D., et al. 2023, Brown Dwarf Candidates in the JADES and CEERS Extragalactic Surveys. https://arxiv.org/abs/2309.03250
- Harikane et al. (2023) Harikane, Y., Zhang, Y., Nakajima, K., et al. 2023, arXiv e-prints, arXiv:2303.11946, doi: 10.48550/arXiv.2303.11946
- Holwerda et al. (2023) Holwerda, B. W., Hsu, C.-C., Hathi, N., et al. 2023, arXiv e-prints, arXiv:2309.05835, doi: 10.48550/arXiv.2309.05835
- Johnson (2019) Johnson, B. D. 2019, SEDPY: Modules for storing and operating on astronomical source spectral energy distribution, Astrophysics Source Code Library, record ascl:1905.026. http://ascl.net/1905.026
- Juodžbalis et al. (2023) Juodžbalis, I., Conselice, C. J., Singh, M., et al. 2023, MNRAS, 525, 1353, doi: 10.1093/mnras/stad2396
- Karalidi et al. (2021) Karalidi, T., Marley, M., Fortney, J. J., et al. 2021, ApJ, 923, 269, doi: 10.3847/1538-4357/ac3140
- Kirkpatrick et al. (2010) Kirkpatrick, J. D., Looper, D. L., Burgasser, A. J., et al. 2010, ApJS, 190, 100, doi: 10.1088/0067-0049/190/1/100
- Kirkpatrick et al. (2011) Kirkpatrick, J. D., Cushing, M. C., Gelino, C. R., et al. 2011, ApJS, 197, 19, doi: 10.1088/0067-0049/197/2/19
- Kirkpatrick et al. (2021) Kirkpatrick, J. D., Gelino, C. R., Faherty, J. K., et al. 2021, ApJS, 253, 7, doi: 10.3847/1538-4365/abd107
- Kocevski et al. (2023) Kocevski, D. D., Onoue, M., Inayoshi, K., et al. 2023, arXiv e-prints, arXiv:2302.00012, doi: 10.48550/arXiv.2302.00012
- Kokorev et al. (2023) Kokorev, V., Fujimoto, S., Labbe, I., et al. 2023, arXiv e-prints, arXiv:2308.11610, doi: 10.48550/arXiv.2308.11610
- Labbe et al. (2023) Labbe, I., Greene, J. E., Bezanson, R., et al. 2023, arXiv e-prints, arXiv:2306.07320, doi: 10.48550/arXiv.2306.07320
- Langeroodi & Hjorth (2023) Langeroodi, D., & Hjorth, J. 2023, arXiv e-prints, arXiv:2307.06336, doi: 10.48550/arXiv.2307.06336
- Larson et al. (2023) Larson, R. L., Finkelstein, S. L., Kocevski, D. D., et al. 2023, arXiv e-prints, arXiv:2303.08918, doi: 10.48550/arXiv.2303.08918
- Maiolino et al. (2023a) Maiolino, R., Scholtz, J., Witstok, J., et al. 2023a, arXiv e-prints, arXiv:2305.12492, doi: 10.48550/arXiv.2305.12492
- Maiolino et al. (2023b) Maiolino, R., Scholtz, J., Curtis-Lake, E., et al. 2023b, arXiv e-prints, arXiv:2308.01230, doi: 10.48550/arXiv.2308.01230
- Marley et al. (2021) Marley, M. S., Saumon, D., Visscher, C., et al. 2021, ApJ, 920, 85, doi: 10.3847/1538-4357/ac141d
- Matthee et al. (2023) Matthee, J., Naidu, R. P., Brammer, G., et al. 2023, arXiv e-prints, arXiv:2306.05448, doi: 10.48550/arXiv.2306.05448
- Nonino et al. (2023) Nonino, M., Glazebrook, K., Burgasser, A. J., et al. 2023, ApJ, 942, L29, doi: 10.3847/2041-8213/ac8e5f
- Oke & Gunn (1983) Oke, J. B., & Gunn, J. E. 1983, ApJ, 266, 713, doi: 10.1086/160817
- Onoue et al. (2023) Onoue, M., Inayoshi, K., Ding, X., et al. 2023, ApJ, 942, L17, doi: 10.3847/2041-8213/aca9d3
- Schlafly & Finkbeiner (2011) Schlafly, E. F., & Finkbeiner, D. P. 2011, ApJ, 737, 103, doi: 10.1088/0004-637X/737/2/103
- Stern et al. (2012) Stern, D., Assef, R. J., Benford, D. J., et al. 2012, ApJ, 753, 30, doi: 10.1088/0004-637X/753/1/30
- Topping et al. (2022) Topping, M. W., Stark, D. P., Endsley, R., et al. 2022, ApJ, 941, 153, doi: 10.3847/1538-4357/aca522
- Übler et al. (2023) Übler, H., Maiolino, R., Curtis-Lake, E., et al. 2023, arXiv e-prints, arXiv:2302.06647, doi: 10.48550/arXiv.2302.06647
- Virtanen et al. (2020) Virtanen, P., Gommers, R., Oliphant, T. E., et al. 2020, Nature Methods, 17, 261, doi: 10.1038/s41592-019-0686-2
- Wang et al. (2023) Wang, P.-Y., Goto, T., Ho, S. C. C., et al. 2023, MNRAS, 523, 4534, doi: 10.1093/mnras/stad1679
- Wilkins et al. (2014) Wilkins, S. M., Stanway, E. R., & Bremer, M. N. 2014, MNRAS, 439, 1038, doi: 10.1093/mnras/stu029
- Yang et al. (2023) Yang, G., Caputi, K. I., Papovich, C., et al. 2023, ApJ, 950, L5, doi: 10.3847/2041-8213/acd639
- Zhang et al. (2021) Zhang, Z., Liu, M. C., Best, W. M. J., Dupuy, T. J., & Siverd, R. J. 2021, ApJ, 911, 7, doi: 10.3847/1538-4357/abe3fa
- Zhang et al. (2020) Zhang, Z., Liu, M. C., Hermes, J. J., et al. 2020, ApJ, 891, 171, doi: 10.3847/1538-4357/ab765c
Appendix A Determining the Spectral Types of Brown Dwarfs
Here we present the reduced vs spectral type as well as the best-matching spectral types for the brown dwarfs discovered in this work (see Section 3 for more details).