UV Luminosity Density Results at from the First JWST/NIRCam Fields: Limitations of Early Data Sets and the Need for Spectroscopy
Abstract
We have derived luminosity functions, and set constraints on the UV luminosity and SFR density from to , using the three most-studied JWST/NIRCam data sets, the SMACS0723, GLASS Parallel, and CEERS fields. We first used our own selections on two independent reductions of these datasets using the latest calibrations. 18 , 12 , 5 , and 1 candidate galaxies are identified over these fields in our primary reductions, with a similar number of candidates in our secondary reductions. We then use these two reductions, applying a quantitative discriminator, to segregate the full set of candidates reported over these fields from the literature, into three different samples, “robust,” “solid,” and “possible”. Using all of these samples we then derive LF and luminosity density results at , finding substantial differences. For example, including the full set of “solid” and “possible” candidates from the literature, we find luminosity densities which are 7 and 20 higher than relying on the “robust” candidates alone. These results indicate the evolution of the LF and luminosity densities at is still extremely uncertain, emphasizing the need for spectroscopy and deeper NIRCam+optical imaging to obtain reliable results. Nonetheless, even with the very conservative “robust” approach to selections, both from our own and those of other studies, we find the luminosity density from luminous () galaxies to be 2 larger than is easily achievable using constant star-formation efficiency models, similar to what other early JWST results have suggested.
keywords:
galaxies: evolution – galaxies: high-redshift – dark ages, reionization, first stars1 Introduction
One particularly interesting long-standing question in extragalactic astronomy has been "how early did massive galaxies begun to assemble?". While this question had been the subject of many investigation prior to the start of James Webb Space Telescope (JWST) operations (Rigby et al., 2022), with inferences being made both using very high redshift luminosity functions (e.g., Bouwens et al., 2016, 2019; Bouwens et al., 2022c; Oesch et al., 2018; Stefanon et al., 2019; Bowler et al., 2020; Finkelstein et al., 2022c; Kauffmann et al., 2022; Harikane et al., 2022; Donnan et al., 2023) and leveraging constraints on the stellar mass in sources (e.g., Duncan et al., 2014; Grazian et al., 2015; Song et al., 2016; Bhatawdekar et al., 2019; Kikuchihara et al., 2020; Furtak et al., 2021; Stefanon et al., 2021, 2023), early JWST investigations are already demonstrating the revolutionary potential of JWST for addressing the early galaxy assembly timescale (e.g. Adams et al., 2023; Naidu et al., 2022b; Castellano et al., 2022; Donnan et al., 2023; Atek et al., 2023; Morishita & Stiavelli, 2022; Finkelstein et al., 2022c; Harikane et al., 2022; Bouwens et al., 2022a; Robertson et al., 2022).
These early studies have have returned very luminous and seemingly robust sources at -13 (e.g. Naidu et al., 2022b; Castellano et al., 2022; Finkelstein et al., 2022a; Bouwens et al., 2022a), and have also identified candidates out to redshifts as high as -20 (e.g. Donnan et al., 2023; Atek et al., 2023; Harikane et al., 2023; Naidu et al., 2022a; Zavala et al., 2023; Yan et al., 2023; Finkelstein et al., 2022b). At the same time, some very massive sources have been identified at on the basis of what appear to be substantial Balmer breaks (Labbe et al., 2022), suggesting substantial early mass assembly in the universe. These results are enigmatic, however, potentially exceeding the available baryons to form stars at (Boylan-Kolchin, 2022; Naidu et al., 2022a , but see also Steinhardt et al., 2022; Inayoshi et al., 2022; Harikane et al., 2023).
Despite this flurry of new high-redshift sources, there have been substantial differences in the candidate galaxy samples identified in different studies over the same fields. The typical overlap between candidate lists in the earliest analyses were only 10-20% (at least in the initial versions of these papers).111https://twitter.com/stewilkins/status/1554909423759409153 Broadly such differences can be indicative either of substantial contamination in selections or high levels of incompleteness.222For example, in cases where source selection is 80% complete, different selections should overlap at 65% level. Conversely, if source overlap between selections is less than 20%, then the completeness of individual selections cannot be generally higher than 50%. In either case, the inferred luminosity function results could be substantially mis-estimated (by 0.3-0.5 dex). Overall, this entire issue poses a major challenge as we try to understand what is really happening in the first 400-500 Myr at where JWST can provide unique new insights into galaxy buildup.
The primary purpose of the present paper is to investigate the evolution of of the UV luminosity density and star formation rate density for galaxies at from early JWST data sets, while looking closely at the overall range of constraints allowed based on current observations. Key to doing this in a quantitative way is to provide an assessment of the first selections of candidate galaxies over the first JWST data sets and any updates to these selections that have become possible due to improvements e.g. from improved zeropoint calibrations (e.g Adams et al., 2023), and to identify approaches that lead to the most robust samples.
To this end, we will make use of two independent, recent reductions of the available JWST data that use the latest calibrations and experience in dealing with artifacts, over the three most well-studied fields, the SMACS0723 cluster (Pontoppidan et al., 2022), four NIRCam pointings from the Cosmic Evolution Early Release Science (CEERS) fields (Finkelstein et al., 2022b), and the NIRCam GLASS parallel field (Treu et al., 2022). Not only do select our own set of candidates from these fields, but we also make an assessment of essentially all candidates from previous studies of these same fields, to gauge how well individual selections appear to be working and to characterize potential progress. In doing so, we present community LF results, showing the impact of including candidates of various quality on the LF and luminosity density results at . We will also investigate the extent to which an emergent picture is forming on the basis of the latest results from the collective analyses.
The plan for this paper will be as follows. In §2, we summarize the data sets utilized in this paper and our procedure for performing photometry of sources in those data sets. In §3, we present our procedure for selecting sources from the data sets we examine, the -17 samples we derive, and our , 10, 13, and 17 LF results, while performing a detailed assessment of other candidate -17 galaxies in the recent literature. In §4, we use those results to derive LF results based on our own selections and our commmunity samples, discuss the results in §5, and then provide a summary in §6. For convenience, the HST F435W, F475W, F606W, F814W, F098M, F125W, F140W, and F160W filters are written as , , , , , and , respectively, throughout this work. Also we quote results in terms of the approximate characteristic luminosity derived at by Steidel et al. (1999), Reddy & Steidel (2009), and many other studies. A Chabrier (2003) initial mass function is assumed throughout. For ease of comparison to other recent extragalactic work, we assume a concordance cosmology with , , and throughout. All magnitude measurements are given using the AB magnitude system (Oke & Gunn, 1983) unless otherwise specified.
| Depths (AB mag)a | |||
|---|---|---|---|
| Filter | SMACS0723 | GLASS-P | CEERS |
| HST/F435W | 26.8 | — | 28.4 |
| HST/F606W | 27.6 | 28.6 | 28.6 |
| HST/F775W | — | 28.3 | — |
| HST/F814W | 27.2 | — | 28.4 |
| JWST/F090W | 28.7 | 28.9 | — |
| HST/F105W | 26.9 | — | 26.9 |
| JWST/F115W | 27.6 | 28.9 | 28.7 |
| HST/F125W | 26.2 | — | 26.8 |
| HST/F140W | 26.4 | — | 26.2 |
| HST/F160W | 26.4 | — | 27.2 |
| JWST/F150W | 29.1 | 28.9 | 28.9 |
| JWST/F200W | 29.3 | 29.0 | 29.2 |
| JWST/F277W | 29.5 | 29.3 | 29.0 |
| JWST/F356W | 29.4 | 29.2 | 28.9 |
| JWST/F410M | — | — | 28.1 |
| JWST/F444W | 29.1 | 29.5 | 28.4 |
| Area [arcmin2] | 9.5 | 7.0 | 33.8 |
a These depths include a correction for the flux in point sources lying outside a 0.35-diameter aperture and thus correspond to the total magnitudes of point sources that would be detected at for a given band.
2 Data Sets and Photometry
2.1 Data Sets
We make use of the three most studied NIRCam data sets in constructing a selection of galaxies from current JWST observations, i.e., the 12-hour SMACS0723 cluster field featured in the JWST early release observations (Pontoppidan et al., 2022), the 4-pointing NIRCam observations taken as part of the CEERS early release science program (Finkelstein et al., 2022b), and the sensitive NIRCam parallel observations as part of the GLASS early release science program (Treu et al., 2022).
These three fields cover a total area of 51 arcmin2. The approximate depths of these data sets reach from 28 to 29.2 mag and are presented in detail in Table 1. These depths are derived by measuring the flux variations in source-free 0.35′′-diameter apertures across our reduced images of each field.
We derived PSFs for the fields by taking a PSF from WebbPSF and then drizzling onto a grid consistent with our NIRCam reductions. The FWHMs for the F090W, F115W, F150W, F200W, F277W, F356W, F410M, and F444W PSFs are 0.06′′, 0.06′′, 0.06′′, 0.07′′, 0.12′′, 0.14′′, 0.15′′, and 0.16′′, respectively. We also extracted empirical PSFs based on isolated, non-saturated stars located across the NIRCam images and obtained consistent results.
Our fiducial reductions of each data set are executed using the grizli software (Brammer et al., 2022). grizli has procedures in place both to minimize the noise and to mask “snowballs” on individual NIRCam frames. grizli combines NIRCam frames using the astrodrizzle software package, after modifying the headers of the frames to use the required SIP WCS headers. The grizli reductions also take advantage of both significantly improved flat fields (and the jwst_0942.pmap calibration files) that became available in early September and the zeropoint adjustments derived by G. Brammer et al. (2022, in prep).
To better understand possible systematics and how they impact the selection of star-forming galaxies at , we also make use of the NIRCam imaging pipeline pencil (Magee et al. 2022, in prep) built for the PRIMER team (PI: Dunlop). This pipeline leverages STScI’s JWST Calibration pipeline (v1.6.2), but also includes additional processing steps which are not part of the standard calibration pipeline. This includes the subtraction of noise striping patterns (both vertical and horizontal) that are not fully removed by the standard calibration pipeline and the subtraction of “wisps” artifacts from the short wavelength filters F150W and F200W in the NRCA3, NRCB3, and NRCB4 detector images.
Additionally, the background sky subtraction is performed by subtracting the median background over a NN grid while using a segmentation map to mask pixels attributed to sources. Image alignment is executed in two passes using the calibration pipeline’s TweakReg step and then using STScI python package TweakWCS: the first pass uses TweakReg to group overlapping images for each detector/filter and perform an internal alignment within the detector/filter group; the second performs alignment against an external catalog using TweakWCS. The external catalog is, if possible, generated from an HST ACSWFC image mosaic which has been registered to the GAIA DR3 catalog.
Finally, the Pencil reductions we utilize take advantage of calibration files (jwst_1009.pmap) which have been updated to reflect new in-flight photometric zeropoints.333https://www.stsci.edu/contents/news/jwst/2022/an-improved-nircam-flux-calibration-is-now-available.html Before the final NIRCam image mosaics are generated using the calibration pipeline calweb_image3 stage, we perform an additional step to identify and mask “snowball” artifacts that are not identified and masked during the calweb_detector1 stage.
For the HST Advanced Camera for Surveys (ACS) and Wide Field Camera 3 near-IR (WFC3/IR) observations over SMACS0723, GLASS parallel field, and CEERS Extended Groth Strip (EGS) field, we made use of a reduction of the data generated by grizli for our fiducial set of reductions made with grizli. For the alternate set of reductions made with pencil, we used reductions made with astrodrizzle for the SMACS023 and GLASS parallel fields, following many of the same procedures used in the product of the XDF data set (Illingworth et al., 2013). Finally, for the CEERS EGS field, we made use of the ACS and WFC3/IR data products made available by CEERS team prior to the start of science observations by JWST.
2.2 Source Detection and Photometry
As in previous efforts by our team (e.g. Bouwens et al., 2011, 2015, 2019, 2021; Bouwens et al., 2022c), we perform source detection and photometry using SExtractor (Bertin & Arnouts, 1996). For our F090W, F115W, F150W, and F200W dropout selections, source detection is performed using the square root of image constructed by coadding PSF-matched F200W, F277W, F356W, and F444W data over the fields. PSF matching is done using our own implementation of the Lucy-Richardson deconvolution algorithm (Richardson, 1972; Lucy, 1974).
Color measurements for sources are made based on the measured flux in 0.35′′-diameter apertures, after PSF-correcting the shorter wavelength data to match the PSF in the F444W band. These measurements are then corrected to total using (1) the additional flux in scalable Kron (1980) apertures with Kron factor of 2.5 and (2) using the estimated flux outside these scalable apertures based on the encircled energy distribution in the derived PSFs.
Finally, a foreground dust correction based on extinction maps of Schlafly & Finkbeiner (2011) is applied to colors and total magnitude measurements.
3 Source Selections
3.1 Lyman Break Selections
We make use of two-color Lyman break selections to identify galaxies from the JWST data of the three fields identified above. Lyman-break selections have been shown to be a very efficient way of identifying star-forming galaxies in the distant universe (e.g., Steidel et al., 1999; Bouwens et al., 2011, 2015, 2021; Schenker et al., 2013) and largely lie at the redshifts targeted by Lyman-break selections, given adequate S/N and bands either side of the break (e.g. Steidel et al., 1999, 2003; Stark et al., 2010; Ono et al., 2012; Finkelstein et al., 2013; Oesch et al., 2015; Zitrin et al., 2015; Oesch et al., 2016; Hashimoto et al., 2018; Jiang et al., 2021).
In devising color-color criteria for our selection, we follow the strategy employed in Bouwens et al. (2015, 2021) and make use of a two-color selection criterion, the first color probing the Lyman break and the second color probing the color of the -continuum just redward of the break. In choosing the passbands to utilize for this second color, we select bands which show no overlap with either the Lyman or Balmer breaks, ensuring that our selection would include even sources with prominent Balmer breaks, as Labbe et al. (2022) find at -10.
After some experimentation, we made use of the following two color criteria:
for our nominal selection,
for our nominal selection,
for our nominal selection, and
for our nominal selection. In cases where sources are undetected in a given band, flux is set to the limit when applying the selection criteria. As we show below, when we discuss the redshift selection functions, these nominal redshift selections are better characterized as selections with , , and (the approximate half-power points of the redshift selection functions).
Given the significant variation in the composition of various selections in the literature, we have purposefully required that sources show especially large Lyman breaks to maximize the robustness of the sources we select. The presence of a large spectral break is perhaps the most model-independent feature of star-forming galaxy at very high redshifts and will significantly less sensitive to uncertainties in the NIRCam zeropoints than photometric redshift codes that rely on fits to the spectral energy distribution. As in Bouwens et al. (2015), sources are excluded from a Lyman break selection, if they meet the selection criteria of a higher-redshift sample.
Additionally, we require that sources show no significant flux blueward of the break. For this, we co-add the flux blueward of candidate Lyman breaks using the statistic defined in Bouwens et al. (2011, 2015) and which is equal to where is the flux in band in a consistent aperture, is the uncertainty in this flux, and SGN() represents the nominal "sign" function from mathematics, being equal to 1 if and if . Included in this statistic for the following redshift selections are the following bands:
Sources are excluded from our selection if the statistics in -diameter, -diameter, or scalable Kron apertures (using a Kron parameter of 1.2) exceeds 4, 6, 7, 8, and 9, when combining data from 1, 2, 3, 4, and 5 bands, respectively.
To ensure that sources in our selection corresponded to real objects, we require that sources be detected at 6 in a stack of all bands redward of the break in a 0.35′′-diameter aperture. We also require sources to be detected at in the band just redward of the break to ensure that the break is present at high significance. Sources are also required to be detected at 3.5 in at least 5, 4, 4, and 3, independent bands redward of the Lyman-break in our , , , and selections.
Following our selection of candidate -17 sources using the above criteria, redshift likelihood functions were computed for each source using the EAZY photometric redshift code (Brammer et al., 2008). In fitting the photometry of individual sources, use of spectral templates from the EAZY_v1.0 set and Galaxy Evolutionary Synthesis Models (GALEV: Kotulla et al., 2009) was made. Nebular continuum and emission lines were added to the templates according to the prescription provided in Anders & Fritze-v. Alvensleben (2003), a metallicity, and scaled to a rest-frame EW for H of 1300Å. Sources are only retained in our selections, if 80% of the integrated redshift likelihood is at , i.e., .
Finally, all candidate galaxies are visually examined to exclude any sources associated with diffraction spikes, on the wings of early type galaxies, or in regions of the images with elevated background levels.
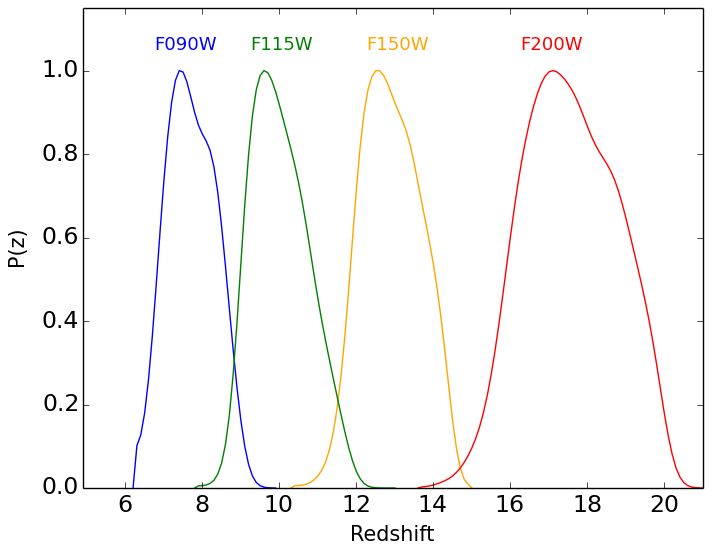
The approximate redshift distributions of these selections are illustrated in Figure 2 and derived using our selection volume simulations described in §4.1. Using these selection volume simulations, the mean redshifts inferred for our F090W, F115W, F150W, and F200W dropout selections are equal to 7.7, 10.0, 12.9, and 17.6, hence our nominal use of , , , and to identify these samples throughout our paper.
3.2 Selections
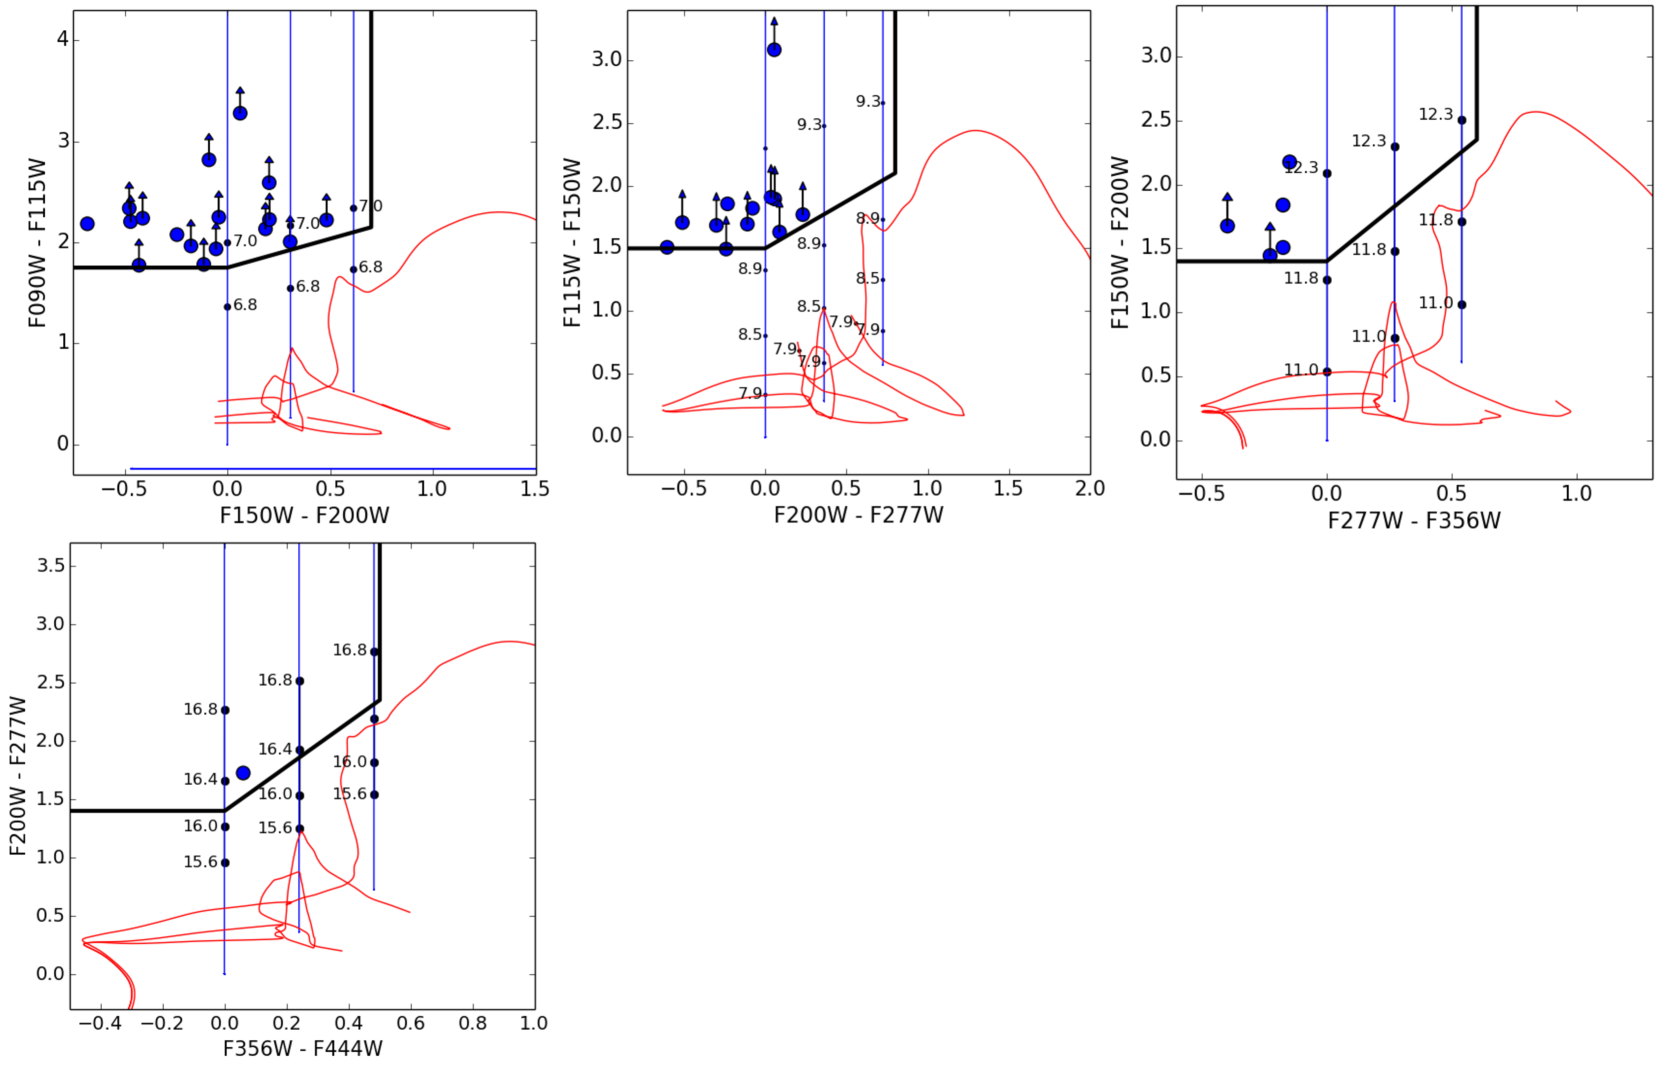
Applying our selection criteria to our fiducial reductions using grizli, we identify 18 , 12 , 5 , and 1 galaxies which satisfy all of our selection criteria. The apparent magnitude of these sources range from 25.8 to 28.4 mag. A list of these sources is presented in Table 2 and will be known as our primary selection. Figure 1 shows the colors of our selected -17 sources relative to the two color criteria we utilize.
We also indicate in Table 2 which sources from our selections lie in earlier selections. Encouragingly, 67% of the candidates from our selection lie in previous selections. This is a significantly higher level of overlap than was the case for the first set of selections from the SMACS0723, CEERS, and Abell 2744 parallel data sets, thanks to the slightly more complete selections of sources in Finkelstein et al. (2022b) and Donnan et al. (2023 , v2) taking advantage of a much improved NIRCam zeropoint calibration.
We also pursue an alternate selection of galaxies based on our NIRCam reductions using the pencil pipeline. We identify 22 , 13 , 3 , and 1 galaxy candidates in that selection. Table 10 in Appendix A provides the coordinates, estimated redshifts, magnitudes, constraints on the Lyman break amplitudes, and estimated likelihood to lie at .
Comparing our two selections, we find 47% of the sources in our primary selection are also present in our alternate selection, while 38% of the sources in our alternate selection also occur in our primary selection. The percentage overlap between our selections is similar to the 50% overlap frequently seen between different -8 selections executed over the Hubble Ultra Deep Field with HST data (see §3.4 of Bouwens et al. 2015 for a discussion). The existence of differences between the two selections is not surprising given our use of two different reductions of the data to identify sources and measure fluxes.
In an effort to better understand why there is only modest overlap between the two selections, we compared the photometry of sources in catalogs where they are selected vs. where they are not selected. We found that most of the observed differences could be explained by variations in the size of the spectral breaks for selected sources and the apparent flux blueward of the nominal spectral breaks.
| Lyman Breaka | b | |||||||
| ID | RA | DEC | [mag] | [mag] | Lit1 | |||
| Selection | ||||||||
| GLASSP1Z-4049020480 | 00:14:04.908 | 30:20:48.04 | 6.7 | 27.90.2 | 2.1 | 5.8 | 0.938 | |
| GLASSP2Z-4027418404 | 00:14:02.740 | 30:18:40.44 | 6.8 | 27.80.2 | 2.4 | 12.1 | 0.996 | B22M |
| GLASSP1Z-4027520346 | 00:14:02.751 | 30:20:34.66 | 7.2 | 28.40.3 | 2.2 | 3.9 | 0.966 | B22M |
| GLASSP1Z-4030120490 | 00:14:03.018 | 30:20:49.03 | 7.2 | 28.20.2 | 2.2 | 6.2 | 0.983 | |
| GLASSP1Z-4047621148 | 00:14:04.769 | 30:21:14.87 | 7.2 | 28.30.3 | 2.2 | 7.7 | 0.993 | |
| GLASSP1Z-4041221456 | 00:14:04.125 | 30:21:45.65 | 7.3 | 28.40.3 | 2.0 | 3.8 | 0.914 | B22M |
| GLASSP1Z-3589121028 | 00:13:58.913 | 30:21:02.82 | 7.4 | 28.00.2 | 2.6 | 13.5 | 1.0 | B22M |
| GLASSP1Z-3581321041 | 00:13:58.136 | 30:21:04.19 | 7.4 | 28.40.2 | 2.0 | 4.8 | 0.962 | B22M |
| GLASSP1Z-4075621492 | 00:14:07.560 | 30:21:49.20 | 7.5 | 28.30.2 | 2.0 | 4.8 | 0.97 | |
| GLASSP1Z-3577921174 | 00:13:57.792 | 30:21:17.44 | 7.6 | 26.40.1 | 2.30.7 | 56.3 | 1.0 | B22M |
| S0723Z-3295626401 | 07:23:29.565 | 73:26:40.17 | 7.6 | 27.70.2 | 2.21.7 | 21.4 | 1.0 | |
| GLASSP1Z-4049021453 | 00:14:04.905 | 30:21:45.36 | 7.6 | 27.00.2 | 2.3 | 2.2 | 0.861 | |
| GLASSP1Z-3575621160 | 00:13:57.567 | 30:21:16.02 | 7.8 | 28.50.2 | 1.9 | 20.0 | 1.0 | Le22 |
| GLASSP1Z-4020821598 | 00:14:02.087 | 30:21:59.85 | 7.8 | 27.20.2 | 2.7 | 8.0 | 0.992 | B22M |
| S0723Z-3201526042 | 07:23:20.159 | 73:26:04.29 | 7.8 | 26.40.1 | 3.2 | 41.1 | 1.0 | D22,At22,Ad22,B22M |
| GLASSP2Z-4016419299 | 00:14:01.649 | 30:19:29.90 | 8.1 | 27.80.2 | 2.3 | 16.7 | 1.0 | |
| S0723Z-3226926062 | 07:23:22.698 | 73:26:06.24 | 8.1 | 25.80.1 | 3.6 | 48.9 | 1.0 | D22,At22,Ad22,B22M |
| GLASSP1Z-4009521308 | 00:14:00.950 | 30:21:30.85 | 8.3 | 27.30.1 | 2.7 | 5.0 | 0.937 | |
| Selection | ||||||||
| CEERSYJ-0012159472 | 14:20:01.212 | 52:59:47.29 | 8.9 | 27.60.3 | 1.7 | 2.2 | 0.86 | F22,B22M |
| CEERSYJ-9345150450 | 14:19:34.516 | 52:50:45.06 | 9.2 | 28.20.3 | 1.51.0 | 10.5 | 0.997 | |
| CEERSYJ-9586559217 | 14:19:58.654 | 52:59:21.77 | 9.2 | 27.10.1 | 1.90.7 | 15.1 | 0.999 | F22,W22 |
| GLASSP1YJ-4003721456 | 00:14:00.378 | 30:21:45.60 | 9.2 | 28.50.2 | 1.6 | 4.1 | 0.953 | B22M |
| CEERSYJ-9203050435 | 14:19:20.300 | 52:50:43.59 | 9.8 | 28.50.3 | 1.7 | 8.9 | 0.989 | |
| CEERSYJ-0012959481 | 14:20:01.290 | 52:59:48.12 | 9.9 | 27.80.3 | 1.8 | 4.1 | 0.952 | F22,B22M |
| CEERSYJ-9149352106 | 14:19:14.935 | 52:52:10.63 | 10.0 | 27.60.2 | 1.82.1 | 4.7 | 0.956 | |
| CEERSYJ-9353350378 | 14:19:35.337 | 52:50:37.87 | 10.2 | 27.90.2 | 1.7 | 14.2 | 0.999 | D22,F22,W22,B22M |
| GLASSP1YJ-4028622186 | 00:14:02.861 | 30:22:18.69 | 10.2 | 26.70.1 | 3.1 | 30.4 | 1.0 | N22,C22,D22,H22,B22M |
| GLASSP1YJ-4002721259 | 00:14:00.278 | 30:21:25.95 | 10.6 | 28.00.2 | 1.9 | 5.6 | 0.975 | D22 |
| CEERSYJ-9026550577 | 14:19:02.654 | 52:50:57.74 | 11.2 | 27.80.2 | 1.6 | 5.7 | 0.968 | |
| GLASSP1YJ-4069421497 | 00:14:06.945 | 30:21:49.73 | 11.2 | 26.80.1 | 1.9 | 3.5 | 0.841 | C22,B22M |
| Selection | ||||||||
| CEERSH-9463556328 | 14:19:46.352 | 52:56:32.82 | 11.6 | 27.70.2 | 1.51.0 | 9.9 | 0.995 | D22,F22,H22,B22M |
| GLASSP2H-3597519291 | 00:13:59.756 | 30:19:29.14 | 12.1 | 26.70.1 | 1.80.2 | 21.6 | 1.0 | N22,C22,D22,H22,B22M |
| S0723H-2522527555 | 07:22:52.258 | 73:27:55.52 | 12.9 | 28.00.2 | 2.22.4 | 4.8 | 0.961 | At22,Y22 |
| GLASSP2H-3576218534 | 00:13:57.627 | 30:18:53.49 | 13.7 | 28.20.2 | 1.4 | 10.2 | 0.996 | |
| S0723H-2394130081 | 07:22:39.416 | 73:30:08.17 | 14.9 | 26.90.1 | 1.7 | 6.4 | 0.971 | At22 |
| Selection | ||||||||
| CEERSK-9394956348 | 14:19:39.491 | 52:56:34.87 | 16.3 | 26.30.1 | 1.70.1 | 8.7 | 0.987 | D22,F22,H22,N22, |
| Z22 | ||||||||
1 Ad22 = Adams et al. (2023), At22 = Atek et al. (2023), C22 = Castellano et al. (2022), D22 = Donnan et al. (2023), F22 = Finkelstein et al. (2022a, b), H22 = Harikane et al. (2023), La22 = Labbe et al. (2022), N22 = Naidu et al. (2022b, a), W22 = Whitler et al. (2023), Y22 = Yan et al. (2023), B22 = This Work (primary selection), B22M = This Work (alternate selection), Z22 = Zavala et al. (2023)
a Amplitude of Lyman break in mag. Lower limits are .
b
| ID | RA | DEC | a | ∗ | Break [mag]b,c | b,d | b | Lit |
| Naidu et al. (2022b) | ||||||||
| GLz11 | 00:14:02.857 | -30:22:18.92 | 10.4/10.2 | 20.7 | 3.1,3.3 | 30.4,33.7 | 1.000,1.000 | C22,D22,H22, |
| B22,B22M | ||||||||
| GLz13 | 00:13:59.754 | -30:19:29.10 | 12.4/12.1 | 21.0 | 1.80.2,2.10.2 | 21.6,20.0 | 1.000,1.000 | C22,D22,H22, |
| B22 | ||||||||
| Adams et al. (2023) | ||||||||
| 6878e | 07:23:26.238 | -73:26:56.97 | 8.5/8.9 | 20.4 | 2.9,2.8 | 26.1,21.3 | 1.000,1.000 | At22,D22,M22 |
| 3602 | 07:23:26.705 | -73:26:10.56 | 9.0/9.5 | 19.5 | 1.4,2.0 | 18.9,20.4 | 1.000,1.000 | D22 |
| 2779 | 07:22:35.053 | -73:28:32.99 | 9.5/9.2 | 19.5 | 2.5,2.6 | 6.6,13.2 | 0.991,1.000 | D22,M22 |
| Atek et al. (2023) | ||||||||
| SMACS_z10b | 07:23:22.697 | -73:26:06.23 | 8.9/8.1 | 20.8 | 3.6,3.9 | 48.9,49.8 | 1.000,1.000 | D22, M22 |
| SMACS_z10c | 07:23:20.158 | -73:26:04.28 | 9.8/7.8 | 20.2 | 3.2,3.42.5 | 41.1,40.3 | 1.000,1.000 | D22 |
| Donnan et al. (2023 , v2) | ||||||||
| 43031 | 07:23:27.846 | -73:26:19.78 | 8.6/7.9 | 18.4 | 2.5,3.0 | 20.7,22.2 | 1.000,1.000 | |
| 22480 | 07:22:45.808 | -73:27:46.57 | 9.7/8.7 | 18.5 | 1.4,1.8 | 10.0,11.2 | 0.997,0.998 | |
| 30585 | 14:19:35.334 | 52:50:37.90 | 10.6/10.2 | 19.4 | 1.7,2.02.5 | 14.2,9.5 | 0.999,0.990 | W22,F22,B22,B22M |
| 32395_2 | 14:19:46.353 | 52:56:32.81 | 12.3/11.6 | 19.9 | 1.51.0,1.51.2 | 9.9,9.1 | 0.995,0.993 | H22,B22,B22M,F22 |
| Donnan et al. (2023 , v1) | ||||||||
| 38681 | 07:23:28.099 | -73:26:20.10 | 8.6/8.0 | 19.4 | 1.8,1.7 | 7.8,9.7 | 0.993,0.996 | |
| Labbe et al. (2022) | ||||||||
| 35300 | 14:19:19.358 | 52:53:16.01 | 9.3/9.4 | 19.0 | 1.4,1.71.5 | 7.8,17.2 | 0.993,1.000 | F22,B22M |
| 14924 | 14:19:30.272 | 52:52:51.01 | 9.9/8.8 | 20.1 | 1.10.5,0.90.5 | 25.1,22.4 | 1.000,1.000 | F22 |
| 16624 | 14:19:22.741 | 52:53:31.60 | 10.0/8.6 | 20.9 | 1.00.2,1.20.2 | 17.7,18.4 | 1.000,1.000 | F22 |
| 21834 | 14:19:36.533 | 52:56:21.76 | 10.8/9.3 | 19.0 | 1.01.5,0.71.3 | 11.4,10.7 | 0.998,0.998 | F22 |
| Harikane et al. (2023 , v1) | ||||||||
| GLz96 | 00:13:57.110 | -30:19:31.53 | 8.7/8.1 | 18.8 | 1.7,1.9 | 9.2,12.8 | 0.993,0.999 | Le22 |
| GLz912 | 00:14:01.896 | -30:18:56.89 | 10.2/10.1 | 18.7 | 1.7,1.9 | 14.6,23.1 | 1.000,1.000 | |
| Whitler et al. (2023) | ||||||||
| EGS39117 | 14:20:02.808 | 52:59:17.91 | 9.0/8.8 | 20.5 | 1.20.1,1.50.2 | 23.1,20.9 | 1.000,1.000 | F22 |
| This Work (Primary Selection) | ||||||||
| GLASSP2H3576218534 | 00:13:57.629 | -30:18:53.43 | 13.7/13.7 | 19.6 | 1.4,1.8 | 10.2,11.3 | 0.996,0.999 | B22M |
| This Work (Secondary Selection) | ||||||||
| GLASSP2Z3553419246 | 00:13:55.345 | -30:19:24.63 | 8.6/8.3 | 19.8 | 2.11.1,3.0 | 15.9,22.1 | 1.000,1.000 | |
1 Ad22 = Adams et al. (2023), At22 = Atek et al. (2023), C22 = Castellano et al. (2022), D22 = Donnan et al. (2023), F22 = Finkelstein et al. (2022a, b), H22 = Harikane et al. (2023), La22 = Labbe et al. (2022), M22 = Morishita & Stiavelli (2022), N22 = Naidu et al. (2022b, a), W22 = Whitler et al. (2023), Y22 = Yan et al. (2023), B22 = This Work (fiducial selection), B22M = This Work (alternate selection), Z22 = Zavala et al. (2023)
a Presented are the photometric redshift as reported in the earlier work and as estimated here based on the grizli reductions
b The different measurements provided are based on the two different reductions of the NIRCam data utilized in this analysis.
c Amplitude of Lyman break in mag. Lower limits are .
d
e Spectroscopically confirmed to have a redshift (Carnall et al., 2023)
While these candidates were identified in earlier versions of these manuscripts, they did not make it into the final versions of these manuscripts. Nonetheless, our analysis suggests they are "robust" sources.
∗ For simplicity, no account is made for lensing magnification for sources over the SMACS0723 and Abell 2744 parallel fields.
e
| # of | Fraction of | ||||
|---|---|---|---|---|---|
| Sample | Sourcesa | Purity (Robust)b | Purity (Robust+Solid)c | Completenessd | Total Candidatese |
| This Work (Fiducial) | 16 | 0.250 | 0.875 | 0.197 | 0.103 |
| This Work (Alternate) | 21 | 0.238 | 0.762 | 0.225 | 0.135 |
| Adams et al. (2023) | 4 | 0.500 | 1.000 | 0.118 | 0.041 |
| Atek et al. (2023 , v2) | 10 | 0.300 | 0.500f | 0.147 | 0.103 |
| Atek et al. (2023 , v1) | 15 | 0.200 | 0.333f | 0.147 | 0.155 |
| Castellano et al. (2022 , v2) | 6 | 0.333 | 0.667 | 0.333 | 0.286 |
| Castellano et al. (2022 , v1) | 7 | 0.286 | 0.571 | 0.333 | 0.333 |
| Donnan et al. (2023 , v2) | 31 | 0.258 | 0.903 | 0.350 | 0.172 |
| Donnan et al. (2023 , v1) | 34 | 0.176 | 0.588 | 0.250 | 0.189 |
| Finkelstein et al. (2022b) | 23 | 0.261 | 0.869 | 0.588 | 0.371 |
| Harikane et al. (2023 , v2) | 13 | 0.231 | 0.461 | 0.187 | 0.151 |
| Harikane et al. (2023 , v1) | 13 | 0.385 | 0.538 | 0.219 | 0.151 |
| Labbe et al. (2022) | 5 | 0.800 | 1.000 | 0.147g | 0.081g |
| Morishita & Stiavelli (2022 , v1) | 1 | 1.000 | 1.000f | 0.029 | 0.010 |
| Morishita & Stiavelli (2022 , v2) | 8 | 0.375 | 0.750f | 0.176 | 0.082 |
| Naidu et al. (2022b) | 2 | 1.000 | 1.000 | 0.333h | 0.333h |
| Whitler et al. (2023 , v2) | 6 | 0.167 | 0.667 | 0.118 | 0.097 |
| Whitler et al. (2023 , v1) | 8 | 0.125 | 0.750 | 0.176 | 0.129 |
| Yan et al. (2023) | 64 | 0.000 | 0.234f | 0.441 | 0.660 |
We emphasize that the results we present are completely reliant on the photometry we derive for the candidates from our two reductions and the SED template sets we have available for our redshift likelihood calculations. As such, these results are merely indicative, and clearly the ultimate arbiter of the purity and completeness of individual selections will be deep spectroscopy with JWST.
In this table, we only report analyses which consider the selection of sources at and higher. For this reason, we do not report on analyses like Leethochawalit et al. (2023) or Endsley et al. (2022) where source selection only extends to redshifts of .
a Number of candidates identified in the magnitude range well probed in most studies in the literature (i.e., 29 mag)
b Fraction of candidates from this study that satisfy our criteria for being “robust” candidates.
c Fraction of candidates from this study that satisfy our criteria for being “robust” or “solid” candidates.
d Fraction of the total set of “robust” and “solid” candidates (Tables 3, 11, and 12) identified in a given study. Only the search fields utilized in a study are considered for these completeness estimates.
e Fraction of the total number of candidates identified in a given study. Only the search fields utilized in a study are considered for these completeness estimates.
f The purity of selections focusing on the SMACS0723 cluster and parallel field are likely lower than the other selections due to the lack of especially sensitive F115W data over the fields.
g We would not expect the Labbe et al. (2022) selection to be an especially complete representation of star-forming galaxies at , given their choice to select only those galaxies with prominent Balmer breaks.
h Since Naidu et al. (2022b) expressly only search for sources which are particularly bright and which show high S/N (10) detections in both F356W and F444W sources, we somewhat arbitrarily evaluate the completeness of their selection to 27 mag.
3.3 Selections from the Literature
Given the many challenges that exist in making use of the first JWST observations in identifying galaxies, the uncertain NIRCam zeropoints being perhaps the largest (e.g. Adams et al., 2023), it is useful for us to provide an alternate assessment of the many candidates which have been identified in the early JWST observations. This can help provide us with insight into both the reliability and completeness of earlier JWST/NIRCam selections.
There have been selections of galaxies conducted by at least ten different teams, including Naidu et al. (2022b), Castellano et al. (2022), Adams et al. (2023), Atek et al. (2023), Yan et al. (2023), Donnan et al. (2023), Whitler et al. (2023), Labbe et al. (2022), Harikane et al. (2023), and Finkelstein et al. (2022b). In general, these studies have focused on identifying sources from one or more of the same three data sets considered here, allowing for an extensive set of comparisons between the different selections and independent assessments of various candidates.
3.3.1 Evaluation and Segregation into Different Subsamples
In this subsection, we focus on the candidates identified over the three most studied JWST NIRCam fields (SMACS0723, CEERS, and Abell 2744 parallel), and provide an independent evaluation of their robustness. To provide this evaluation, we have performed 0.35′′-diameter aperture photometry on all the identified candidates from Naidu et al. (2022b), Castellano et al. (2022), Adams et al. (2023), Atek et al. (2023), Yan et al. (2023), Donnan et al. (2023), Whitler et al. (2023), Finkelstein et al. (2022b), Labbe et al. (2022), and Harikane et al. (2023). For papers where changes have occurred to the identified high-redshift sources, we consider the catalogs in each version of various papers. Not only is this useful for gaining perspective on progress that has been made, but we have found that some sources in earlier versions of papers also appear to be credible candidates, and therefore we have included these sources in our analysis to be as comprehensive as possible. We perform photometry on both our fiducial and alternate reductions using grizli and pencil, respectively.
We then look for the presence of a significant spectral break in sources and compute redshift likelihood distributions for candidates based on our derived photometry of the recent grizli and pencil reductions. We then segregate sources into three different samples:
-
•
(1) one where the cumulative probability of candidates lying at , i.e., , exceeds 99% using the photometry we have performed on both NIRCam reductions utilized here,
-
•
(2) one where is in excess of 80% and 50% for our fiducial and secondary reductions, in excess of 70% for both our fiducial and secondary reductions, or in excess of 50% and 80% for our fiducial and secondary reductions, but does not the former selection criteria, and
-
•
(3) one which does not satisfy either of the former selection criteria.
We refer to (1) the first selection of sources from the literature as the “robust” sample, (2) the second selection as the “solid” sample, and (3) the third selection of sources as the “possible” sample.
3.3.2 Results
We present these different samples in Table 3 and Tables 11-15 of Appendix B. Interestingly enough, only 18 and 3 candidates from these fields satisfy our criteria for being robust. 75 of the reported candidates in the literature qualify as “solid” candidates, while 108 of these candidates qualify as “possible.”
Of the candidates we classify as “robust,” only 10 have an estimated redshift using our fiducial photometry. The most consistent characteristics of sources in our robust lists is that they show either very pronounced (1.5-mag) spectral breaks in the observed photometry or show two spectral breaks (Lyman + Balmer, as was a key aspect of the Labbe et al. 2022 selection). Additionally, to the extent that the present compilation of “robust” candidates overlap with the redshift ranges and fields examined by Harikane et al. (2023), three of the four sources from our compilation, i.e., GLz11, GLz13, and 32395_2 (Donnan et al., 2023; Finkelstein et al., 2022a), receive robust designations in Harikane et al. (2023), with equal to 71.9, 72.3, and 14.5, respectively, each of which is well above their selection criterion for secure sources. This is reassuring and gives us confidence that at least for this subset of candidates, the inferred redshifts might be reasonably secure.
From these numbers, it is clear that the majority of candidates identified to date only qualify as “possible” candidates and do not meet the higher quality standards required to be classified as “robust” or “solid.” Interestingly enough, essentially all studies presenting significant samples of candidates from the first JWST fields, e.g., Atek et al. (2023), Donnan et al. (2023), Harikane et al. (2023), Yan et al. (2023), all contain sources that lie in the "possible" category given our photometry. Interestingly enough, of the candidates we grade as "robust," "solid," and "possible" and where we compute photometric redshifts , 90%, 28%, and 12%, respectively, are also independently reported as a candidate galaxy in a separate manuscript from the literature.
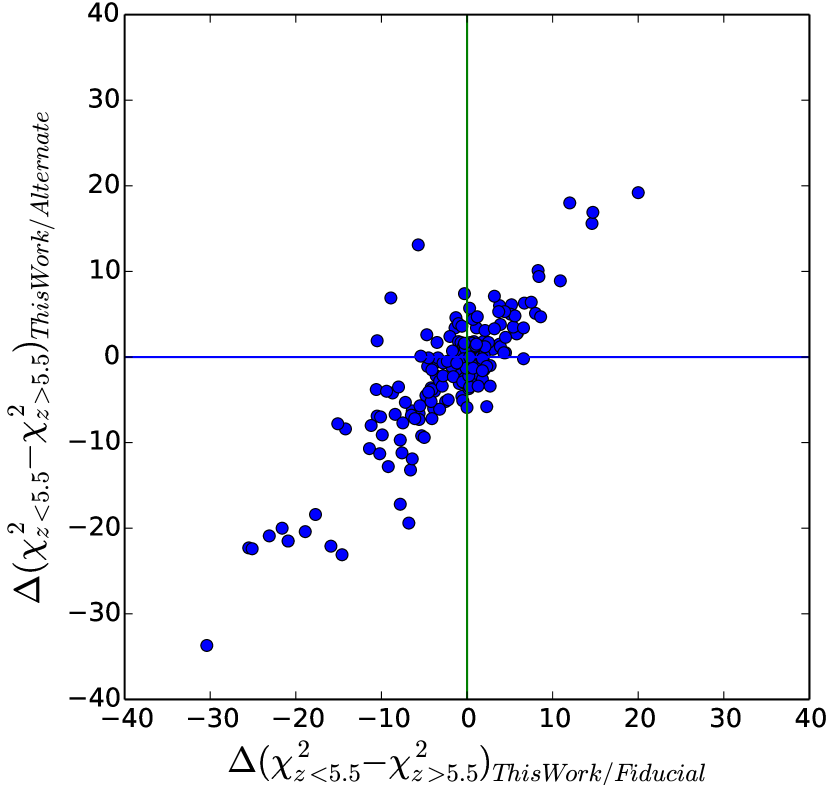
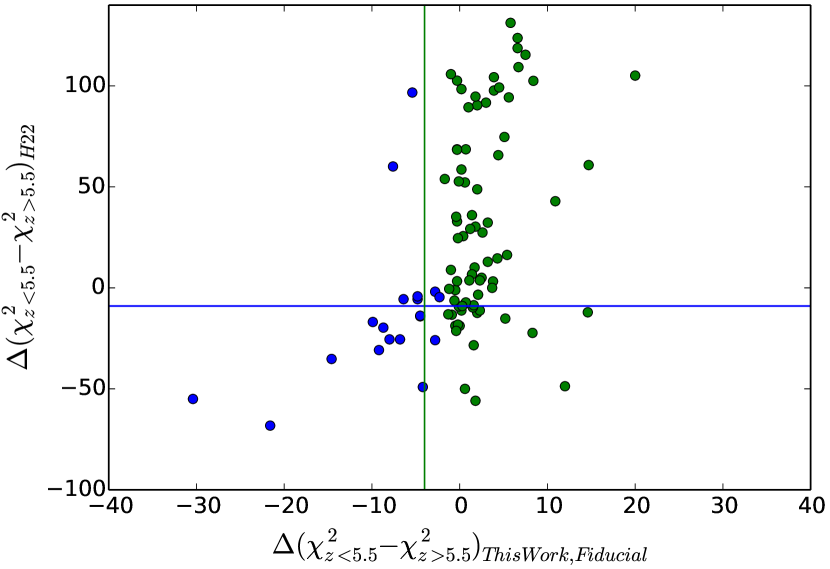
Figure 3 shows the distribution of the sources we find from our grizli reductions over the three NIRCam fields (SMACS0723, GLASS parallel, and CEERS) in redshift and luminosity vs. the comprehensive earlier selection of -11 sources from Hubble constructed by Bouwens et al. (2015, 2021); Bouwens et al. (2022c). We also show the “robust” or “solid” galaxy candidates from the earlier studies with JWST.
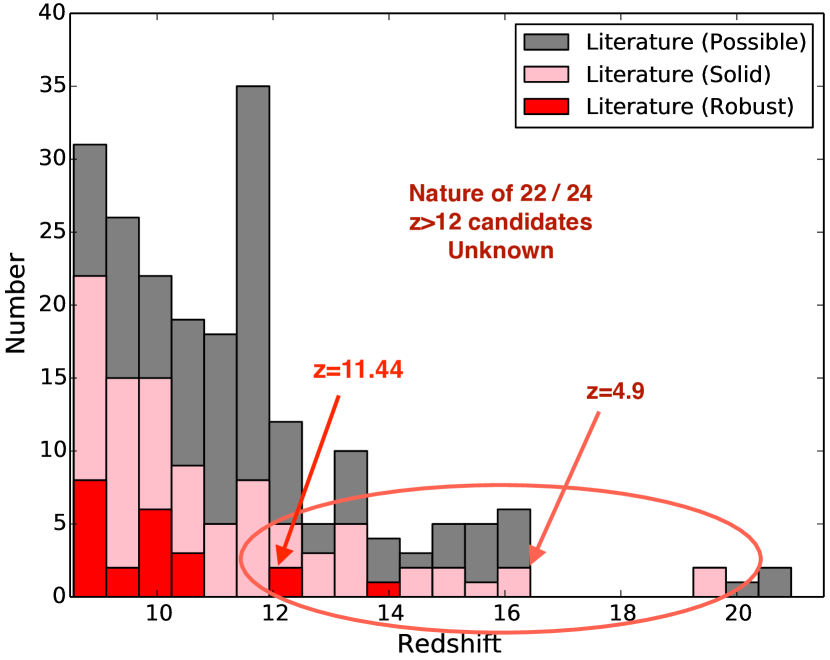
In Figure 4, we show the number of sources that are contained in our literature subsamples of "robust," "solid," and "possible" candidates as a function of redshift. The number of "solid" and "possible" candidates at are 8 and 24 larger, respectively, than those which we grade as "robust." Clearly, it is essential that higher quality JWST data become available for sources in these samples to determine the fraction that are actually at .
3.3.3 Characterization of Literature Subsamples
To help interpret the quality of the candidates that we segregated into different categories, we derive median fluxes for candidates in each category. Prior to the median stacking, a renormalization of the fluxes in individual sources is performed such that the F200W, F277W, and F356W band fluxes for the , , and samples, respectively, are 36 nJy. The results are presented in Table 16 of Appendix C.
The most significant difference between the different stacks is the flux blueward of the break. For both the “robust” and “solid” stacks, no significant flux is present blueward of the putative Lyman breaks and large Lyman breaks are seen, i.e., 1.8 mag. However, for the “possible” stack, not only is the flux in the median stacks nominally significant 1-2 in individual bands, but the putative breaks are smaller, i.e., 1.0-1.5 mag. Because of such characteristics, the reliability of sources in the "possible" samples is lower, as indicated also by the much greater likelihood these sources show for being at lower redshifts from the individual SED fit results.
To provide some measure of the quality and completeness of earlier selections of galaxies derived from the first JWST fields, we have calculated the total number of “robust”+”solid” candidates that have been identified to 29 mag over various JWST fields by our selection or those in the literature and quantified the fraction of these candidates that have been identified in various studies. We present this fraction as the completeness of each selection in Table 4. In estimating the completeness, we only consider the fields included in a given selection. As one example, since Harikane et al. (2023) only search for -11 F090W-dropout galaxies over the GLASS parallel field as part of their selection, we do not treat compelling -11 galaxies found over other fields like SMACS0723 or CEERS as contributing to our assessment of completeness in their study.
3.3.4 Evaluation of Earlier Selections
In Table 4, we also present an approximate “purity” for each selection by dividing the number of “robust” candidates in each selection by the total number of reported candidates in a study as well as the number of “robust” and “solid” candidates in a given study. In grading individual candidates from various studies, we only include sources which magnitudes brightward of 29 mag to limit our analysis to those sources with the highest S/N and to increase the probability that sources will be selected as part of multiple studies.
We caution that the results we obtain here are completely reliant on the photometry we derive for the candidates from our two reductions and the SED template sets we utilize in our analysis. As such, these results (and the remarks in the paragraphs which follow) should be taken as merely indicative, and clearly the ultimate arbiter of the purity and completeness of individual selections will be deep spectroscopy with JWST (e.g. Roberts-Borsani et al., 2022a; Curtis-Lake et al., 2022; Tang et al., 2023; Bunker et al., 2023). For the purposes of this calculation, we treat sources with a “possible” designation as corresponding to lower-redshift interlopers, but clearly there is some uncertainty in this designation and many candidates we grade in this category might well prove to be at .
| H22 | D22 | B22 | B22M | F22 | C22 | At22 | La22 | W22 | Y22 | M22 | Ad22 | |
|---|---|---|---|---|---|---|---|---|---|---|---|---|
| H22 | 13/13 | —– | —– | —– | —– | —– | —– | —– | —– | —– | —– | —– |
| D22 | 5/16 | 31/31 | —– | —– | —– | —– | —– | —– | —– | —– | —– | —– |
| (3/16)b,c | ||||||||||||
| B22 | 6/15 | 7/43 | 21/21 | —– | —– | —– | —– | —– | —– | —– | —– | —– |
| (5/16) | (5/50) | |||||||||||
| B22M | 4/14b | 5/40 | 10/27 | 16/16 | —– | —– | —– | —– | —– | —– | —– | —– |
| (4/46) | ||||||||||||
| F22 | 2/ 6 | 9/30 | 7/27 | 6/28 | 23/23 | —– | —– | —– | —– | —– | —– | —– |
| (2/5) | (8/35) | (7/28) | (6/29) | |||||||||
| C22 | 3/11b | 2/ 7b | 3/10b | 1/12b | —–a | 6/ 6 | —– | —– | —– | —– | —– | —– |
| (2/6)b | (2/11)b | |||||||||||
| At22 | 0/ 4 | 3/18 | 2/10 | 0/10 | —–a | —–a | 10/10 | —– | —– | —– | —– | |
| (1/29) | (2/15) | (0/15) | —– | |||||||||
| La22 | —–a | 0/22 | 1/16 | 1/16 | 4/23 | —–a | —–a | 5/ 5 | —– | —– | —– | —– |
| (0/25) | (4/24) | |||||||||||
| W22 | —–a | 1/22 | 3/15 | 2/16 | 3/25 | —–a | —–a | 0/11 | 6/ 6 | —– | —– | —– |
| (2/26) | (2/18) | (2/18) | (3/28) | |||||||||
| Y22 | 0/46 | 0/75 | 1/65 | 0/64 | —–a | —–a | 1/73 | —–a | —–a | 64/64 | —– | —– |
| (0/80) | (1/66) | (0/65) | (2/78) | |||||||||
| M22 | 0/3 | 2/17 | 0/ 10 | 0/8 | —–a | —–a | 1/17 | —–a | —–a | 1/71 | 8/8 | —– |
| (1/15) | (0/3) | (0/1) | (0/16) | (0/66) | ||||||||
| Ad22 | —–a | 2/13 | 0/ 6 | 0/4 | —–a | —–a | 0/14 | —–a | —–a | 0/68 | 2/10 | 4/4 |
| (2/17) | (0/19) | (1/4) |
aThere is no overlap between specific fields and redshift ranges utilized in the two selections being compared.
bRemarkably, approximately half of the overlap between these studies are the two bright sources from Naidu et al. (2022b) and Castellano et al. (2022). If we exclude those two sources from consideration, overlap between the selections is only 10%.
cFraction in parentheses indicates the overlap in the initial versions of the catalogs from these papers. In the majority of cases, the fraction in the updated versions is higher.
There are a few noteworthy results to notice in the results presented in this table. First of all, there has been a clear improvement in both the purity and completeness of most samples since NIRCam data from JWST became public, as one might expect to improvements in the NIRCam zeropoint calibrations. As one example, the purity of the Donnan et al. (2023) selections – in terms of sources graded either "robust" or "solid" – have improved from 59% (v1) to 90% (v2). Other newer analyses which are able to take advantage of the improved zeropoint calibrations are the fiducial and secondary selections from the present analysis as well as those from Finkelstein et al. (2022b); these selections feature a purity of 88%, 76%, and 87%, respectively. Achieving a high purity appears to have been more difficult for analyses that focus on the SMACS0723 data set (e.g., Atek et al. 2023; Yan et al. 2023 but see however Adams et al. 2023), likely due to the significantly shallower F115W observations available in the first JWST data over that field.
Second, selections that focus on the most luminous galaxies at , i.e., Naidu et al. (2022b, a); Adams et al. (2023), or selections which focus on sources with multiple spectral breaks (e.g. Labbe et al., 2022) show a much higher reliability than those that focus on a broader selection of sources. Based on the present analyses, we find 100% purity for all three of these selections in our analysis. This contrasts with more ambitious selections aiming to select the bulk of the star-forming galaxies at , e.g., Donnan et al. (2023), Harikane et al. (2023), Finkelstein et al. (2022b), and the present selections where 25% of the sources in these selections are graded as "robust," 50-60% of the sources are graded as "solid," and the final 15% of the sources in such selections are graded as "possible."
A third striking result is the large differences in the completeness of selections. The majority of the analyses only include a fraction (35%) of the candidates we grade as "solid" or "robust" in our analysis. In many analyses, this appears to have been the result of a clear choice to include only those sources which appear to be the most reliable, either because higher amplitude Lyman breaks are required (this work) or because the SED fits to solutions are required to give a much lower values of () than lower redshift fits (Harikane et al., 2023). Nevertheless, the Finkelstein et al. (2022b) selection appears to perform the best as far as completeness is concerned, showing a 2 higher completeness in their identification of "solid"+"robust" sources than most of the other analyses and also successfully selecting the sources found by Labbe et al. (2022) with prominent Balmer breaks (Table 3). The latter sources mostly miss our own selections due to their Lyman breaks having a smaller amplitude than 1.5 mag required to be included in our own samples.
One consequence of the relatively low estimated completeness for most selections is only a modest (20-35%) overlap between selections. Table 5 quantifies the number of sources that are in common for differing selections over the same fields out of some total possible. Nevertheless, it is worthwhile noting that there has been an improvement in the overlap between samples. Initially, most of the overlap between studies was confined to a few bright -12 sources such as have been found by Naidu et al. (2022b) and Castellano et al. (2022) and perhaps 10-15% of the rest, but now the overlap is approximately 30% between selections, approaching the 50% overlap seen in -8 selections obtained by HST over the Hubble Ultra Deep Field (Beckwith et al., 2006), e.g., see §3.4 of Bouwens et al. (2015) where overlap with other -8 selections (e.g. McLure et al., 2013; Schenker et al., 2013) is discussed.
4 Luminosity Function Results
In this section, we make use of the rather small samples of high-likelihood galaxy candidates over the three most well studied JWST fields to derive LF results. We begin with direct determinations of the LF results using our own selections and then move onto determinations based on collective samples of galaxies identified in the present and previous studies. We conclude this section with a comparison of these results with several previous determinations.
4.1 Results Using Our Own Samples
We begin by describing LF results derived using our own samples constructed from our fiducial reductions of the available JWST data.
Given the small number of sources in each of our samples, we derive LF results using the technique and assuming Poissonian statistics. As in our own earlier analyses, we derive LF results by maximizing the likelihood of producing the observed distribution of apparent magnitudes given some model LF:
| (1) |
where we take the likelihood of LF results derived over the set of fields we select sources and over a set of apparent magnitude intervals .
Given the lack of F090W observations over the CEERS fields and the limited depth of F115W observations over SMACS0723, we only consider sources in the GLASS parallel field for our LF determination and sources over the GLASS parallel and CEERS fields for our LF determinations. For our and determinations, we consider sources over the GLASS parallel, SMACS0723, and CEERS fields. For simplicity and because none of our candidates lie within 60 to the high magnification areas of the Abell 2744 and SMACS0723 clusters, we ignore the impact of lensing magnification on our LF results.
Since we are assuming Poissonian statistics, the probability of finding sources
| (2) |
where is the number of observed sources in magnitude interval while is the expected number given some model LF. We compute the number of expected sources based on some model LF using the equation
| (3) |
where is the effective volume over which a source in the magnitude interval might be both selected and have a measured magnitude in the interval .
| [mag-1 Mpc-3] | |
|---|---|
| galaxies | |
| 21.13 | 0.0000460.000036 |
| 20.13 | 0.0000440.000036 |
| 19.13 | 0.0010500.000414 |
| galaxies | |
| 20.49 | 0.0000180.000016 |
| 19.49 | 0.0001300.000068 |
| galaxies | |
| 20.96 | 0.0000100.000008 |
| 19.96 | 0.0000320.000032 |
| galaxies | |
| 21.96 | 0.0000180.000014 |
| [ mag-1 | ||||
| Redshift | Mpc-3] | [mag] | ||
| Schechter | ||||
| 8 | 5.7 | 21.15 (fixed) | 2.580.39 | — |
| 10 | 2.6 | 21.15 (fixed) | 2.38 (fixed) | — |
| 13 | 1.3 | 21.15 (fixed) | 2.71 (fixed) | — |
| 17 | 1.0 | 21.15 (fixed) | 3.15 (fixed) | — |
| Double Power-Law | ||||
| 8 | 102 | 19.67 (fixed) | 2.17 (fixed) | (fixed) |
| 10 | 28 | 19.67 (fixed) | 2.35 (fixed) | (fixed) |
| 13 | 22 | 19.67 (fixed) | 2.62 (fixed) | (fixed) |
| 17 | 26 | 19.67 (fixed) | 2.98 (fixed) | (fixed) |
| [mag-1 Mpc-3] | |
|---|---|
| Robust/Solid | |
| 20.5 | [0.000017,0.000071] |
| 19.5 | [0.000012,0.000148] |
| 18.5 | [0.000016,0.000402] |
| Robust/Solid | |
| 20.5 | [0.000017,0.000071] |
| 19.5 | [0.000012,0.000148] |
| 18.5 | [0.000016,0.000402] |
| Robust/Solid | |
| 21.5 | [0.000000,0.000007] |
| 20.5 | [0.000000,0.000029] |
| 19.5 | [0.000000,0.000155] |
a Upper and lower bounds correspond to the inferred volume densities of our “solid” and “robust” literature selections, respectively, derived by dividing the number of sources in each of those selections by the available volume for detecting sources down to a given luminosity.
We compute the selection volume for our samples by inserting artificial sources with various redshift and apparent magnitudes at random positions within the NIRCam images for each of these fields and then attempting both to detect the sources and select them using our , , , and selection criteria. We assume the -continuum slopes of sources to have a mean value of , with a scatter of 0.4. These -continuum slopes are in reasonable agreement with determinations available on the basis of both HST+Spitzer data (e.g., Dunlop et al., 2013; Wilkins et al., 2016; Stefanon et al., 2022) and now JWST data (Topping et al., 2022; Cullen et al., 2022).
Additionally, we adopt point-source sizes for the artificial sources we inject into various images in our simulation and recovery experiments. While the present size assumptions are not especially different from that found for galaxies at -17, both using earlier HST observations and now using JWST observations (Naidu et al., 2022b, a; Ono et al., 2022), they may lead to a slight overestimate of the total selection volume. While it is worthwhile keeping this in mind for the discussion which follow, these uncertainties are likely small in comparison to the very large uncertainties in the total number of bona-fide galaxies over these fields (amongst the many sources from the literature we have graded as "possible").
We use 0.5-mag bins in deriving our stepwise LF results, while for our parametric determinations, we adopt both a Schechter and double power-law functional form:
| (4) |
where is normalization, is the faint-end slope, is the bright-end slope, and indicates some characteristic luminosity where there is a transition between the two regimes.
For the Schechter function results, we fix the to mag consistent with the LF derived by Bouwens et al. (2021), while we fix to , , and at , , and consistent with an extrapolation of the LF fit results of Bouwens et al. (2021) to the respective redshifts. For our double power-law fit results, we fix to and to match the LF fit results of Bowler et al. (2020) at . We fix , , , at , , , and consistent with the fitting formula Bowler et al. (2020) provide for evolution of the LF using a double power-law parameterization.
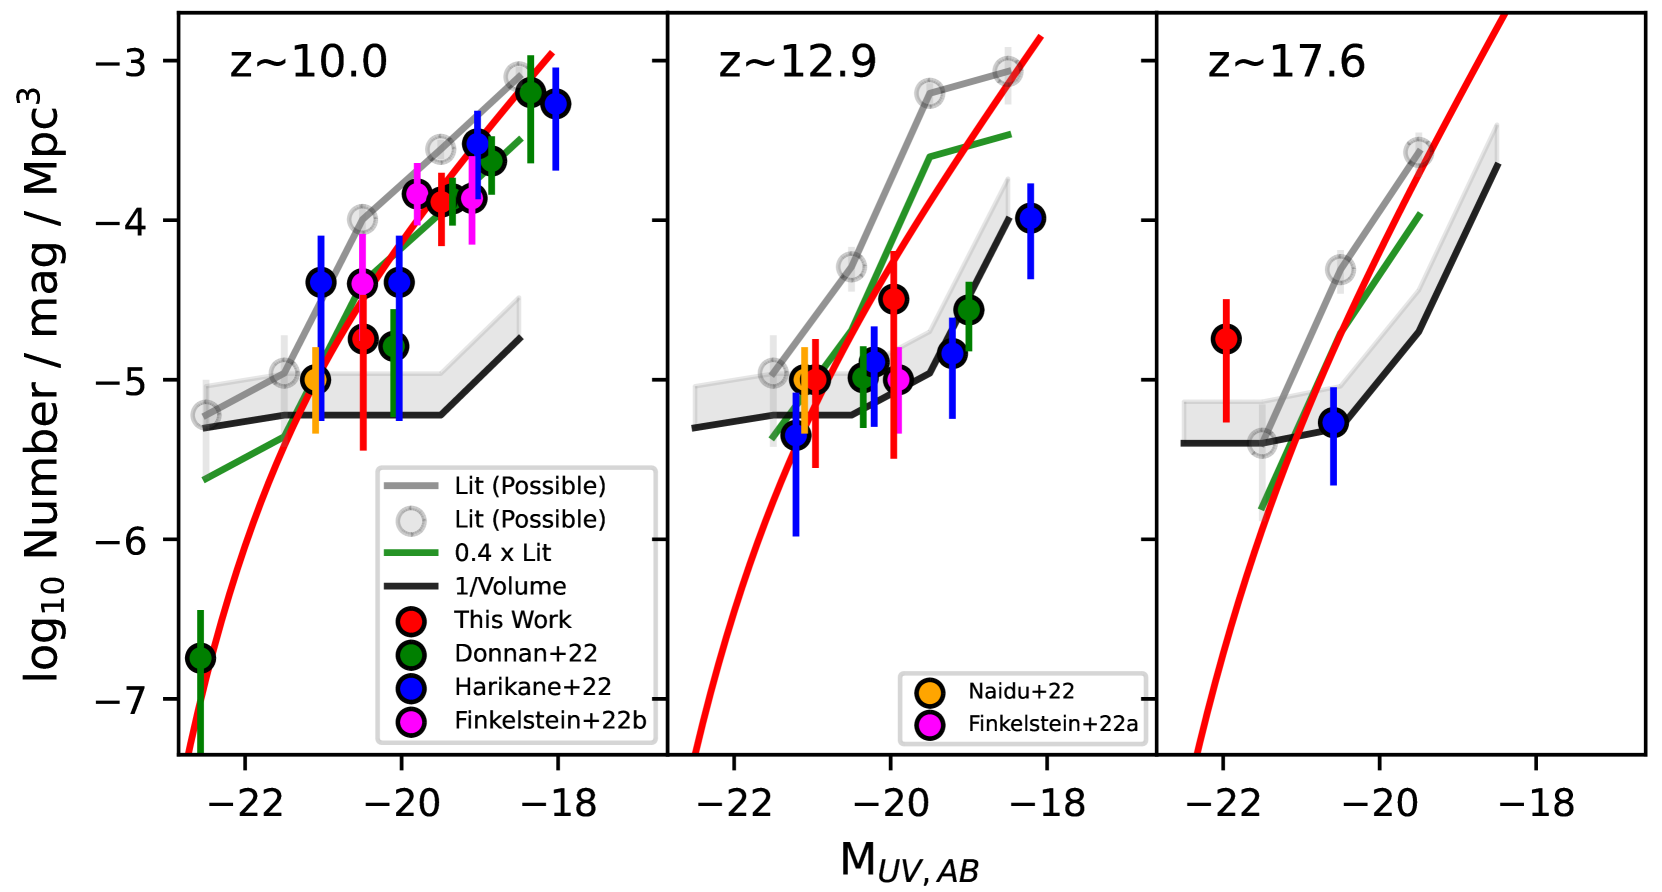
We present our binned LF results at , , and LF results in both Table 6 and Figure 5. The parameterized fit results are presented in Table 7 and on Figure 5 as red lines. We also derived LF results at as a test of our procedures for deriving LFs at . The results are shown in both Figure 8 from Appendix D and Tables 6-7. Encouragingly the results we obtain are consistent with the earlier determinations we obtained from HST data in Bouwens et al. (2021).
The present LF results appear to be fairly similar to the LF results of Donnan et al. (2023) and Harikane et al. (2023) at -11. At , we find a 1.5-2 higher volume density of sources than Donnan et al. (2023), Harikane et al. (2023), and Finkelstein et al. (2022a), and at , the volume density we find for sources is higher than what Harikane et al. (2023) recover. At the bright end of the -13 LFs, our results are very similar to Naidu et al. (2022b). In general, there is broad similarity in all LF results obtained to the present with JWST, given the limited statistics available and thus large uncertainties.
4.2 LF Results from Our Literature Samples
As an alternative to direct determinations of the LF from our own selections of candidates, we also consider the use of the literature results we analyzed and characterized in (§3.3) to derive LF results at , , and .
As we have already noted, large numbers of candidate galaxies have been identified in various analyses of the early NIRCam data, and the purpose of this analysis is to show the implications of these results for the LFs assuming that a significant fraction of these candidates are at .
It is interesting to derive the implied LF results as a function of the apparent robustness level of the candidates, to demonstrate how high the volume density of sources is even including only the best candidates. We take the luminosity of individual candidates to the values we measure based on our own photometry. A complete list of the candidates we utilize and their classification into the groups defined in (§3.3) is provided in Tables 3 and 11-15.
Given the diverse selection criteria used to construct these literature LFs, we take the selection volume to be equal to the detection volume, as we very conservatively assume that all detected sources are selectable by one or more of the diverse selection criteria used in the literature. By making this assumption, our derived LFs should be as low as possible given the available selection volume at high redshift.
To illustrate the implications of including all of the published candidates to the present in LF determinations, we present , , and LF results in Figure 5 using the solid grey circles and error bars. For clarity, LF and luminosity density results derived for this "possible" sample and later for the "solid" literature sample also include the full set of sources from the "solid"+"robust" and "robust" samples, respectively. Gray lines are drawn connecting the grey points to help the literature LF results. Those LF results are some -10 higher than the LF results reported by Donnan et al. (2023), Harikane et al. (2023), Bouwens et al. (2022a), and Finkelstein et al. (2022b) over the luminosity range to mag. One explanation is that this full sample includes sources we have graded as “possible”, which we estimate to have a lower probability of being at .
Thus, one reason these LFs might be so much in excess of the individual LF determinations is because the list of "possible" candidates (Table 13-15) include large numbers of lower-redshift interlopers. This motivates us to also derive LF results based on candidates which satisfy much more stringent quality requirements, such as those that make up our “solid” or “robust” sample of sources from the literature.
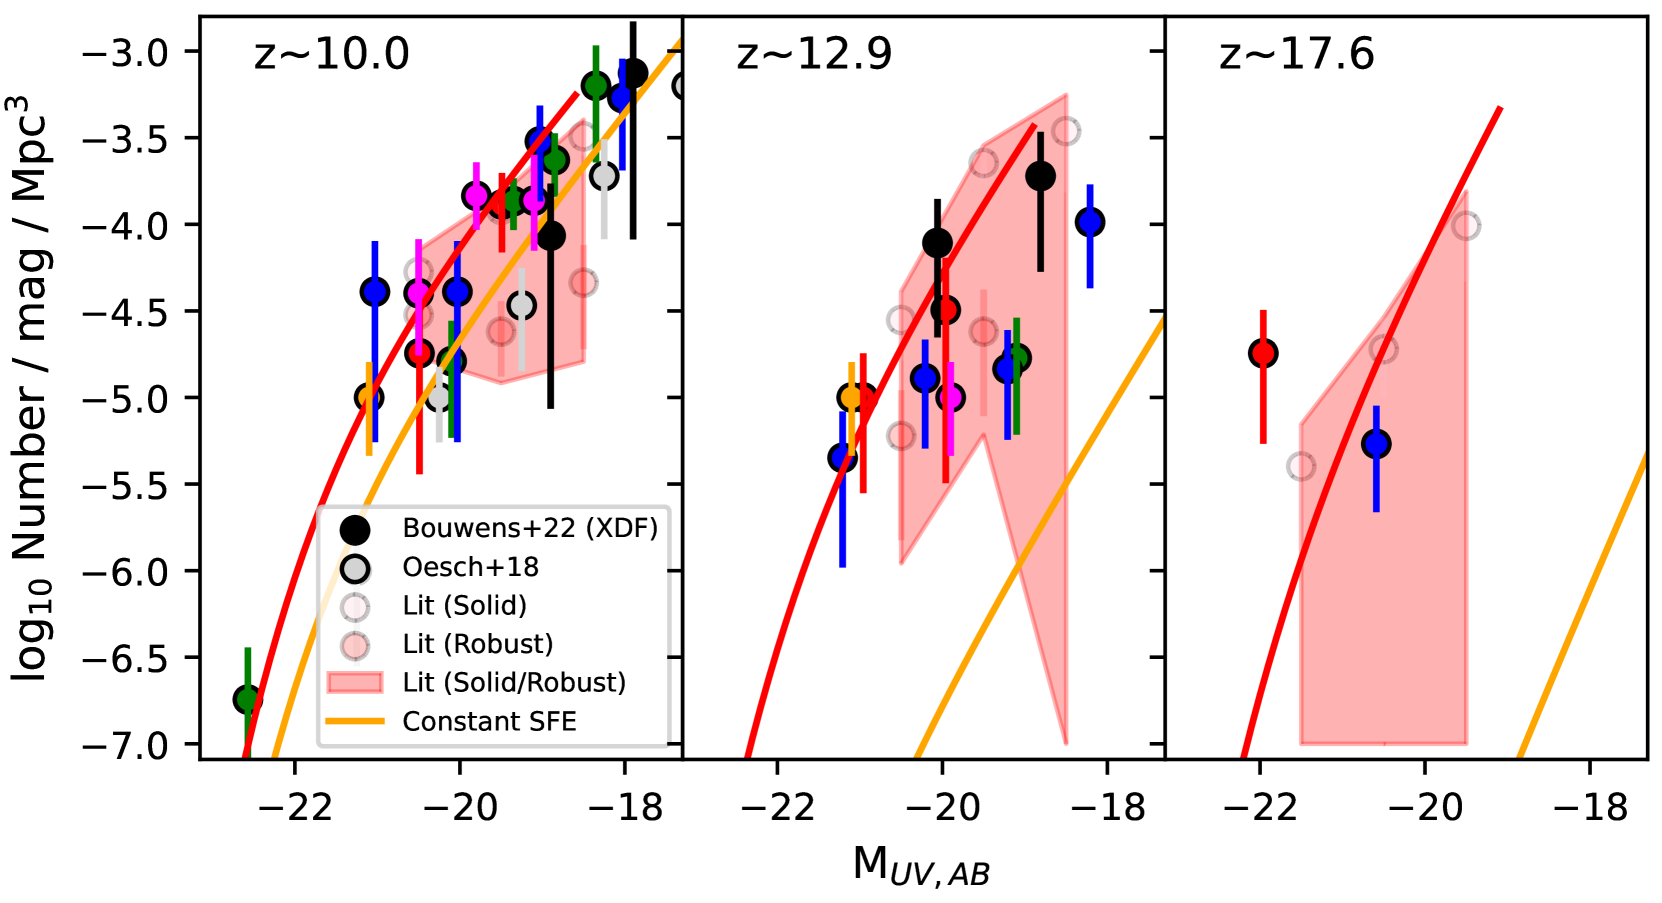
Results for the “solid” and “robust” samples are shown in Figures 6 with the partially transparent pink and red points, respectively. Even the LF results from the “solid” candidates exceed the results from Donnan et al. (2023) and Harikane et al. (2023) by factors of 1.5 to 2, but agree better with the our own results and those of Finkelstein et al. (2022b). At and , the LF results derived from the “solid” candidates lies even more clearly in excess of the LF results from Donnan et al. (2023), Harikane et al. (2023), and our own analysis.
Given current uncertainties over what fraction of current candidate lists are bona-fide, we express the LF results we derive from the literature in Table 8 in terms of a region spanning the range between our LF results using the “robust” candidates and the candidates we classify as “solid.” These results are also shown in Figure 6, and we can see it easily encompasses the range of LF results reported in various studies.
| Redshift | [ergs Mpc-3] | [/yr/Mpc3] |
|---|---|---|
| Direct Determinations | ||
| 8 | 25.21 | 2.94 |
| 10.0 | 24.69 | 3.46 |
| 12.9 | 24.39 | 3.76 |
| 17.6 | 24.39 | 3.76 |
| “Robust” Literature Sample | ||
| 10 | 24.450.13 | 3.700.13 |
| 13 | 24.040.19 | 4.360.19 |
| “Solid” Literature Sample | ||
| 10 | 24.860.08 | 3.290.08 |
| 13 | 24.920.09 | 3.230.09 |
| 17 | 24.680.14 | 3.470.14 |
| “Possible” Literature Sample | ||
| 10 | 25.290.06 | 2.860.06 |
| 13 | 25.370.06 | 2.800.06 |
| 17 | 25.070.09 | 3.080.09 |
1 Luminosity densities integrated down to 19 mag.
5 Discussion
5.1 Evolution of Star-Forming Galaxies from to
There has been a lot of discussion over the last ten years regarding how much star formation took place during the earliest epochs of the universe, when . Some of this discussion had been based on the evolution of the LF at and debate between a slower evolution in the apparent SFR and luminosity density (e.g., McLeod et al., 2016) and a more rapid evolution (e.g., Oesch et al., 2014; Oesch et al., 2018; Bouwens et al., 2021).
The relatively small number of apparently robust candidates identified in the wider area data searched by Oesch et al. (2018) seemed to weigh in favor of a faster evolution. Nevertheless, the apparent discovery of many luminous galaxy candidates (particularly now with JWST) in the universe over wide areas (e.g., Bowler et al., 2020; Roberts-Borsani et al., 2022b; Harikane et al., 2022; Finkelstein et al., 2022c; Bagley et al., 2022; Kauffmann et al., 2022; Donnan et al., 2023) and the discovery of apparent Balmer breaks in galaxies at (Zheng et al., 2012; Hashimoto et al., 2018; Labbe et al., 2022) pointed in the other direction, towards more substantial early star formation activity.
A good baseline for evaluating early star formation activity is through comparison with the predictions of constant star formation efficiency models (SFE). Already, such models have succeeded in providing a plausible baseline for modeling star formation across cosmic time (e.g. Mason et al., 2015; Bouwens et al., 2015, 2021; Mashian et al., 2016; Harikane et al., 2018, 2022; Oesch et al., 2018; Tacchella et al., 2018; Stefanon et al., 2021, 2022). While there have been a large number of models using the constant SFE assumption to model the evolution of the SFR density across cosmic time, we will test the results against only four: Mason et al. (2015), Bouwens et al. (2015), Tacchella et al. (2018), and Harikane et al. (2022).
A comparison of the constant star formation efficiency model results are shown in Figure 6. As in other recent studies, the evolution on the LF appears to be significantly in excess of that predicted from constant SFE models at (for galaxies more luminous than ). Not only does this clearly appear to be the case for all LF determinations at , but it is even true if we only make use of sources from the literature that we classify as robust. If one or more of the candidate galaxies is actually at such a high redshift (Donnan et al. 2023; Harikane et al. 2023; Naidu et al. 2022a: but see also Zavala et al. 2023; Naidu et al. 2022a), differences with the constant SFE models is even larger.
It is unclear whether this indicates the SFE of galaxies is indeed more efficient or if the IMF of (luminous) galaxies is very different at early times. If the stellar masses in galaxies are as high as found in Labbe et al. (2022), it would argue in favor of a substantially higher SFE. There is clearly a limit to how high the SFE can be based on the baryon mass in collapsed halos at , and interestingly enough, both Boylan-Kolchin (2022) and Naidu et al. (2022a) find that some galaxies may be in violation of these limits. Potential resolution of this enigma could include an evolution in the stellar IMF in star-forming galaxies at such that the mass-to-light ratio in early galaxies is substantially lower than at later times in the history of the universe (e.g. Steinhardt et al., 2022; Harikane et al., 2023; Inayoshi et al., 2022).
5.2 Luminosity and SFR Densities of Galaxies at
An alternate way of assessing the star formation activity in the early universe is by looking at results in terms of the luminosity density and SFR density. In characterizing the evolution, we only consider sources and LF results brighter than 19 mag to avoid extrapolating the LF faintward of what can be well probed with early JWST data, i.e., 29 mag, as used both in the present study, Donnan et al. (2023), and Finkelstein et al. (2022b).
We have adopted such a limit to avoid substantial extrapolations of LF results to much fainter luminosities where they are less well constrained. If we consider extrapolations to 17 mag (as considered in both Donnan et al. 2023 and Harikane et al. 2023), SFR density results derived assuming a faint-end slope of (as assumed by Harikane et al. 2023) vs. assuming a faint-end slope of (as predicted at by Mason et al. 2015) differ by 1 dex. Given that difference would then be driven entirely by the assumed faint-end slope, it is clearly preferable to quote SFR density results only to luminosity limits which are well probed by the observations.
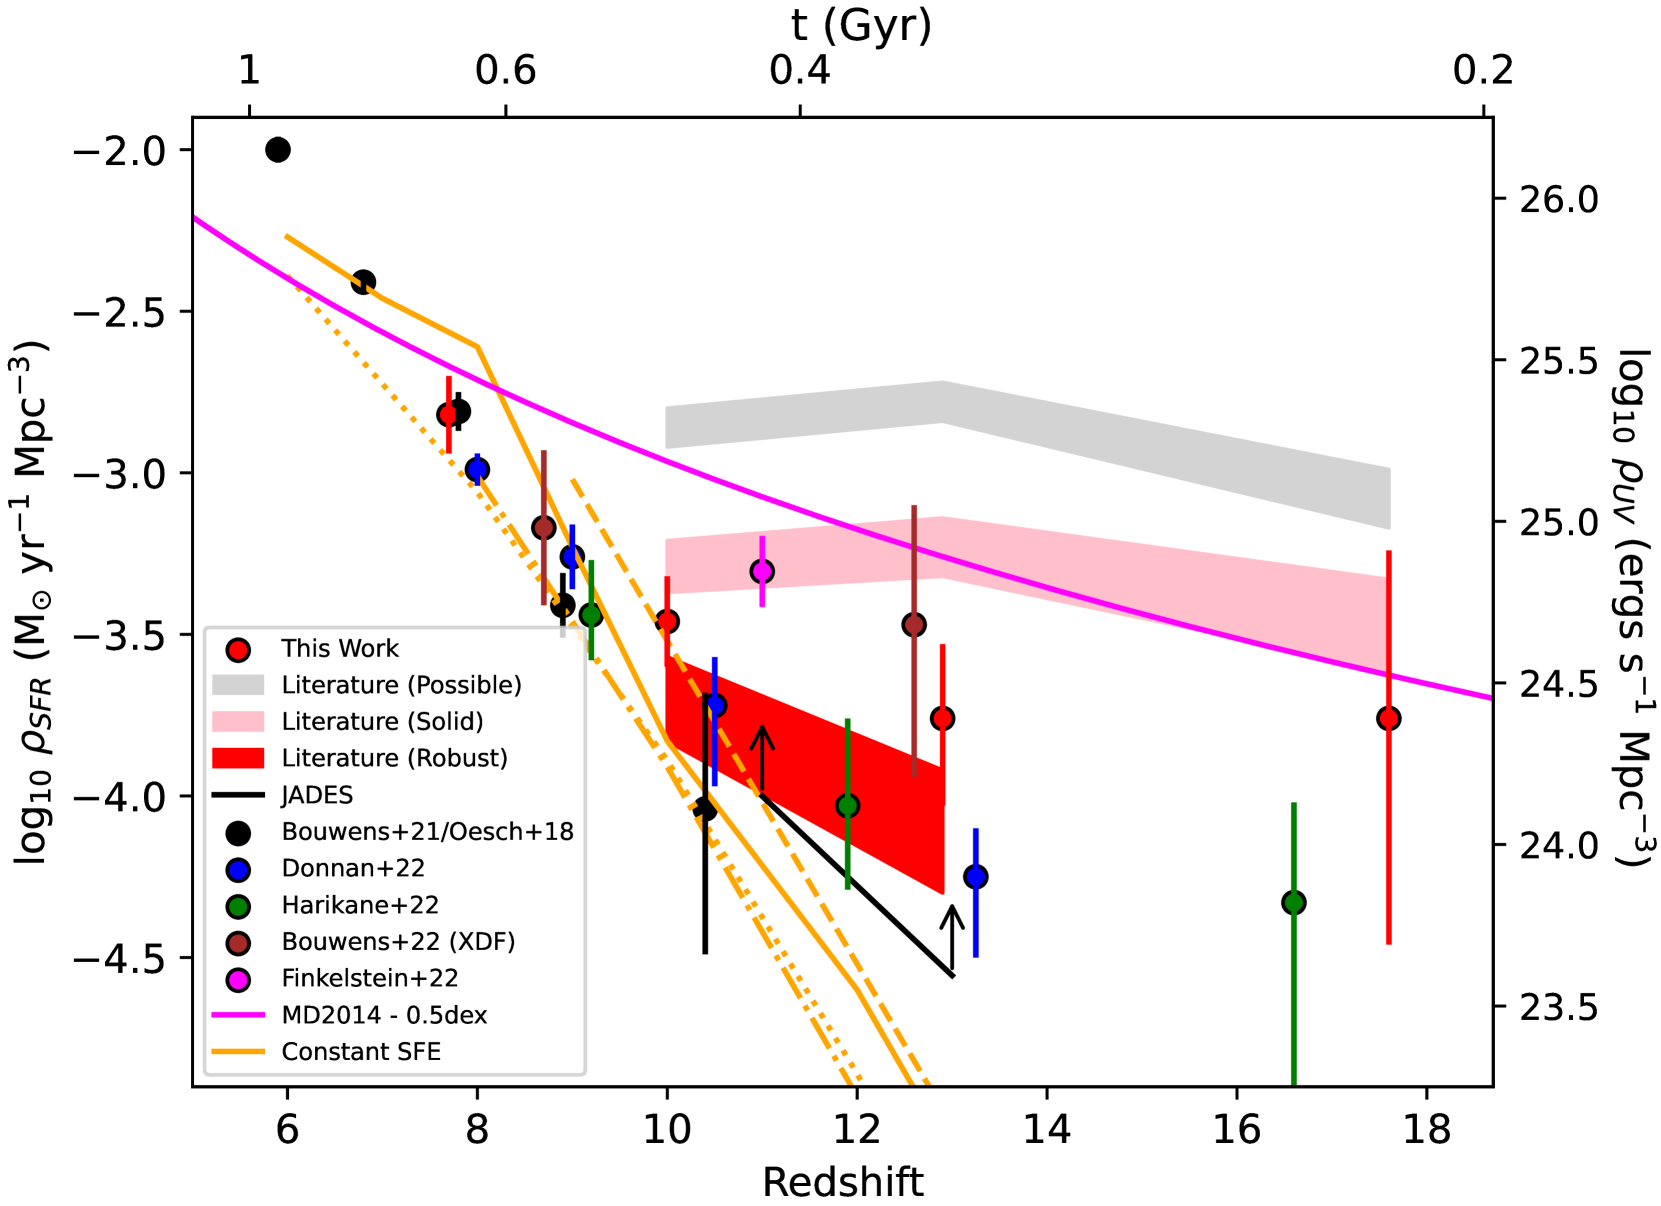
In Figure 7, we present our results for the luminosity density evolution both from our direct LF analyses. Additionally, we include the equivalent SFR density results, assuming the conversion factor FUV is from Madau & Dickinson (2014), which assumes a Chabrier (2003) IMF, a constant star formation rate, and metallicity . For context, we also include the results obtained by several other analyses of the JWST observations (Donnan et al., 2023; Harikane et al., 2023; Bouwens et al., 2022a; Finkelstein et al., 2022b) and also several constant star formation efficiency (SFE) predictions for the luminosity density evolution (Mason et al., 2015; Tacchella et al., 2018; Bouwens et al., 2021; Harikane et al., 2022). For context, a magenta line is included showing the fiducial star formation history derived by Madau & Dickinson (2014) extrapolated to but adjusted to be relevant for SFR probes down to 19 mag. We implement this adjustment as a 0.5 dex offset reflecting the difference in luminosity densities derived by Bouwens et al. (2021) to mag (the limit used here) vs. 17 mag (the limit used by Madau & Dickinson 2014). It is interesting to see how expectations at -9 have evolved from a decade earlier and how uncertain the SFRD still remains in the first 500 Myr.
In Figure 7, we also show the luminosity density results derived from our literature samples of the same fields. Separate results are presented for candidates categorized as “robust,” “solid,” and “possible” with the shaded red, pink, and grey regions, respectively. For additional reference, we include as a solid black line and upward arrows the implied lower limits on the luminosity densities at based on the recent JWST ADvanced Extragalactic Survey (JADES) spectroscopic results over the HUDF/XDF region (Robertson et al., 2022; Curtis-Lake et al., 2022). For those limits, we adopt the luminosities measured by Robertson et al. (2022) and assume a total search area of 2 (1.5 arcmin)2 and that sources can selected over the entire volume -12 and -14.
It is striking how much higher the implied luminosity densities of the "possible" candidates are relative to the results derived from those candidates in the other categories. Results including all of the candidates are 3 and 8 higher than those candidates we grade as "solid" and "robust," respectively, at and 7 and 20, respectively, higher at . These same luminosity density results are also significantly in excess of our own luminosity density results as well as the results of Donnan et al. (2023), Harikane et al. (2023), and Finkelstein et al. (2022b).
Clearly, much of the excess could be due to the presence of potentially substantial numbers of lower-redshift contaminants in various selections. The detection of possibly significant flux blueward of the breaks in the median stacks of the “possible” candidates is indeed suggestive of such a conclusion (cf., §3.3, Appendix C). There are clearly large uncertainties in what fraction of these fainter sources are at high redshifts. As we demonstrate in Appendix E, the assessment of the reliability of specific candidates can vary substantially between the different studies. It is indicative of the challenges with these early data sets that our independent evaluation of the candidates from Donnan et al. (2023), Harikane et al. (2023), Finkelstein et al. (2022b), and our own selections place a non-negligible fraction of these candidates (20%) in our lowest quality bin (Table 4).
Meanwhile, results using the “robust” candidates appear to be in excellent agreement with the collective LF results of Donnan et al. (2023) and Harikane et al. (2023), while our own results and those of Finkelstein et al. (2022b) agree better with the results obtained using the “solid” candidates. The Finkelstein et al. (2022b) LF results appear to be 2 higher than the Donnan et al. (2023) results due to the 2 higher completeness of the Finkelstein et al. (2022b) selection to “robust”+”solid” candidates from the literature (Table 4).444We remark in passing that the Finkelstein et al. (2022b) LF results appears to be more consistent than with the empirical completeness estimates we derive on the basis our literature selections (Table 4) than is the case for either the Donnan et al. (2023) or Harikane et al. (2023) analyses where the completeness of their selections is 2 lower than assumed in their LF analyses.
Without spectroscopy, it is difficult to know which of these two results is more reliable. A key question is the extent to which sources in our “solid” literature sample are at . Simulation results from both Harikane et al. (2023) and Larson et al. (2022) indicate that selections over CEERS-like data sets might well include an appreciable number of lower-redshift interlopers, even restricting such selections to sources with 80% of the integrated likelihood at (as is required for sources that make up our "solid" literature selections). Based on the expected contamination in the first JWST fields (likely due to the limited depth of the data blueward of the break), Harikane et al. (2023) require that candidates satisfy an especially demanding selection criterion to be included in their high-redshift samples.
Another concerning aspect of sources in our "solid" literature selections is the much less significant overlap between candidates reported in different studies. While 90% of the candidates in our "robust" literature selections are identified as part of multiple studies, only 26% of the candidates in the "solid" literature selections are found in multiple studies.555For reference, the percentage of candidates from our ”possible” literature selections that occur in more than one study is just 5%. This demonstrates there is really a difference in the quality of the candidates that make up of our literature subsamples. This suggests that a larger percentage of sources in our "solid" literature sample may in fact be lower redshift contaminants, but it is a huge open question what that percentage is.
Even median stacking of the SED results is of little use in ascertaining whether sources in our “solid” literature selections are reliable. As we show in Appendix C, very similar stack results are obtained using either the “robust” or “robust”+”solid” subsamples of literature candidates. In both cases, a pronounced 1.5-mag spectral break is seen, with no significant flux blueward of the break. Also both stacks reveal a blue spectral slope redward of the break.
Fortunately, an increasing amount of spectroscopy is becoming available for selections, particularly based on the JADES and CEERS programs (e.g., Tang et al., 2023; Fujimoto et al., 2023; Cameron et al., 2023; Saxena et al., 2023; Bunker et al., 2023), spectroscopically confirming many sources out to a redshift where the strong [OIII]4959,5007 doublet can be detected at high S/N for star-forming sources and in some cases even earlier (e.g., Bunker et al., 2023). However, it should be noted that not all candidates are being confirmed to be at . The candidate 13050 from Labbe et al. (2022) has been found to have a redshift and to be an AGN (Kocevski et al., 2023). This is a particularly interesting example since it adds weight to the concern that our photometric redshift SED templates are not yet as complete as we would like.
Regardless of what the actual SFR density is at , i.e., whether it is closer to the "robust" or "solid" literature results shown in Figure 7, essentially all of the present results lie in significant excess of the constant SFE models (Mason et al., 2015; Tacchella et al., 2018; Bouwens et al., 2021; Harikane et al., 2022) by factors of 2-6 at and by even larger factors at .
It seems likely that at least part of the excess at could be explained due to the impact of noise in driving photometric redshift estimates to somewhat higher values than later found through spectroscopy. The approximate amplitude of this effect appears to be at (e.g., Muñoz & Loeb, 2008; Bouwens et al., 2022b; Kauffmann et al., 2022; Fujimoto et al., 2023). This appears to be due to typical photometric redshift estimates adopting a flat prior in redshift and thus taking into account the fact that luminous sources are more prevalent at lower redshift than they are at high redshift (Muñoz & Loeb, 2008).
There have been a variety of different explanations offered for this deviation from the constant SFE predictions in the literature. One possibility has been to suppose that the mass-to-light ratios of galaxies in the early universe are much lower than at later points in cosmic time, which could result from a change in the effective IMF of galaxies in the universe to one which is much more top heavy (e.g. Harikane et al., 2023; Steinhardt et al., 2022; Inayoshi et al., 2022).
Other possibilities have included the hypothesis perhaps AGN contribute much more significant to the light from the earliest generation of galaxies (e.g. Harikane et al., 2023), there is much greater scatter in the star formation rates in galaxies in the early universe away from the main star-forming sequence (e.g. Mason et al., 2023), as well a number of other explanations (e.g. Ferrara et al., 2022; Mirocha & Furlanetto, 2023; Harikane et al., 2023; Kannan et al., 2022; Lovell et al., 2023). Ascertaining which of these explanations is correct will ultimately require an extensive amount of follow-up observations with ALMA and JWST, especially involving spectroscopy as e.g. the recent confirmation of a source, sources by JADES team demonstrates (Roberts-Borsani et al., 2022a; Curtis-Lake et al., 2022; Robertson et al., 2022; Bunker et al., 2023), and -9 sources in CEERS (e.g., Tang et al., 2023; Fujimoto et al., 2023).
6 Summary
We have derived luminosity functions, and set constraints on the UV luminosity and SFR density from to , using the three most well-studied JWST NIRCam data sets from the first 5 months of JWST science operations, namely, the SMACS0723 cluster field (Pontoppidan et al., 2022), the GLASS Abell 2744 parallel field (Treu et al., 2022), and four CEERS (Finkelstein et al., 2022b) extragalactic fields.
We have selected of samples of , , , and galaxies in these fields, and made full use of the very extensive selections done by others to date. In particular, we have investigated the challenges of the selection of galaxies and derivation of LF results from these early JWST NIRCam observations. Even with a very conservative approach to selections, both from our own and similarly sub-selecting those of other studies, we find that luminous galaxies in the first 400-500 Myr are as enigmatic as the first JWST results suggested.
We first make use of two different reductions of the NIRCam observations to test the sensitivity of selections to the reduction technique. The first set of reductions we utilize relies on the grizli NIRCam pipeline, while the second leverages an alternate set of reductions made with the pencil NIRCam pipeline. Both reductions take advantage of advances made in the calibrations of the NIRCam zeropoints, as well as including steps to minimize the impact of noise and “snowball” artefacts.
Based on these reductions, we construct substantial samples of nominally , , , and galaxies using two color Lyman-break selection criteria. Our redshift selection functions indicate that our selections cover redshift ranges of , , , and . Our primary selection using the grizli reductions includes 18 , 12 , 5 , and 1 galaxies, while our alternate selection using the pencil reductions yields 22 , 13 , 3 , and 1 galaxy candidates. The overlap between these samples, even from two recent reductions, is only 40-50%, indicative of the subtleties and challenges of identifying sources at high redshift.
Using sources from the above selection and using estimates of the selection volumes in our search fields, we have derived estimates of the LF at , , , and . While the uncertainties are still very large, our LF results are suggestive of factors of 6 and 6 decreases in the normalization of the LF from to and , respectively. Not surprisingly, the results we obtain are similar to the relatively mild evolution in the luminosity density already reported in Naidu et al. (2022b), Donnan et al. (2023), Harikane et al. (2023), Bouwens et al. (2022a), and Finkelstein et al. (2022b).
We also take these results and set constraints on the UV luminosity and SFR density from to for galaxies more luminous than 19 mag. Similar to what we found for the LF results, the luminosity density and SFR density, both our direct determinations and the results based on likely robust -13 candidates from the literature, lie significantly in excess of the constant star formation efficiency (SFE) models, by factors of 2-6. Interpretation of these results is unclear, and it is open question whether the new results indicate the SFE of galaxies is indeed more efficient or if the IMF of (luminous) galaxies is very different at early times.
As a complement to direct determinations of the LF at , we also derive LF and luminosity density results, by taking advantage of the full samples of , , and galaxies that have been identified to date over the three most well studied fields. We then segregate this sample of candidates into three different samples “robust,” “solid,” and “possible” based on how likely sources are to be at based on our photometry of the sources in both our fiducial and secondary reductions of the NIRCam imaging observations.
We first considered the luminosity densities we would derive including all candidates reported over the three most studied fields to the present. Remarkably, we find and higher luminosity densities at relying on the "solid" and "possible" candidates than relying on the "robust" candidates from the literature alone. These results demonstrate how uncertain the luminosity densities are at and how much the results depend on the extent to what lower-redshift sources contaminate the selections.
Even allowing for a substantial amount of contamination in our selections of "possible" sources from the literature, large (0.5-1.0 dex: factors of 3 to 10) differences exist between the luminosity density results derived from sources graded "robust" and those graded "solid." If the bulk of the candidates graded "solid" are instead at lower redshift, the true luminosity density results at would be more along the lines of what has been found by Donnan et al. (2023) and Harikane et al. (2023), which are consistent with the recent spectroscopic results of Curtis-Lake et al. (2022) and closer to the predictions of the constant SFE models. Some of the recent simulation results from Harikane et al. (2023) and Larson et al. (2022) are suggestive of at least modest levels of contamination in the first JWST selections with NIRCam.
On the other hand, if the bulk of the candidates graded "solid" are bona-fide, then the LFs and luminosity density at and could be up to 3 and 7 higher and more in the range of the LF results we derive from our own selection of sources and also more consistent with the results of Finkelstein et al. (2022b). Supportive of these high luminosity density results are the median stack results we obtain for our selection of "solid" candidates from the literature, which appear to have almost identical characteristics to what we obtain from a similar stack of "robust" candidates from the literature.
Whatever the reality is, it is clear that huge open questions remain regarding the true LF and luminosity density results at . To resolve these open questions, deeper imaging observations and follow-up spectroscopy with JWST NIRSpec and the grisms will be required, allowing for a significantly improved reliability of selections and LF determinations going forwards. Fortunately, there are already significant on-going efforts obtaining sensitive imaging over fields like the HUDF (e.g. Bouwens et al., 2022a; Robertson et al., 2022) and sensitive spectroscopic campaigns by the substantial JADES and other programs (e.g. Curtis-Lake et al., 2022; Bunker et al., 2023; Cameron et al., 2023; Tang et al., 2023; Fujimoto et al., 2023) that provide the needed new data.
Acknowledgements
RJB acknowledges support from NWO grants 600.065.140.11N211 (vrijcompetitie) and TOP grant TOP1.16.057. MS acknowledges support from the CIDEGENT/2021/059 grant, from project PID2019-109592GB-I00/AEI/10.13039/501100011033 from the Spanish Ministerio de Ciencia e Innovación - Agencia Estatal de Investigación, and from Proyecto ASFAE/2022/025 del Ministerio de Ciencia y Innovación en el marco del Plan de Recuperación, Transformación y Resiliencia del Gobierno de España RPN acknowledges funding from JWST programs GO-1933 and GO-2279. Support for this work was provided by NASA through the NASA Hubble Fellowship grant HST-HF2-51515.001-A awarded by the Space Telescope Science Institute, which is operated by the Association of Universities for Research in Astronomy, Incorporated, under NASA contract NAS5-26555. PAO acknowledges support from: the Swiss National Science Foundation through project grant 200020 207349. The Cosmic Dawn Center (DAWN) is funded by the Danish National Research Foundation under grant No. 140. This work is based on observations made with the NASA/ESA/CSA James Webb Space Telescope. The data were obtained from the Mikulski Archive for Space Telescopes at the Space Telescope Science Institute, which is operated by the Association of Universities for Research in Astronomy, Inc., under NASA contract NAS 5-03127 for JWST.
Data Availability
All data used here are available from the Barbara A. Mikulski Archive for Space Telescopes (MAST: https://mast.stsci.edu), both in the form of raw and high level science products.
References
- Adams et al. (2023) Adams N. J., et al., 2023, MNRAS, 518, 4755
- Anders & Fritze-v. Alvensleben (2003) Anders P., Fritze-v. Alvensleben U., 2003, A&A, 401, 1063
- Atek et al. (2023) Atek H., et al., 2023, MNRAS, 519, 1201
- Bagley et al. (2022) Bagley M. B., et al., 2022, arXiv e-prints, p. arXiv:2205.12980
- Beckwith et al. (2006) Beckwith S. V. W., et al., 2006, AJ, 132, 1729
- Bertin & Arnouts (1996) Bertin E., Arnouts S., 1996, A&AS, 117, 393
- Bhatawdekar et al. (2019) Bhatawdekar R., Conselice C. J., Margalef-Bentabol B., Duncan K., 2019, MNRAS, 486, 3805
- Bouwens et al. (2011) Bouwens R. J., et al., 2011, ApJ, 737, 90
- Bouwens et al. (2015) Bouwens R. J., et al., 2015, ApJ, 803, 34
- Bouwens et al. (2016) Bouwens R. J., et al., 2016, ApJ, 830, 67
- Bouwens et al. (2019) Bouwens R. J., Stefanon M., Oesch P. A., Illingworth G. D., Nanayakkara T., Roberts-Borsani G., Labbé I., Smit R., 2019, ApJ, 880, 25
- Bouwens et al. (2021) Bouwens R. J., et al., 2021, AJ, 162, 47
- Bouwens et al. (2022a) Bouwens R. J., et al., 2022a, arXiv e-prints, p. arXiv:2211.02607
- Bouwens et al. (2022b) Bouwens R. J., et al., 2022b, ApJ, 931, 160
- Bouwens et al. (2022c) Bouwens R. J., Illingworth G., Ellis R. S., Oesch P., Stefanon M., 2022c, ApJ, 940, 55
- Bowler et al. (2015) Bowler R. A. A., et al., 2015, MNRAS, 452, 1817
- Bowler et al. (2020) Bowler R. A. A., Jarvis M. J., Dunlop J. S., McLure R. J., McLeod D. J., Adams N. J., Milvang-Jensen B., McCracken H. J., 2020, MNRAS, 493, 2059
- Boylan-Kolchin (2022) Boylan-Kolchin M., 2022, arXiv e-prints, p. arXiv:2208.01611
- Brammer et al. (2008) Brammer G. B., van Dokkum P. G., Coppi P., 2008, ApJ, 686, 1503
- Brammer et al. (2022) Brammer G., Strait V., Matharu J., Momcheva I., 2022, grizli, Zenodo, doi:10.5281/zenodo.6672538
- Bunker et al. (2023) Bunker A. J., et al., 2023, arXiv e-prints, p. arXiv:2302.07256
- Cameron et al. (2023) Cameron A. J., et al., 2023, arXiv e-prints, p. arXiv:2302.04298
- Carnall et al. (2023) Carnall A. C., et al., 2023, MNRAS, 518, L45
- Castellano et al. (2022) Castellano M., et al., 2022, ApJ, 938, L15
- Chabrier (2003) Chabrier G., 2003, PASP, 115, 763
- Coleman et al. (1980) Coleman G. D., Wu C. C., Weedman D. W., 1980, ApJS, 43, 393
- Cullen et al. (2022) Cullen F., et al., 2022, arXiv e-prints, p. arXiv:2208.04914
- Curtis-Lake et al. (2022) Curtis-Lake E., et al., 2022, arXiv e-prints, p. arXiv:2212.04568
- Donnan et al. (2023) Donnan C. T., et al., 2023, MNRAS, 518, 6011
- Duncan et al. (2014) Duncan K., et al., 2014, MNRAS, 444, 2960
- Dunlop et al. (2013) Dunlop J. S., et al., 2013, MNRAS, 432, 3520
- Endsley et al. (2022) Endsley R., Stark D. P., Whitler L., Topping M. W., Chen Z., Plat A., Chisholm J., Charlot S., 2022, arXiv e-prints, p. arXiv:2208.14999
- Ferrara et al. (2022) Ferrara A., Pallottini A., Dayal P., 2022, arXiv e-prints, p. arXiv:2208.00720
- Finkelstein et al. (2013) Finkelstein S. L., et al., 2013, Nature, 502, 524
- Finkelstein et al. (2015) Finkelstein S. L., et al., 2015, ApJ, 810, 71
- Finkelstein et al. (2022a) Finkelstein S. L., et al., 2022a, arXiv e-prints, p. arXiv:2207.12474
- Finkelstein et al. (2022b) Finkelstein S. L., et al., 2022b, arXiv e-prints, p. arXiv:2211.05792
- Finkelstein et al. (2022c) Finkelstein S. L., et al., 2022c, ApJ, 928, 52
- Fujimoto et al. (2023) Fujimoto S., et al., 2023, arXiv e-prints, p. arXiv:2301.09482
- Furtak et al. (2021) Furtak L. J., Atek H., Lehnert M. D., Chevallard J., Charlot S., 2021, MNRAS, 501, 1568
- Gehrels (1986) Gehrels N., 1986, ApJ, 303, 336
- Grazian et al. (2015) Grazian A., et al., 2015, A&A, 575, A96
- Harikane et al. (2018) Harikane Y., et al., 2018, PASJ, 70, S11
- Harikane et al. (2022) Harikane Y., et al., 2022, ApJS, 259, 20
- Harikane et al. (2023) Harikane Y., et al., 2023, ApJS, 265, 5
- Hashimoto et al. (2018) Hashimoto T., et al., 2018, Nature, 557, 392
- Illingworth et al. (2013) Illingworth G. D., et al., 2013, ApJS, 209, 6
- Inayoshi et al. (2022) Inayoshi K., Harikane Y., Inoue A. K., Li W., Ho L. C., 2022, ApJ, 938, L10
- Jiang et al. (2021) Jiang L., et al., 2021, Nature Astronomy, 5, 256
- Kannan et al. (2022) Kannan R., et al., 2022, arXiv e-prints, p. arXiv:2210.10066
- Kauffmann et al. (2022) Kauffmann O. B., et al., 2022, A&A, 667, A65
- Kikuchihara et al. (2020) Kikuchihara S., et al., 2020, ApJ, 893, 60
- Kocevski et al. (2023) Kocevski D. D., et al., 2023, arXiv e-prints, p. arXiv:2302.00012
- Kotulla et al. (2009) Kotulla R., Fritze U., Weilbacher P., Anders P., 2009, MNRAS, 396, 462
- Kron (1980) Kron R. G., 1980, ApJS, 43, 305
- Labbe et al. (2022) Labbe I., et al., 2022, arXiv e-prints, p. arXiv:2207.12446
- Larson et al. (2022) Larson R. L., et al., 2022, arXiv e-prints, p. arXiv:2211.10035
- Leethochawalit et al. (2023) Leethochawalit N., et al., 2023, ApJ, 942, L26
- Lovell et al. (2023) Lovell C. C., Harrison I., Harikane Y., Tacchella S., Wilkins S. M., 2023, MNRAS, 518, 2511
- Lucy (1974) Lucy L. B., 1974, AJ, 79, 745
- Madau & Dickinson (2014) Madau P., Dickinson M., 2014, ARA&A, 52, 415
- Mashian et al. (2016) Mashian N., Oesch P. A., Loeb A., 2016, MNRAS, 455, 2101
- Mason et al. (2015) Mason C. A., Trenti M., Treu T., 2015, ApJ, 813, 21
- Mason et al. (2023) Mason C. A., Trenti M., Treu T., 2023, MNRAS, 521, 497
- McLeod et al. (2016) McLeod D. J., McLure R. J., Dunlop J. S., 2016, MNRAS, 459, 3812
- McLure et al. (2013) McLure R. J., et al., 2013, MNRAS, 432, 2696
- Mirocha & Furlanetto (2023) Mirocha J., Furlanetto S. R., 2023, MNRAS, 519, 843
- Morishita & Stiavelli (2022) Morishita T., Stiavelli M., 2022, arXiv e-prints, p. arXiv:2207.11671
- Muñoz & Loeb (2008) Muñoz J. A., Loeb A., 2008, MNRAS, 386, 2323
- Naidu et al. (2022a) Naidu R. P., et al., 2022a, arXiv e-prints, p. arXiv:2208.02794
- Naidu et al. (2022b) Naidu R. P., et al., 2022b, ApJ, 940, L14
- Oesch et al. (2014) Oesch P. A., et al., 2014, ApJ, 786, 108
- Oesch et al. (2015) Oesch P. A., et al., 2015, ApJ, 804, L30
- Oesch et al. (2016) Oesch P. A., et al., 2016, ApJ, 819, 129
- Oesch et al. (2018) Oesch P. A., Bouwens R. J., Illingworth G. D., Labbé I., Stefanon M., 2018, ApJ, 855, 105
- Oke & Gunn (1983) Oke J. B., Gunn J. E., 1983, ApJ, 266, 713
- Ono et al. (2012) Ono Y., et al., 2012, ApJ, 744, 83
- Ono et al. (2022) Ono Y., et al., 2022, arXiv e-prints, p. arXiv:2208.13582
- Pontoppidan et al. (2022) Pontoppidan K. M., et al., 2022, ApJ, 936, L14
- Reddy & Steidel (2009) Reddy N. A., Steidel C. C., 2009, ApJ, 692, 778
- Richardson (1972) Richardson W. H., 1972, Journal of the Optical Society of America (1917-1983), 62, 55
- Rigby et al. (2022) Rigby J., et al., 2022, arXiv e-prints, p. arXiv:2207.05632
- Roberts-Borsani et al. (2022a) Roberts-Borsani G., et al., 2022a, arXiv e-prints, p. arXiv:2210.15639
- Roberts-Borsani et al. (2022b) Roberts-Borsani G., Morishita T., Treu T., Leethochawalit N., Trenti M., 2022b, ApJ, 927, 236
- Robertson et al. (2022) Robertson B. E., et al., 2022, arXiv e-prints, p. arXiv:2212.04480
- Saxena et al. (2023) Saxena A., et al., 2023, arXiv e-prints, p. arXiv:2302.12805
- Schenker et al. (2013) Schenker M. A., et al., 2013, ApJ, 768, 196
- Schlafly & Finkbeiner (2011) Schlafly E. F., Finkbeiner D. P., 2011, ApJ, 737, 103
- Song et al. (2016) Song M., et al., 2016, ApJ, 825, 5
- Stark et al. (2010) Stark D. P., Ellis R. S., Chiu K., Ouchi M., Bunker A., 2010, MNRAS, 408, 1628
- Stefanon et al. (2019) Stefanon M., et al., 2019, ApJ, 883, 99
- Stefanon et al. (2021) Stefanon M., Bouwens R. J., Labbé I., Illingworth G. D., Gonz alez V., Oesch P. A., 2021, ApJ, 922, 29
- Stefanon et al. (2022) Stefanon M., Bouwens R. J., Labbé I., Illingworth G. D., Oesch P. A., van Dokkum P., Gonzalez V., 2022, ApJ, 927, 48
- Stefanon et al. (2023) Stefanon M., Bouwens R. J., Labbé I., Illingworth G. D., Gonzalez V., Oesch P. A., 2023, ApJ, 943, 81
- Steidel et al. (1999) Steidel C. C., Adelberger K. L., Giavalisco M., Dickinson M., Pettini M., 1999, ApJ, 519, 1
- Steidel et al. (2003) Steidel C. C., Adelberger K. L., Shapley A. E., Pettini M., Dickinson M., Giavalisco M., 2003, ApJ, 592, 728
- Steinhardt et al. (2022) Steinhardt C. L., Kokorev V., Rusakov V., Garcia E., Sneppen A., 2022, arXiv e-prints, p. arXiv:2208.07879
- Tacchella et al. (2018) Tacchella S., Bose S., Conroy C., Eisenstein D. J., Johnson B. D., 2018, ApJ, 868, 92
- Tang et al. (2023) Tang M., et al., 2023, arXiv e-prints, p. arXiv:2301.07072
- Topping et al. (2022) Topping M. W., Stark D. P., Endsley R., Plat A., Whitler L., Chen Z., Charlot S., 2022, ApJ, 941, 153
- Treu et al. (2022) Treu T., et al., 2022, ApJ, 935, 110
- Whitler et al. (2023) Whitler L., Endsley R., Stark D. P., Topping M., Chen Z., Charlot S., 2023, MNRAS, 519, 157
- Wilkins et al. (2016) Wilkins S. M., Bouwens R. J., Oesch P. A., Labbé I., Sargent M., Caruana J., Wardlow J., Clay S., 2016, MNRAS, 455, 659
- Yan et al. (2023) Yan H., Ma Z., Ling C., Cheng C., Huang J.-S., 2023, ApJ, 942, L9
- Zavala et al. (2023) Zavala J. A., et al., 2023, ApJ, 943, L9
- Zheng et al. (2012) Zheng W., et al., 2012, Nature, 489, 406
- Zitrin et al. (2015) Zitrin A., et al., 2015, ApJ, 810, L12
Appendix A Candidates Identified in Our Secondary Reductions
As a test on the sensitivity of selections to the NIRCam reductions utilized, we perform a second search for galaxies but using reductions made with pencil (§2.1). 22 , 13 , 3 , and 1 galaxies are identified in these reductions.
The coordinates, photometric redshifts, apparent magnitudes, and spectral break amplitudes of the candidates we find are indicated in Table 10. Also presented is the difference between the minimum found for and fits to the observed SEDs of the sources, the estimated likelihood that a candidate has a redshift in excess of 5.5, and any earlier studies who identified a given source as part of their searches.
| Lyman Break | ||||||||
| ID | RA | DEC | [mag] | [mag] | Lit1 | |||
| Selection | ||||||||
| GLASSP2Z-4041319253 | 00:14:04.139 | 30:19:25.35 | 6.7 | 28.50.3 | 2.0 | 6.3 | 0.95 | |
| GLASSP2Z-4027418404 | 00:14:02.741 | 30:18:40.41 | 6.7 | 27.70.1 | 1.80.5 | 15.2 | 0.999 | B22 |
| S0723Z-3068426486 | 07:23:06.843 | 73:26:48.62 | 6.9 | 27.00.1 | 1.90.2 | 12.7 | 0.997 | |
| S0723Z-3154126292 | 07:23:15.413 | 73:26:29.28 | 7.0 | 25.00.1 | 2.10.1 | 6.2 | 0.951 | |
| GLASSP2Z-4029818477 | 00:14:02.988 | 30:18:47.77 | 7.2 | 28.50.2 | 2.1 | 6.2 | 0.984 | |
| GLASSP1Z-3589121028 | 00:13:58.915 | 30:21:02.80 | 7.4 | 28.60.3 | 2.3 | 11.2 | 0.998 | B22 |
| S0723Z-3053127492 | 07:23:05.311 | 73:27:49.22 | 7.4 | 26.20.1 | 2.82.3 | 7.7 | 0.984 | |
| GLASSP1Z-4027520346 | 00:14:02.759 | 30:20:34.68 | 7.4 | 27.90.2 | 2.3 | 15.6 | 1.0 | B22 |
| GLASSP1Z-4002221454 | 00:14:00.229 | 30:21:45.46 | 7.4 | 28.30.2 | 2.2 | 6.1 | 0.976 | |
| GLASSP1Z-3577921174 | 00:13:57.791 | 30:21:17.43 | 7.5 | 26.80.2 | 2.31.9 | 38.9 | 1.0 | B22 |
| GLASSP2Z-4018619113 | 00:14:01.860 | 30:19:11.38 | 7.5 | 28.30.2 | 2.0 | 9.9 | 0.997 | |
| GLASSP2Z-4011518065 | 00:14:01.152 | 30:18:06.58 | 7.5 | 28.30.2 | 2.1 | 15.2 | 1.0 | |
| GLASSP2Z-4005219093 | 00:14:00.520 | 30:19:09.31 | 7.5 | 28.60.3 | 2.0 | 4.3 | 0.934 | |
| S0723Z-3295626401 | 07:23:29.566 | 73:26:40.18 | 7.5 | 27.70.2 | 2.11.0 | 19.0 | 1.0 | B22 |
| S0723Z-3201526042 | 07:23:20.158 | 73:26:04.28 | 7.6 | 26.40.1 | 3.42.5 | 40.3 | 1.0 | D22,At22,Ad22,B22 |
| GLASSP1Z-4041221457 | 00:14:04.126 | 30:21:45.77 | 7.8 | 27.50.2 | 2.11.6 | 7.7 | 0.981 | B22 |
| GLASSP1Z-4020822000 | 00:14:02.082 | 30:22:00.07 | 7.8 | 26.80.2 | 2.4 | 6.6 | 0.977 | B22 |
| GLASSP1Z-4041820257 | 00:14:04.187 | 30:20:25.79 | 7.8 | 28.10.2 | 2.3 | 26.5 | 1.0 | |
| GLASSP2Z-4012218476 | 00:14:01.224 | 30:18:47.68 | 8.0 | 27.30.2 | 2.2 | 4.1 | 0.923 | |
| GLASSP1Z-4062820397 | 00:14:06.286 | 30:20:39.79 | 8.0 | 28.30.1 | 2.5 | 6.0 | 0.958 | |
| S0723Z-3226926062 | 07:23:22.697 | 73:26:06.23 | 8.1 | 25.90.1 | 3.9 | 49.8 | 1.0 | D22,At22,Ad22,B22 |
| GLASSP2Z-3553419246 | 00:13:55.345 | 30:19:24.63 | 8.6 | 27.60.1 | 3.0 | 22.1 | 1.0 | Le22 |
| Selection | ||||||||
| CEERSYJ-9494458188 | 14:19:49.446 | 52:58:18.89 | 8.8 | 28.00.2 | 1.62.2 | 9.4 | 0.993 | W22 (v1) |
| CEERSYJ-9193553160 | 14:19:19.358 | 52:53:16.01 | 9.0 | 28.20.2 | 1.71.5 | 17.2 | 1.0 | La22,F22 |
| CEERSYJ-0012959481 | 14:20:01.290 | 52:59:48.13 | 9.2 | 27.60.2 | 1.9 | 1.5 | 0.896 | F22,B22 |
| CEERSYJ-9353350378 | 14:19:35.336 | 52:50:37.88 | 9.3 | 27.80.2 | 1.71.6 | 8.4 | 0.982 | D22,F22,W22,B22 |
| GLASSP1YJ-4045920571 | 00:14:04.599 | 30:20:57.10 | 9.4 | 28.60.2 | 2.3 | 3.4 | 0.885 | |
| GLASSP1YJ-4016420474 | 00:14:01.649 | 30:20:47.44 | 9.6 | 29.50.4 | 2.2 | 6.0 | 0.954 | |
| CEERSYJ-9320850526 | 14:19:32.081 | 52:50:52.63 | 9.6 | 28.20.2 | 2.01.7 | 1.6 | 0.859 | |
| CEERSYJ-9132749268 | 14:19:13.277 | 52:49:26.89 | 9.7 | 28.20.2 | 2.0 | 4.9 | 0.962 | |
| GLASSP1YJ-4043920397 | 00:14:04.398 | 30:20:39.78 | 9.7 | 29.20.2 | 2.2 | 5.8 | 0.969 | H22 |
| CEERSYJ-9329250443 | 14:19:32.926 | 52:50:44.37 | 10.1 | 27.50.2 | 2.1 | 3.5 | 0.947 | |
| GLASSP1YJ-4028522189 | 00:14:02.857 | 30:22:18.92 | 10.3 | 26.60.1 | 3.3 | 33.7 | 1.0 | N22,C22,D22,H22,B22 |
| CEERSYJ-9006450120 | 14:19:00.643 | 52:50:12.00 | 10.4 | 28.00.2 | 1.8 | 7.7 | 0.99 | W22 |
| CEERSYJ-9240348289 | 14:19:24.032 | 52:48:28.97 | 10.7 | 28.00.2 | 1.5 | 9.2 | 0.992 | D22,F22 |
| Selection | ||||||||
| CEERSH-9463556328 | 14:19:46.353 | 52:56:32.81 | 11.9 | 27.70.2 | 1.51.2 | 9.1 | 0.993 | D22,F22,H22,B22 |
| GLASSP2H-3576218534 | 00:13:57.629 | 30:18:53.43 | 13.4 | 28.10.2 | 1.8 | 11.3 | 0.999 | B22 |
| CEERSH-9220551139 | 14:19:22.054 | 52:51:13.94 | 13.5 | 27.60.2 | 1.9 | 3.4 | 0.94 | |
| Selection | ||||||||
| CEERSK-9394956349 | 14:19:39.491 | 52:56:34.90 | 16.0 | 26.30.1 | 1.50.1 | 4.2 | 0.885 | D22,F22,H22,N22,B22 |
1 Ad22 = Adams
et al. (2023), At22 = Atek
et al. (2023), C22 = Castellano
et al. (2022), D22 = Donnan
et al. (2023), H22 = Harikane
et al. (2023), La22 = Labbe
et al. (2022), N22 = Naidu
et al. (2022b, a), W22 = Whitler et al. (2023), Y22 = Yan et al. (2023), B22 = This Work (fiducial reductions: see Table 2)
Appendix B Assessments of Candidates in the Literature
Given the considerable uncertainties regarding both the identity and total number of high-quality candidate galaxies that have been identified to present, we have performed independent photometry on candidates reported in a large number of manuscripts, as described in §3.3. Use was made both of a reduction of the NIRCam imaging data with the grizli and pencil pipelines. We then categorized these candidates in three categories “robust,” “solid,” and “possible.”
The purpose of this appendix is to present candidates from the literature which we classify as “solid” and “possible.” Those classified as “robust” have already been tabulated in Table 3. We place those candidates in Tables 11-12 and 13-15, respectively.
| ID | RA | DEC | Break [mag] | Lit | ||||
| Castellano et al. (2022) | ||||||||
| GHZ3 | 00:14:06.940 | -30:21:49.72 | 9.3/11.3 | 20.8 | 1.8,0.72.4 | 4.1,1.3 | 0.862,0.814 | B22 |
| GHZ4 | 00:14:03.291 | -30:21:05.57 | 9.9/10.8 | 19.8 | 1.2,1.7 | 5.5,6.4 | 0.950,0.987 | H22 |
| Adams et al. (2023) | ||||||||
| 1514 | 07:22:27.506 | -73:28:38.61 | 9.9/10.0 | 19.7 | 1.90.8 | 1.0 | 0.811 | M22 |
| 10234 | 07:22:39.597 | -73:30:06.25 | 11.5/11.7 | 20.6 | 1.20.2,1.30.3 | 7.9,10.6 | 0.971,0.997 | |
| Atek et al. (2023) | ||||||||
| SMACS_z12b | 07:22:52.245 | -73:27:55.47 | 12.3/12.9 | 20.0 | 2.22.4,1.4 | 4.8,4.5 | 0.961,0.938 | Y22,B22 |
| SMACS_z16b | 07:22:39.416 | -73:30:08.15 | 15.3/14.9 | 21.0 | 1.7,1.2 | 6.4,6.3 | 0.971,0.952 | B22 |
| Donnan et al. (2023 , v2) | ||||||||
| 29274_4 | 14:19:27.385 | 52:51:46.92 | 8.9/10.7 | 18.4 | 0.8,1.3 | 0.9,2.1 | 0.857,0.821 | |
| 1434_2 | 14:19:26.110 | 52:52:52.41 | 9.2/10.2 | 18.8 | 1.4,1.4 | 3.6,0.5 | 0.922,0.688 | |
| 43866 | 07:23:25.597 | -73:26:12.41 | 9.5/7.9 | 18.1 | 1.20.7,1.50.4 | 3.7,2.2 | 0.958,0.771 | |
| 5071 | 07:22:56.854 | -73:29:23.48 | 9.5/8.3 | 18.0 | 0.30.8,0.50.6 | 2.1,1.7 | 0.887,0.794 | |
| 14391 | 07:22:47.724 | -73:28:28.31 | 9.5/9.2 | 18.8 | 1.30.3,1.90.7 | 0.1,6.3 | 0.576,0.975 | |
| 12682 | 07:22:38.948 | -73:28:30.37 | 9.6/8.9 | 18.9 | 1.6,1.7 | 5.6,6.7 | 0.985,0.990 | |
| 15019 | 07:22:58.265 | -73:28:19.53 | 9.7/8.7 | 18.7 | 1.0,1.3 | 1.8,1.3 | 0.870,0.784 | |
| 6200 | 07:22:41.502 | -73:29:10.61 | 9.8/8.9 | 18.5 | 1.3,1.4 | 3.2,3.3 | 0.932,0.931 | |
| 3763 | 07:22:49.132 | -73:29:31.17 | 9.9/8.0 | 19.0 | 2.01.5,2.3 | 0.2,4.7 | 0.767,0.978 | |
| 7606 | 07:22:29.557 | -73:29:05.66 | 9.9/9.3 | 18.1 | 0.7,0.6 | 3.8,2.9 | 0.945,0.923 | |
| 3710 | 14:19:24.026 | 52:48:28.99 | 10.4/10.3 | 19.1 | 1.2,1.6 | 5.2,10.6 | 0.965,0.996 | F22,B22M |
| 73150 | 14:19:26.780 | 52:54:16.61 | 10.6/10.4 | 19.1 | 1.4,1.8 | 6.4,11.8 | 0.973,0.998 | F22 |
| 20757 | 07:23:12.463 | -73:28:01.71 | 10.7/12.8 | 17.9 | 1.3,0.9 | 1.6,2.4 | 0.545,0.899 | |
| 26598 | 07:22:50.553 | -73:27:37.86 | 10.8/9.7 | 18.5 | 1.0,1.3 | 3.2,5.2 | 0.920,0.966 | |
| 120880 | 14:20:10.558 | 52:59:39.51 | 10.8/10.4 | 19.4 | 1.2,1.0 | 8.7,6.8 | 0.983,0.969 | WA22,F22 |
| 6415 | 00:14:00.275 | -30:21:25.90 | 10.8/10.6 | 19.1 | 1.9,1.6 | 5.6,5.4 | 0.975,0.972 | H22,B22 |
| 622_4 | 14:19:16.536 | 52:47:47.38 | 11.3/11.2 | 18.9 | 1.0,1.4 | 4.3,3.8 | 0.934,0.910 | |
| 77241 | 14:19:41.462 | 52:54:41.51 | 11.3/11.2 | 19.3 | 1.0,1.11.8 | 10.5,6.9 | 0.995,0.984 | F22 |
| 33593_2 | 14:19:37.588 | 52:56:43.85 | 11.3/11.4 | 19.6 | 1.4,1.1 | 4.0,2.3 | 0.753,0.721 | F22 |
| 5268_2 | 14:19:19.678 | 52:53:32.14 | 11.4/11.3 | 19.2 | 0.90.9,1.61.4 | 2.8,5.1 | 0.840,0.959 | |
| 8347 | 07:22:56.351 | -73:29:00.49 | 11.9/11.7 | 19.1 | 1.10.5,1.4 | 4.5,8.0 | 0.898,0.987 | |
| 26409_4 | 14:19:38.478 | 52:51:18.16 | 11.9/14.5 | 18.8 | 0.71.3,0.9 | 3.4,3.9 | 0.914,0.941 | |
| 10566 | 07:23:03.469 | -73:28:46.97 | 12.0/13.7 | 19.7 | 1.6,1.7 | 8.2,5.9 | 0.991,0.978 | |
| 27535_4 | 14:19:27.307 | 52:51:29.20 | 12.6/12.3 | 19.4 | 1.9,2.3 | 6.5,6.9 | 0.970,0.987 | |
| 93316 | 14:19:39.481 | 52:56:34.96 | 16.4/16.3 | 21.3 | 1.70.1,1.60.1 | 8.7,7.2 | 0.987,0.962 | H22,F22,B22,B22M, |
| N22,Z22 | ||||||||
| Donnan et al. (2023 , v1) | ||||||||
| 28093 | 07:23:37.889 | -73:27:21.87 | 9.2/9.0 | 18.9 | 1.2,1.5 | 5.6,6.0 | 0.973,0.962 | |
| 26225 | 14:19:11.028 | 52:50:22.44 | 9.2/9.6 | 18.7 | 1.2,1.9 | 1.2,1.8 | 0.562,0.816 | |
| 78693 | 14:19:39.375 | 52:54:49.55 | 9.6/11.1 | 18.5 | 0.9,1.0 | 3.2,3.4 | 0.871,0.873 | |
| 45704 | 14:19:28.719 | 52:51:36.87 | 10.0/10.9 | 18.6 | 0.8,1.0 | 2.9,3.4 | 0.860,0.891 | |
| 30498 | 14:19:28.710 | 52:50:37.16 | 10.9/10.5 | 19.6 | 1.5,1.92.3 | 3.6,6.2 | 0.921,0.979 | F22 |
| 6486 | 07:22:53.246 | -73:29:08.77 | 12.6/12.8 | 18.6 | 1.2,1.0 | 2.8,2.4 | 0.845,0.879 | |
| Labbe et al. (2022) | ||||||||
| 2859 | 14:19:21.728 | 52:49:04.57 | 8.9/7.4 | 19.2 | 0.30.4,0.90.3 | 7.2,5.3 | 0.996,0.989 | |
| Morishita & Stiavelli (2022 , v2) | ||||||||
| WDFC1152 | 07:23:03.570 | -73:27:05.00 | 12.7/13.3 | 20.0 | 1.32.6,1.9 | 2.0,5.8 | 0.828,0.963 | |
| WDFP3504 | 07:22:47.117 | -73:28:36.68 | 13.4/9.4 | 19.4 | 1.01.4,0.8 | 3.3,4.8 | 0.879,0.962 | |
| Harikane et al. (2023 , v2) | ||||||||
| GLz910 | 00:14:03.473 | -30:19:00.89 | 8.7/10.8 | 18.2 | 0.7,1.4 | 4.6,5.1 | 0.949,0.959 | |
| GLz913 | 00:13:57.453 | -30:17:59.97 | 8.7/8.3 | 18.1 | 1.5,1.6 | 3.0,4.9 | 0.813,0.942 | |
| GLz98 | 00:14:00.833 | -30:21:29.77 | 9.1/11.4 | 18.1 | 1.3,1.11.1 | 0.6,6.5 | 0.541,0.975 | |
| GLz99 | 00:14:03.728 | -30:21:03.49 | 9.3/10.6 | 18.1 | 0.9,0.2 | 2.8,0.7 | 0.915,0.792 | |
| Harikane et al. (2023 , v1) | ||||||||
| GLz911 | 00:14:06.587 | -30:20:56.08 | 8.7/8.5 | 18.4 | 1.1,1.4 | 4.5,6.8 | 0.929,0.972 | |
| CR6z121 | 14:19:17.510 | 52:49:35.38 | 12.0/11.9 | 18.1 | 1.2,1.4 | 3.4,6.7 | 0.915,0.981 | |
∗ Same remarks apply to this table as Table 3
| ID | RA | DEC | Break [mag] | Lit | ||||
| Whitler et al. (2023 , v2) | ||||||||
| EGS37135 | 14:19:58.650 | 52:59:21.80 | 8.9/9.2 | 20.3 | 1.90.7,1.40.4 | 15.1,7.1 | 0.999,0.970 | F22,B22 |
| EGS7860 | 14:19:00.643 | 52:50:12.00 | 10.1/10.3 | 19.6 | 1.8,1.8 | 7.8,7.7 | 0.986,0.990 | B22M |
| Whitler et al. (2023 , v1) | ||||||||
| EGS38601 | 14:19:56.427 | 52:59:25.69 | 8.8/8.2 | 20.3 | 0.60.1,0.80.1 | 5.9,7.4 | 0.935,0.980 | |
| EGS11330 | 14:19:35.255 | 52:50:56.47 | 9.5/10.2 | 19.3 | 1.4,1.8 | 1.8,2.2 | 0.799,0.867 | |
| Finkelstein et al. (2022b) | ||||||||
| CEERS2_2274 | 14:19:23.077 | 52:53:38.41 | 8.6/8.4 | 18.4 | 0.71.5,0.83.2 | 9.4,4.0 | 0.997,0.900 | |
| CEERS1_5534 | 14:19:48.017 | 52:56:57.40 | 8.6/8.5 | 19.6 | 0.90.5,1.00.8 | 10.4,3.8 | 0.992,0.958 | |
| CEERS6_4012 | 14:19:33.148 | 52:51:32.37 | 8.9/9.0 | 19.9 | 1.10.8,1.20.8 | 4.7,1.2 | 0.901,0.651 | |
| CEERS1_1875 | 14:19:48.459 | 52:58:18.28 | 8.9/9.6 | 20.4 | 1.4,1.4 | 3.4,0.3 | 0.904,0.704 | |
| CEERS1_3908 | 14:20:01.240 | 52:59:47.71 | 9.0/9.8 | 20.2 | 1.6,1.9 | 10.0,5.2 | 0.993,0.961 | B22,B22M |
| CEERS6_7603 | 14:19:36.297 | 52:50:49.20 | 11.3/11.6 | 19.0 | 1.11.6,1.0 | 3.9,6.0 | 0.880,0.948 | D22 |
| Yan et al. (2023) | ||||||||
| F150DB026 | 07:23:23.735 | -73:27:40.59 | 11.4/10.5 | 19.4 | 1.1,1.8 | 7.9,3.7 | 0.989,0.965 | |
| F150DA060 | 07:22:40.758 | -73:28:23.75 | 11.4/12.6 | 19.2 | 1.7,1.2 | 5.3,0.3 | 0.957,0.550 | |
| F150DB013 | 07:23:05.525 | -73:27:50.66 | 11.4/13.1 | 20.1 | 0.9,1.6 | 1.2,3.5 | 0.616,0.904 | |
| F150DB084 | 07:23:07.540 | -73:26:23.79 | 11.6/12.2 | 19.4 | 0.82.5,0.8 | 0.5,0.2 | 0.764,0.707 | |
| F150DA038 | 07:23:02.955 | -73:28:46.16 | 13.4/12.0 | 19.2 | 0.9,0.5 | 1.1,0.8 | 0.792,0.719 | |
| F150DA008 | 07:22:52.747 | -73:29:51.64 | 13.4/12.5 | 20.1 | 0.4,0.1 | 0.3,0.5 | 0.763,0.749 | |
| F150DA007 | 07:22:44.875 | -73:29:53.68 | 13.4/13.4 | 19.5 | 1.8,1.01.0 | 2.2,0.4 | 0.836,0.612 | |
| F200DA089 | 07:22:32.427 | -73:28:06.77 | 14.2/14.8 | 19.0 | 0.7,1.0 | 1.1,1.4 | 0.751,0.766 | |
| F150DB007 | 07:23:23.966 | -73:27:58.78 | 14.6/14.7 | 20.0 | 1.11.9,1.4 | 0.4,1.3 | 0.783,0.710 | |
| F150DB048 | 07:23:01.562 | -73:27:18.02 | 15.0/12.1 | 21.0 | 1.50.3,1.10.4 | 7.9,1.1 | 0.969,0.554 | |
| F200DB086 | 07:23:06.415 | -73:27:19.85 | 15.4/14.2 | 20.2 | 1.2,2.0 | 0.4,2.4 | 0.787,0.915 | |
| F200DB015 | 07:23:07.672 | -73:28:01.56 | 16.0/18.4 | 19.4 | 1.6,1.5 | 10.3,6.2 | 0.997,0.975 | |
| F200DA034 | 07:23:05.208 | -73:29:13.37 | 19.8/10.0 | 19.2 | 0.51.0,1.1 | 0.2,0.6 | 0.616,0.817 | |
| F200DA098 | 07:22:34.793 | -73:28:00.21 | 19.8/15.3 | 19.4 | 1.1,0.4 | 0.6,1.2 | 0.702,0.817 | |
| This Work (Fiducial Sample) | ||||||||
| GLASSP1J4003721456 | 00:14:00.378 | -30:21:45.54 | 9.2/9.2 | 19.2 | 1.6,1.3 | 4.1,4.4 | 0.953,0.964 | |
| This Work (Alternate Sample) | ||||||||
| CEERSJ9494458188 | 14:19:49.446 | 52:58:18.89 | 8.8/9.0 | 19.2 | 1.21.8,1.62.2 | 5.0,9.4 | 0.913,0.993 | |
| GLASSP1J4016420474 | 00:14:01.649 | -30:20:47.44 | 9.6/9.6 | 18.9 | 2.2 | 6.0 | 0.954 | |
| CEERSJ9132749268 | 14:19:13.277 | 52:49:26.89 | 9.7/9.7 | 19.0 | 2.0 | 4.9 | 0.962 | |
| CEERSJ9329250443 | 14:19:32.926 | 52:50:44.37 | 10.1/10.1 | 19.3 | 1.6,2.1 | 0.4,3.5 | 0.527,0.947 | |
| GLASSP1H4015021230 | 00:14:01.507 | -30:21:22.85 | 13.3/11.3 | 18.9 | 0.9,1.4 | 0.2,6.3 | 0.741,0.968 | |
∗ Same remarks apply to this table as Table 3
| ID | RA | DEC | Break [mag] | Lit | ||||
| Castellano et al. (2022 , v2) | ||||||||
| GHZ6 | 00:13:54.970 | 30:18:53.68 | 9.1/9.7 | 20.1 | 0.91.0,1.0 | 3.8,1.4 | 0.063,0.382 | |
| GHZ5 | 00:13:58.661 | 30:18:27.39 | 9.2/7.2 | 20.2 | 1.01.0,1.61.0 | 5.4,6.2 | 0.116,0.049 | |
| Castellano et al. (2022 , v1) | ||||||||
| GHZ6 | 00:13:57.689 | 30:19:37.71 | 9.1/11.2 | 19.4 | 0.63.4,1.11.9 | 1.7,18.2 | 0.394,0.001 | |
| Atek et al. (2023 , v2) | ||||||||
| SMACS_z10d | 07:22:46.695 | 73:28:40.88 | 9.3/10.8 | 19.8 | 1.4,0.91.2 | 1.4,3.4 | 0.664,0.129 | |
| SMACS_z10e | 07:22:45.296 | 73:29:30.52 | 10.9/10.3 | 18.9 | 0.9,1.4 | 2.0,1.2 | 0.328,0.461 | |
| SMACS_z11a | 07:22:39.500 | 73:29:40.20 | 11.1/10.6 | 18.6 | 1.5,1.00.9 | 2.0,2.4 | 0.714,0.230 | |
| SMACS_z12a | 07:22:47.373 | 73:30:01.76 | 12.2/12.7 | 19.8 | 1.00.9,1.22.3 | 2.6,0.9 | 0.283,0.556 | |
| SMACS_z16a | 07:23:26.387 | 73:28:04.55 | 15.9/10.6 | 20.6 | 1.1,1.1 | 1.7,0.3 | 0.311,0.523 | |
| Atek et al. (2023 , v1) | ||||||||
| SMACS_z10f | 07:22:57.297 | 73:29:16.49 | 10.5/8.9 | 19.2 | 1.52.1,1.00.4 | 0.8,1.8 | 0.525,0.201 | |
| SMACS_z11b | 07:22:53.835 | 73:28:23.28 | 11.2/9.7 | 22.4 | 1.71.3 | 1.7 | 0.305 | |
| SMACS_z11c | 07:23:01.597 | 73:26:54.89 | 11.2/10.9 | 19.6 | 0.9,1.8 | 0.8,0.1 | 0.530,0.540 | |
| SMACS_z11d | 07:22:36.750 | 73:28:09.17 | 11.3/10.7 | 21.8 | 1.92.6,0.70.2 | 0.3,5.7 | 0.560,0.029 | |
| SMACS_z11e | 07:22:49.255 | 73:27:44.56 | 11.5/12.3 | 19.2 | 1.01.7,1.21.4 | 1.0,1.8 | 0.675,0.621 | Y22 |
| Donnan et al. (2023 , v2) | ||||||||
| 3398 | 07:22:35.369 | 73:29:38.62 | 9.7/8.2 | 18.2 | 1.4,1.3 | 1.4,0.5 | 0.608,0.717 | |
| 4063 | 07:22:52.307 | 73:29:32.38 | 10.4/8.1 | 18.0 | 1.0,1.2 | 3.4,1.4 | 0.411,0.526 | |
| 6647 | 14:19:14.663 | 52:48:49.77 | 10.4/9.8 | 18.9 | 1.1,1.4 | 1.8,0.5 | 0.295,0.528 | |
| 21071_2 | 14:19:36.716 | 52:55:22.66 | 10.7/10.2 | 19.3 | 0.91.2,1.01.7 | 5.8,2.8 | 0.112,0.200 | |
| 61486 | 14:19:23.727 | 52:53:00.98 | 11.2/10.5 | 19.6 | 1.7,1.6 | 2.0,0.9 | 0.510,0.683 | |
| 1566 | 07:22:39.183 | 73:30:00.55 | 12.3/10.0 | 18.8 | 1.01.1,1.12.1 | 2.5,0.8 | 0.352,0.561 | |
| Donnan et al. (2023 , v1) | ||||||||
| 2873 | 14:19:21.556 | 52:48:20.82 | 9.0/9.6 | 18.8 | 1.2,1.91.8 | 1.3,3.5 | 0.468,0.326 | |
| 9544 | 07:22:38.627 | 73:28:46.53 | 9.1/9.0 | 19.0 | 1.20.5,1.91.2 | 4.1,1.1 | 0.181,0.536 | |
| 111451 | 14:19:50.598 | 52:58:48.64 | 9.1/9.2 | 18.9 | 1.5,0.81.2 | 1.1,1.4 | 0.568,0.433 | |
| 106309 | 14:19:52.004 | 52:58:05.85 | 9.2/9.0 | 18.8 | 1.82.3,1.5 | 0.3,0.2 | 0.718,0.631 | F22 |
| 110933 | 14:20:00.345 | 52:58:44.25 | 9.3/8.9 | 18.7 | 1.2,1.11.5 | 3.9,6.0 | 0.356,0.204 | |
| 108408 | 14:19:46.666 | 52:58:21.42 | 9.3/9.7 | 19.1 | 1.7,1.7 | 1.8,1.7 | 0.355,0.483 | |
| 107364 | 14:19:49.568 | 52:58:13.33 | 10.2/8.6 | 19.1 | 0.80.6,0.80.8 | 7.8,5.3 | 0.027,0.055 | |
| 20311 | 14:18:59.916 | 52:49:56.40 | 10.8/10.7 | 19.3 | 1.81.7,1.20.5 | 1.1,7.3 | 0.727,0.030 | |
| 78598 | 14:19:30.185 | 52:54:48.79 | 11.0/12.0 | 19.5 | 1.12.9,1.1 | 2.4,3.1 | 0.418,0.279 | |
| 35470 | 07:23:02.966 | 73:26:47.49 | 12.0/12.4 | 19.2 | 1.4,1.8 | 0.1,0.8 | 0.581,0.567 | |
| 21901 | 07:22:46.756 | 73:27:49.43 | 12.2/12.4 | 19.0 | 1.51.5,1.9 | 1.2,0.4 | 0.587,0.697 | |
| 40079 | 07:23:13.894 | 73:26:05.07 | 14.3/12.3 | 19.6 | 1.1,0.8 | 3.2,0.1 | 0.354,0.595 | |
| Morishita & Stiavelli (2022 , v2) | ||||||||
| WDFP3004 | 07:22:53.064 | 73:28:07.66 | 10.0/8.3 | 18.9 | 1.3,1.9 | 0.0,0.3 | 0.649,0.765 | |
| WDFC1730 | 07:23:22.754 | 73:26:25.63 | 13.8/11.4 | 19.8 | 1.0,1.7 | 1.9,2.6 | 0.296,0.859 | Y22 |
| Harikane et al. (2023 , v2) | ||||||||
| GLz95 | 00:14:03.114 | 30:22:26.29 | 8.7/8.6 | 18.8 | 1.7,1.0 | 0.4,0.5 | 0.728,0.471 | |
| GLz93 | 00:14:00.093 | 30:19:06.89 | 8.9/5.7 | 18.8 | 0.92.4,1.20.1 | 0.1,0.1 | 0.520,0.478 | |
| GLz96 | 00:14:04.398 | 30:20:39.78 | 9.0/8.8 | 18.9 | 2.0,2.2 | 3.1,5.8 | 0.286,0.969 | B22M |
| GLz912 | 00:14:06.869 | 30:22:01.96 | 9.1/7.3 | 18.2 | 1.62.0,0.2 | 0.7,0.5 | 0.507,0.577 | |
| GLz911 | 00:14:02.489 | 30:22:00.91 | 9.9/10.3 | 18.6 | 0.62.1,0.5 | 1.9,0.4 | 0.308,0.637 | |
| GLz97 | 00:14:02.533 | 30:21:57.09 | 10.3/10.7 | 18.2 | 1.21.1,1.5 | 1.4,2.1 | 0.479,0.845 | |
| CR2z123 | 14:19:41.606 | 52:55:07.60 | 11.7/12.0 | 19.2 | 0.6,0.61.1 | 1.1,0.4 | 0.781,0.607 | |
| CR2z122 | 14:19:42.567 | 52:54:42.03 | 12.0/10.7 | 19.0 | 1.11.8,1.3 | 5.7,3.1 | 0.241,0.429 | |
| CR2z124 | 14:19:24.858 | 52:53:13.93 | 12.1/11.3 | 19.0 | 0.3,0.41.0 | 0.7,0.6 | 0.733,0.649 | |
| SMz121 | 07:22:32.471 | 73:28:33.18 | 12.5/10.2 | 18.5 | 1.3,1.2 | 1.7,0.0 | 0.408,0.744 | Y22 |
∗ Same remarks apply to this table as Table 3
| ID | RA | DEC | Break [mag] | Lit | ||||
| Harikane et al. (2023 , v1) | ||||||||
| GLz95 | 00:13:58.209 | 30:21:34.29 | 9.2/9.0 | 18.7 | 1.5,1.51.6 | 15.2,19.1 | 0.001,0.000 | |
| GLz915 | 00:14:00.487 | 30:21:24.49 | 9.8/8.9 | 18.1 | 0.8,1.1 | 2.0,0.9 | 0.452,0.562 | |
| SMz121 | 07:22:58.264 | 73:28:32.99 | 11.5/13.0 | 18.0 | 1.1,1.22.7 | 1.7,0.6 | 0.793,0.647 | |
| CR2z122 | 14:19:24.237 | 52:54:24.81 | 11.6/6.8 | 19.4 | 0.91.8,0.6 | 0.7,4.5 | 0.692,0.255 | |
| CR3z121 | 14:19:11.106 | 52:49:33.70 | 11.7/10.1 | 18.3 | 1.0,1.1 | 1.5,0.3 | 0.772,0.522 | H22 |
| CR2z123 | 14:19:30.405 | 52:52:51.35 | 12.1/12.7 | 19.2 | 0.6,1.0 | 1.3,0.4 | 0.524,0.674 | |
| Whitler et al. (2023 , v2) | ||||||||
| EGS34362 | 14:20:03.000 | 53:00:04.88 | 9.2/9.1 | 20.2 | 1.40.8 | 5.5 | 0.098 | |
| EGS14506 | 14:19:13.719 | 52:51:44.49 | 10.7/9.2 | 20.2 | 1.00.6,0.90.3 | 2.3,5.5 | 0.331,0.051 | |
| Whitler et al. (2023 , v1) | ||||||||
| EGS36603 | 14:20:09.204 | 52:59:54.73 | 9.3/7.9 | 19.9 | 0.71.5 | 1.4 | 0.731 | |
| EGS42956 | 14:19:48.045 | 52:58:27.52 | 10.4/9.2 | 19.9 | 1.31.6,1.52.3 | 1.2,0.8 | 0.396,0.421 | |
| Finkelstein et al. (2022b) | ||||||||
| CEERS1_7227 | 14:20:08.996 | 52:59:57.79 | 11.2/10.9 | 19.2 | 0.82.3 | 0.6 | 0.335 | |
| CEERS1_1730 | 14:20:02.397 | 53:00:49.09 | 13.4/12.7 | 20.2 | 1.00.9 | 1.6 | 0.572 | |
| Yan et al. (2023) | ||||||||
| F150DBC_4 | 07:23:25.966 | 73:26:39.89 | 10.4/9.8 | 19.9 | 1.80.1,1.80.2 | 3.8,4.4 | 0.215,0.151 | |
| F150DB040 | 07:23:11.937 | 73:27:24.93 | 10.8/7.7 | 20.5 | 0.51.6,0.91.6 | 5.3,6.2 | 0.065,0.069 | |
| F150DA026 | 07:22:46.013 | 73:29:08.12 | 11.0/8.2 | 19.1 | 0.20.8,0.93.2 | 1.1,2.3 | 0.258,0.380 | |
| F150DA036 | 07:23:00.669 | 73:28:48.71 | 11.0/11.2 | 19.2 | 0.90.4,0.81.1 | 3.0,3.6 | 0.219,0.205 | |
| F150DA020 | 07:22:55.876 | 73:29:17.45 | 11.2/7.9 | 19.3 | 0.71.0,0.8 | 1.6,1.6 | 0.179,0.399 | |
| F150DA005 | 07:22:41.008 | 73:29:54.98 | 11.2/9.8 | 19.4 | 0.70.3,0.60.4 | 6.5,4.8 | 0.029,0.041 | |
| F150DA062 | 07:22:54.222 | 73:28:23.56 | 11.4/8.6 | 19.9 | 0.9,0.92.8 | 1.4,0.6 | 0.437,0.514 | |
| F150DA057 | 07:22:58.715 | 73:28:28.37 | 11.4/9.9 | 20.9 | 1.01.4,1.01.0 | 8.4,9.2 | 0.019,0.014 | |
| F150DA066 | 07:22:39.616 | 73:28:12.16 | 11.4/10.5 | 19.8 | 1.00.3,0.91.2 | 7.0,6.4 | 0.080,0.135 | |
| F150DB075 | 07:23:02.229 | 73:26:41.51 | 11.4/10.8 | 21.2 | 1.5,2.1 | 5.5,4.0 | 0.076,0.110 | |
| F150DA054 | 07:22:38.904 | 73:28:30.84 | 11.4/11.1 | 19.2 | 0.90.4,1.41.8 | 0.2,2.2 | 0.481,0.826 | |
| F150DB090 | 07:23:26.236 | 73:26:13.82 | 11.4/11.3 | 21.6 | 1.20.6,1.30.7 | 5.3,7.0 | 0.026,0.011 | |
| F150DA052 | 07:22:26.930 | 73:28:33.80 | 11.4/12.2 | 19.3 | 1.01.2 | 0.4 | 0.591 | |
| F150DA031 | 07:22:40.648 | 73:29:00.50 | 11.4/13.1 | 19.6 | 1.10.7,1.11.0 | 1.5,1.3 | 0.632,0.664 | |
| F150DB054 | 07:23:12.503 | 73:27:10.74 | 11.4/15.0 | 19.3 | 1.01.0,0.70.5 | 3.4,7.4 | 0.265,0.026 | |
| F150DB076 | 07:23:29.414 | 73:26:39.77 | 11.6/6.0 | 19.6 | 0.50.5,0.70.5 | 8.3,8.5 | 0.008,0.006 | |
| F150DB050 | 07:23:24.576 | 73:27:15.06 | 11.6/6.7 | 19.5 | 0.80.7,1.41.4 | 14.5,18.3 | 0.001,0.000 | |
| F150DB044 | 07:23:39.315 | 73:27:22.28 | 11.6/7.0 | 19.6 | 0.80.3,0.40.3 | 20.1,20.2 | 0.000,0.000 | |
| F150DB095 | 07:23:24.766 | 73:26:01.29 | 11.6/9.3 | 19.4 | 1.42.5,1.71.0 | 3.9,2.1 | 0.156,0.138 | |
| F150DB011 | 07:23:27.382 | 73:27:58.03 | 11.6/10.8 | 19.5 | 0.70.3,0.70.5 | 7.4,7.4 | 0.030,0.041 | |
| F150DA019 | 07:22:39.395 | 73:29:20.47 | 11.6/11.1 | 19.4 | 0.8,1.2 | 4.4,1.9 | 0.165,0.400 | |
| F150DB088 | 07:23:14.037 | 73:26:17.28 | 11.6/11.5 | 19.7 | 1.10.9,1.10.2 | 10.4,10.5 | 0.003,0.004 | |
| F150DB031 | 07:23:21.438 | 73:27:36.32 | 11.6/13.1 | 19.2 | 1.2,1.7 | 0.3,1.0 | 0.649,0.443 | |
| F150DB021 | 07:23:12.643 | 73:27:45.24 | 11.8/6.2 | 20.5 | 0.50.3,0.30.2 | 0.6,0.8 | 0.265,0.204 | |
| F150DA078 | 07:22:49.244 | 73:27:49.86 | 11.8/8.1 | 19.8 | 1.11.8,1.72.6 | 0.7,2.1 | 0.447,0.158 | |
| F150DB069 | 07:23:04.258 | 73:26:54.20 | 11.8/11.2 | 19.4 | 1.00.6,1.8 | 1.6,2.2 | 0.468,0.784 | |
| F150DA015 | 07:22:44.735 | 73:29:26.86 | 11.8/11.5 | 19.3 | 0.9,0.70.5 | 1.0,3.7 | 0.574,0.143 | |
| F150DA083 | 07:22:42.714 | 73:27:32.28 | 11.8/13.2 | 20.6 | 1.00.8,0.9 | 2.6,1.7 | 0.358,0.351 | |
| F150DA010 | 07:22:40.082 | 73:29:46.12 | 12.8/10.8 | 19.4 | 0.70.4,0.30.7 | 4.1,5.3 | 0.107,0.064 | |
| F150DA058 | 07:22:48.273 | 73:28:27.35 | 13.4/8.6 | 20.0 | 0.7,0.8 | 2.0,1.7 | 0.266,0.334 | |
| F150DA075 | 07:22:38.343 | 73:27:57.09 | 13.4/9.4 | 19.8 | 0.50.7,1.0 | 0.2,2.0 | 0.751,0.535 | |
| F150DA050 | 07:22:44.994 | 73:28:36.88 | 13.4/10.0 | 19.9 | 1.5,0.80.4 | 0.6,2.1 | 0.500,0.276 | |
| F150DB079 | 07:23:13.156 | 73:26:29.64 | 13.8/12.5 | 19.8 | 1.32.2,1.5 | 0.1,0.1 | 0.639,0.595 | |
| F150DB004 | 07:23:14.299 | 73:28:06.75 | 14.0/11.7 | 19.6 | 0.90.9,0.90.9 | 8.6,4.2 | 0.017,0.232 | |
| F150DB033 | 07:23:30.548 | 73:27:33.10 | 14.8/10.5 | 19.9 | 1.4,1.5 | 3.5,6.1 | 0.109,0.088 | |
| F150DB052 | 07:23:28.136 | 73:27:13.86 | 15.0/11.5 | 20.5 | 0.90.3,1.5 | 3.4,3.4 | 0.133,0.283 | |
| F150DB058 | 07:23:24.096 | 73:27:09.81 | 15.2/8.8 | 20.6 | 0.9,1.6 | 6.7,0.9 | 0.127,0.692 | |
| F200DA056 | 07:22:37.024 | 73:28:41.57 | 15.6/6.2 | 19.3 | 0.90.4,1.00.6 | 4.5,2.5 | 0.028,0.052 | |
∗ Same remarks apply to this table as Table 3
| ID | RA | DEC | Break [mag] | Lit | ||||
|---|---|---|---|---|---|---|---|---|
| Yan et al. (2023) | ||||||||
| F200DB109 | 07:23:37.033 | 73:27:12.22 | 15.8/7.2 | 19.2 | 0.31.6,0.20.9 | 1.0,2.9 | 0.397,0.188 | |
| F200DB181 | 07:23:12.615 | 73:26:31.71 | 15.8/14.5 | 20.5 | 0.9,1.1 | 1.9,2.7 | 0.790,0.290 | |
| F200DA061 | 07:22:31.695 | 73:28:38.65 | 15.8/16.6 | 19.6 | 1.41.2,1.10.9 | 2.1,0.5 | 0.431,0.589 | |
| F150DB041 | 07:23:06.626 | 73:27:25.43 | 16.0/11.6 | 20.0 | 1.1,1.8 | 0.6,3.2 | 0.546,0.214 | |
| F200DB159 | 07:23:25.344 | 73:26:46.02 | 16.0/13.2 | 19.3 | 1.1,1.5 | 2.2,0.7 | 0.512,0.782 | |
| F200DB175 | 07:23:11.086 | 73:26:38.01 | 16.2/12.8 | 19.9 | 1.6,1.6 | 2.2,1.8 | 0.387,0.345 | |
| F200DA040 | 07:23:03.926 | 73:29:06.14 | 20.0/9.2 | 19.5 | 0.7,0.70.6 | 0.8,1.1 | 0.532,0.691 | |
| F200DB045 | 07:23:22.766 | 73:27:39.69 | 20.4/14.2 | 20.3 | 1.41.1,1.3 | 0.4,0.2 | 0.527,0.518 | |
| F200DA006 | 07:22:40.349 | 73:30:10.33 | 20.6/9.2 | 19.6 | 0.60.3,0.9 | 1.0,1.9 | 0.336,0.419 | |
| This Work (Fiducial Sample) | ||||||||
| CEERSJ9345150450 | 14:19:34.513 | 52:50:45.08 | 9.2/9.2 | 19.5 | 1.51.0,1.00.4 | 10.5,2.0 | 0.997,0.424 | |
| CEERSJ9203050435 | 14:19:20.301 | 52:50:43.60 | 9.8/9.8 | 19.0 | 1.7,0.80.4 | 8.9,6.9 | 0.989,0.044 | |
| CEERSJ9149352106 | 14:19:14.931 | 52:52:10.66 | 10.0/10.0 | 19.5 | 1.82.1,1.10.5 | 4.7,2.7 | 0.956,0.286 | |
| CEERSJ9026550577 | 14:19:02.650 | 52:50:57.75 | 11.2/11.3 | 18.9 | 1.5,0.90.4 | 6.9,13.3 | 0.983,0.002 | |
| This Work (Alternate Sample) | ||||||||
| GLASSP1J4045920571 | 00:14:04.599 | 30:20:57.10 | 9.4/8.0 | 19.2 | 1.9,2.3 | 1.4,3.4 | 0.420,0.885 | |
| CEERSJ9320850526 | 14:19:32.076 | 52:50:52.65 | 9.6/8.1 | 19.4 | 1.21.2,2.3 | 1.8,3.4 | 0.387,0.930 | |
| CEERSH9220551139 | 14:19:22.049 | 52:51:13.94 | 13.5/12.2 | 19.5 | 1.5,1.9 | 2.5,4.9 | 0.237,0.971 | |
∗ Same remarks apply to this table as Table 3
Appendix C Median Stack of Candidates with Various Quality Flags
In evaluating the quality of candidates from the literature, we place the candidates in three different categories “robust,” “solid,” and “possible” depending on the relative likelihood we estimate for these sources to lie at or using our own photometry (see §3.3 for how these sets are defined).
In order to interpret each of these designations and determine if the differences are meaningful, we construct median stacks of flux in different passbands and for candidates in different categories. The results are presented in Table 16.
While the median stack results in the “robust” and “solid” categories show no significant flux blueward of the nominal spectral breaks in the candidates, the median stack in the “possible” category does show tentative 1-1.5 detections in each of bands blueward of the break. Additionally, the median stack results in the “robust” and “solid” category shows larger spectral breaks, i.e., 1.8 mag, than the median stack results in the “possible” category show, where the break only has an amplitude of 1-1.5 mag.
| Median Flux (nJy) | |||
| Band | “Robust” | “Solid” | “Possible” |
| z=8.5-11.5 | |||
| F435W+F475W | 1 | 0 | 1 |
| F606W+F775W+F814W | 0 | 0 | 2 |
| F090W | 1 | 0 | 6 |
| F115W | 6 | 2 | 5 |
| F125W+F140W | 10 | 5 | 12 |
| F160W | 22 | 25 | 20 |
| F150W | 22 | 28 | 29 |
| F200W | 21 | 34 | 32 |
| F277W | 23 | 31 | 35 |
| F356W | 27 | 32 | 36 |
| F444W | 53 | 38 | 33 |
| z=11.5-15.0 | |||
| F435W+F475W | 11 | 0 | 1 |
| F606W+F775W+F814W | 0 | 2 | 2 |
| F090W | 0 | 5 | 3 |
| F115W | 3 | 7 | 6 |
| F125W+F140W | 19 | 8 | 5 |
| F160W | 68 | 53 | 25 |
| F150W | 4 | 5 | 13 |
| F200W | 42 | 33 | 36 |
| F277W | 38 | 36 | 37 |
| F356W | 33 | 32 | 33 |
| F444W | 37 | 31 | 29 |
| z=15.0-20.0 | |||
| F435W+F475W | 11 | 0 | 1 |
| F606W+F775W+F814W | 0 | 2 | 2 |
| F090W | 0 | 5 | 3 |
| F115W | 3 | 7 | 6 |
| F125W+F140W | 19 | 8 | 5 |
| F160W | 68 | 53 | 25 |
| F150W | 4 | 5 | 13 |
| F200W | 42 | 33 | 36 |
| F277W | 38 | 36 | 37 |
| F356W | 33 | 32 | 33 |
| F444W | 37 | 31 | 29 |
Appendix D UV LF at
It is useful to test of our procedures for deriving the LF at high redshifts using JWST data to ensure we can arrive at reliable results.
To this end, we made use of our F090W-dropout samples and the same methodology as we use for our analyses to derive the LFs at . The results are presented in Figure 8 and in Tables 6-7, and it is clear that the results are consistent with what we derived earlier in Bouwens et al. (2021) on the basis of sensitive imaging observations with HST.
As such, we can conclude that our procedures should produce reliable LF results at , assuming we are able to identify significant samples at which are largely free of contamination from lower-redshift interlopers.
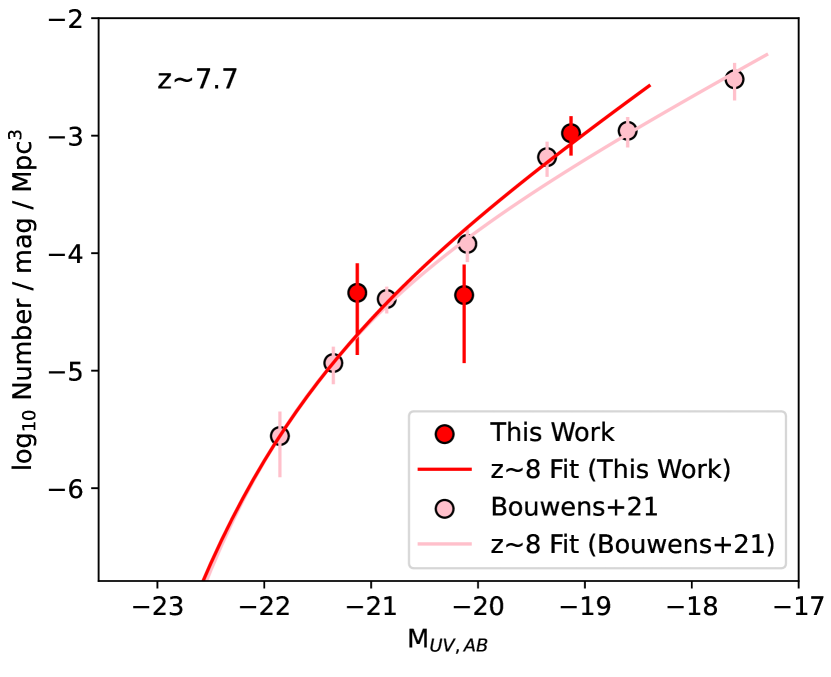
Appendix E Study-to-study Scatter in the Assessment of Various Candidates
Ascertaining whether individual candidates are at low or high-redshift can be challenging to answer in specific cases, due to uncertainties in both the photometry of individual sources and the optimal SED templates to utilize in performing the fits.
As an illustration of these uncertainties, Figure 9 shows a comparison of the results obtained using our photometry on the grizli reductions and those obtained using the pencil reductions. As a second illustration of the study-to-study differences, Figure 10 shows a comparison between the results Harikane et al. (2023) and the results we obtain using our grizli reductions.
In both comparisons, there is clearly a significant amount of scatter in the assessments that are made about specific candidates.