High-precision measurement of atmospheric mass-squared splitting with T2K and NOvA
Abstract
A precise measurement of the atmospheric mass-squared splitting is crucial to establish the three-flavor paradigm and to constrain the neutrino mass models. In addition, a precise value of will significantly enhance the hierarchy reach of future medium-baseline reactor experiments like JUNO and RENO-50. In this work, we explore the precision in that will be available after the full runs of T2K and NOA. We find that the combined data will be able to improve the precision in to sub-percent level for maximal 2-3 mixing. Depending on the true value of in the currently-allowed 3range, the precision in will vary from 0.87% to 1.24%. We further demonstrate that this is a robust measurement as it remains almost unaffected by the present uncertainties in , , the choice of mass hierarchy, and the systematic errors.
Keywords:
T2K, NOA, Precision, , Medium-baseline reactor experiments1 Introduction
Recent discovery of a moderately large value of An:2012eh ; An:2012bu ; An:2013zwz ; Ahn:2012nd has provided an edge for the present generation long-baseline superbeam experiments to explore the remaining fundamental unknowns like neutrino mass hierarchy (MH), octant of and the leptonic CP-violation. T2K Itow:2001ee ; Abe:2011ks and NOA Ayres:2002ws ; Ayres:2004js ; Ayres:2007tu ; Patterson:2012zs are the two current generation experiments that have potential to shed light on these remaining unknowns using the driven appearance channel Hagiwara:2006nn ; Huber:2009cw ; Agarwalla:2012bv ; Prakash:2012az ; Chatterjee:2013qus ; Blennow:2013swa ; Agarwalla:2013ju ; Choubey:2013xqa . Another important consequence of the large value of is that it has enabled the medium-baseline reactor oscillation (MBRO) experiments like JUNO Yifang:2012 and RENO-50 RENO-50 to resolve MH Petcov:2001sy ; Learned:2006wy ; Zhan:2008id ; Zhan:2009rs ; Qian:2012xh ; Ge:2012wj ; Li:2013zyd ; Kettell:2013eos ; Capozzi:2013psa . While it is important for T2K and NOA to address these pressing issues, it has been pointed out in deGouvea:2005hk ; Nunokawa:2005nx ; Qian:2012xh ; Li:2013zyd ; Kettell:2013eos that the sensitivity of MBRO experiments to MH can be significantly improved by a high-precision measurement of . T2K and NOA can do this measurement via the disappearance channel,
| (1) |
Here and are the effective two-flavor atmospheric mass-squared splitting and mixing angle, measured in muon neutrino disappearance oscillation experiments Nunokawa:2005nx ; deGouvea:2005hk 111For the experiments under consideration, (where ) and can be treated as a small perturbation in obtaining Eq. 2 and 3.,
| (2) | |||||
| (3) |
On the one hand, precision in can mitigate the challenge in the absolute energy scale uncertainty in MBRO experiments, thus enhancing their sensitivity to MH. On the other hand, comparison of the effective from muon-flavor oscillation experiments and the corresponding effective from electron-flavor oscillation experiments can provide additional MH information Nunokawa:2005nx ; deGouvea:2005hk ; Minakata:2007tn ; Zhang:2013rta . Recently, it has been demonstrated that a precision of 1% on can improve JUNO’s sensitivity to MH from to in a six-years run Li:2013zyd . Besides addressing the need of MBRO experiments, a precise measurement, along with a precision measurement of , is a crucial step towards validating the 3-flavor oscillation model Nunokawa:2005nx ; Zhang:2013rta . An accurate measurement will also severely constrain the neutrino mass models Albright:2006cw and itself a key input for neutrinoless double beta decay searches Pascoli:2005zb .
Currently the most precise information on comes from the MINOS experiment. A two-flavor analysis based on its complete run gives eV2 Adamson:2013whj , which corresponds to a relative 1 precision of 222We define the relative 1 error as 1/6th of the variations around the best-fit.. The latest disappearance analysis from T2K experiment based on its 3.86% of the total exposure, i.e. protons on target (p.o.t), gives eV2 Abe:2013fuq 333The T2K result adapts a three-flavor analysis and the quoted number assumes normal MH.. The current T2K precision is only . In this paper, we explore whether it is plausible to reach the 1% precision with the combined data from T2K and NOA. These two experiments will gather copious statistics from the muon disappearance channel, enabling a high-precision measurement of . In Sec. 2, we briefly mention the key experimental features of T2K and NOA and provide the simulation details adapted in this work. In Sec. 3, we discuss the precision in achievable by these two experiments and its dependence on various factors. Finally, we give our concluding remarks in Sec. 4.
2 Experimental specifications and simulation details
2.1 The T2K experiment
The Tokai to Kamioka (T2K) experiment is the first experiment to observe the three flavor effects in neutrino oscillations and its main objective is to measure by observing oscillations. Neutrinos are produced in the J-PARC accelerator facility in Tokai and are directed towards the 22.5 kton water Čerenkov Super-K detector placed in Kamioka, 295 km away at a off-axis angle Itow:2001ee . For muon charged-current quasi-elastic (CCQE) events, the energy resolution is . The beam peaks sharply at 0.6 GeV, which is very close to the 1st oscillation maximum of . The flux falls off rapidly, such that, there is hardly any at energies greater than 1 GeV. The experiment plans to run with a proton beam power of 750 kW with proton energy of 30 GeV for 5 years in mode only. This corresponds to a total exposure of protons on target (p.o.t). The neutrino flux is monitored by the near detectors, located 280 m away from the point of neutrino production. The background information and other details are taken from references fechnerthesis ; Huber:2009cw .
2.2 The NOA experiment
The NOA (NuMI444Neutrinos at the Main Injector. Off-axis Appearance) experiment Ayres:2007tu ; Patterson:2012zs ; Childress:2013npa uses FermiLab’s NuMI beamline and is scheduled to start taking data from late 2013. A 14 kton Totally Active Scintillator Detector (TASD) will be placed in Ash River, Minnesota which is 810 km away at an off-axis angle of 14 mrad (). This off-axis narrow-width beam peaks at 2 GeV. A 0.3 kton near detector will be located at the FermiLab site to monitor the un-oscillated neutrino or anti-neutrino flux. It aims to determine the unknowns such as MH, leptonic CP-violation, and the octant of by the measurement of oscillations. For the CCQE muon events, the energy resolution is . The experiment is scheduled to run for 3 years in mode followed by 3 years in mode with a NuMI beam power of MW and 120 GeV proton energy, corresponding to p.o.t per year.
2.3 Simulation details
We use GLoBES Huber:2004ka ; Huber:2007ji to carry out all the simulations in this work. The true values of neutrino oscillation parameters have been taken to be: eV2, GonzalezGarcia:2012sz ; NuFIT , eV2 Adamson:2013whj ; Nichol:2013caa , and An:2012eh ; Ahn:2012nd ; Abe:2011fz ; Abe:2012tg . is calculated based on and other values using Eq. 2 assuming different true MH and . The value of is calculated separately for normal hierarchy (NH where ) and for inverted hierarchy (IH where ) using this equation where is taken to be +ve for NH and -ve for IH. We have taken into account the present 3uncertainty of in the range 0.36 to 0.66 GonzalezGarcia:2012sz ; NuFIT both in simulated data and in fit. Note that, we perform a full three-flavor analysis in obtaining the results. We find that the true value of has little impact to the precision of . Therefore, in this work, has been assumed for all the results. The experimental features of T2K and re-optimized NOA are the same as considered in reference Agarwalla:2012bv . We consider the nominal set of systematics i.e. normalization error of 2.5% and 10% on signal and background respectively for both the experiments. We also consider the tilt error555Here “tilt” describes a linear distortion of the event spectrum. on signal and backgrounds to incorporate the energy-scale uncertainty. In this work, we consider 0.01% tilt error for NOA and 0.1% tilt error for T2K, for both signal and backgrounds. The impact of different assumptions on systematics has been studied further in Sec. 3.4.
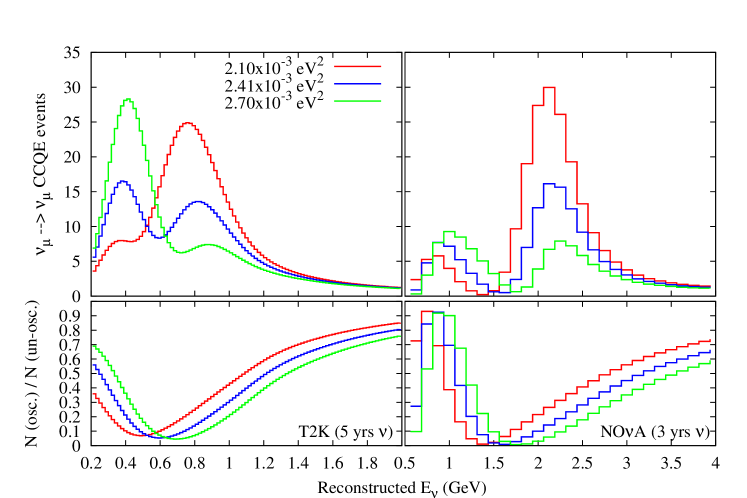
Fig. 1 shows the survival event spectra (CCQE muon events) for T2K and NOA for three different choices of . These three different choices correspond to the best-fit and the 3upper and lower bounds. The total events corresponding to eV2, eV2, and eV2 are 230, 153, and 114 respectively, with a three-years run in NOA. The corresponding numbers for T2K are 369, 300, and 318 with a five-years run. The upper left (right) panel shows the event spectrum for the experiment T2K (NOA). The ratio of oscillated to un-oscillated event spectrum are give in the lower panels. Fig. 1 shows that the first oscillation minima are clearly seen in both experiments due to their excellent energy resolution for CCQE muon events. This enables them to perform an accurate measurement of .
The precision of is calculated using the conventional least chi-squared method. To calculate the , the observed number of events are simulated using a particular choice of the true parameters. These are then contrasted with the events generated using another test set of oscillation parameters. This procedure is repeated for all the test values of oscillation parameters in their respective allowed intervals. We marginalize over test in its 2range, over test and over test in the 3range. We impose a Gaussian prior in with 5% uncertainty TheDayaBay:2013kda . The solar parameters are kept fixed; and so is the Earth matter density. GLoBES performs a binned-spectral analysis using a Poissonian definition of the . The relative 1 precision of is defined as
| (4) |
where is the present best-fit of . and are the two values of at which ; with being the larger of the two.
3 Study of the precision
In the following subsections, we study the effect of various important issues like contribution from appearance channel, the effect of uncertainty in and the effect of difference systematic uncertainties, on the precision of . Finally, we show how the precision of is going to improve with increasing statistics from these two experiments.
3.1 Effect of appearance and disappearance data
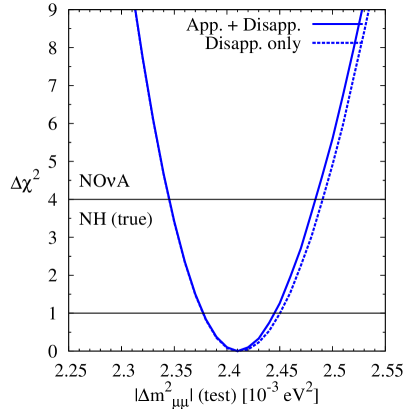
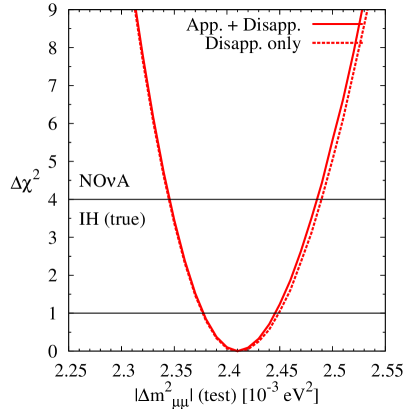
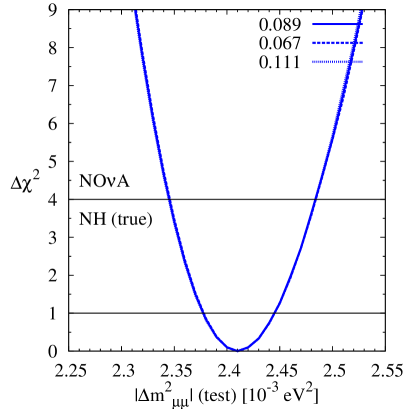
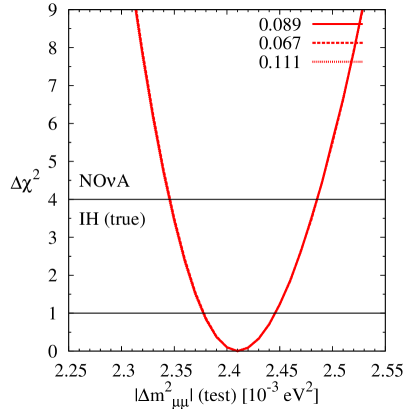
Fig. 2 shows the vs. test for the NOA experiment, assuming NH (IH) to be the true hierarchy in the left (right) panel, and . All test parameters have been marginalized over, except the solar parameters as we explained earlier. It can be seen from Fig. 2 that the precision is dominated by the disappearance data. The combined data of disappearance and appearance channels improves the precision by 0.04%, compared to disappearance alone. The contribution of appearance channel to the determination of is very small. For completeness, we still include both appearance and disappearance data in this work.
3.2 Precision of with T2K and NOA
In Fig. 3, we compare the precision of the two experiments T2K and NOA in measuring . The left (right) panel corresponds to NH (IH) being the true hierarchy. As before, we assume . We find that, after full runs, NOA will give , while T2K will give a more precise measurement . The reason is that T2K has more statistics.
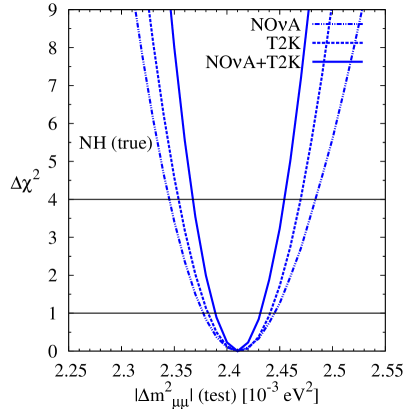
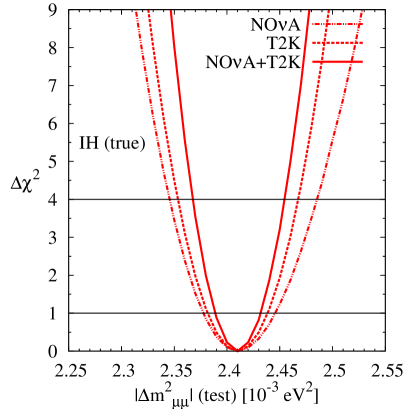
We next explore the potential of combined data. A precision of can be obtained after the full runs of these two experiments. Thus, if the 2-3 mixing is maximal, then a less than 1% accurate determination of can be achieved.
It can also be seen from the vs. test plots that the precision of is essentially independent of the hierarchy. Thus for simplicity, from here onwards, we show results only for NH assumed to be the true hierarchy.
3.3 Impact of 2-3 mixing angle on precision
Recent MINOS results hint at a non-maximal Adamson:2013whj . Global analysis GonzalezGarcia:2012sz ; NuFIT suggests two degenerate values of , one in the lower octant and the other in the higher octant. The leading term in the muon disappearance probability is dependent on as shown in Eq. 3. Thus, this parameter is expected to affect the precision in the measurement of directly. In this section, we study the dependence of precision on the true value of .
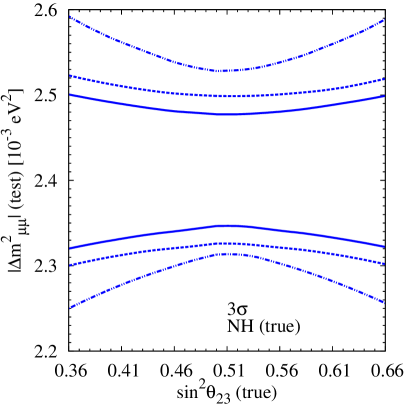
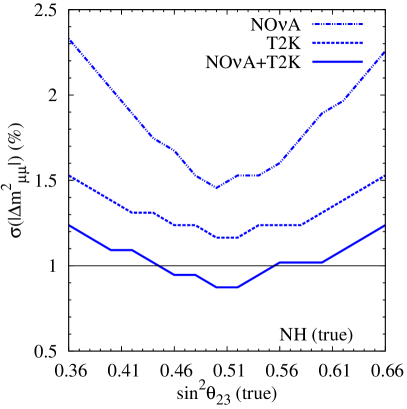
Fig. 4 shows the effect of on the determination of . The left panel shows the 3allowed regions in the - plane for the experiments T2K, NOA, and combined. The right panel depicts the corresponding relative 1 precision on . It can be seen that the best precision can be achieved for the maximal 2-3 mixing case and it deteriorates as the mixing deviates from maximal. With the combined data of T2K and NOA, a is achievable for . For the most conservative choice of at the 3 allowed limits, the precision deteriorates to . The results are more or less symmetrical around the maximal mixing.
3.4 Effect of systematic uncertainties
Here we study in detail the impact of the systematic uncertainties on the measurement of . For this purpose, we consider three different sets of assumptions on systematics. The default choice of systematics has been already mentioned in in Sec. 2.3. In the second set of systematic errors, we increase the normalization error to 10% and 20% for both signal and background, for both experiments, while keeping the tilt errors same as before. In the third set, we further increase the tilt error as well, to 10% for both signal and backgrounds, for both the experiments. The possible effect of these three set of systematics on precision is shown in table 1. It can be seen that systematics play a minor role in the measurement of .
| NOA | Signal norm. err : Signal tilt err | 2.5% : 0.01% | 10% : 0.01% | 10% : 10% |
|---|---|---|---|---|
| Bkg. norm. err : Bkg. tilt err | 10% : 0.01% | 20% : 0.01% | 20% : 10% | |
| T2K | Signal norm. err : Signal tilt err | 2.5% : 0.1% | 10% : 0.1% | 10% : 10% |
| Bkg. norm. err : Bkg. tilt err | 10% : 0.1% | 20% : 0.1% | 20% : 10% | |
| Relative precision | 0.87% | 0.94% | 0.95% | |
3.5 Evolution of precision with statistics
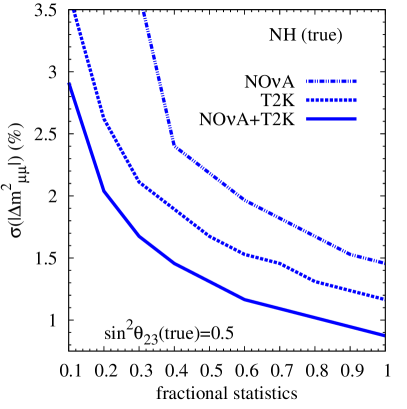
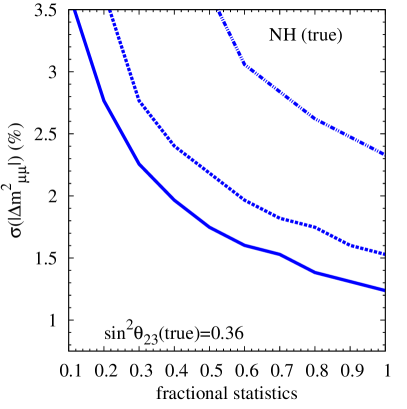
In Fig. 5, we study the improvement in the precision of as the statistics increases for T2K, NOA, and adding their data. The x-axis shows the fraction of the total statistics for these experiments. For NOA, we assume equal run time in neutrino and anti-neutrino modes at any given fractional statistics. Left and right panels present the results for the most optimistic (0.5) and the most pessimistic (0.36) values of respectively. For T2K, the precision improves from 3.5% to 1.16% as their statistics increases from 10% to 100% for the maximal mixing case. But, when we combine the data from T2K and NOA with equal fractional statistics, the precision improves from 2.9% to 0.87%. A precision of can be achieved if 80% of the total data from the two experiments is available for maximal mixing. For the pessimistic case (right panel), the precision on improves from 3.5% to 1.24% as the combined statistics increases from 10% to 100%.
We have checked that a precision of 0.75% is achievable with the combined data from T2K and NOA if their energy resolution can be improved by a factor of 2 assuming maximal 2-3 mixing. We also would like to point out that with the present energy resolution, the precision can be improved by simply increasing their statistics. A precision of 0.61% can be obtained if the statistics of these two experiments are doubled. It clearly suggests that this measurement is still statistically dominated for the present run-plans of T2K and NOA.
4 Summary and Conclusions
High-precision measurement of is crucial in validating the 3-flavor neutrino oscillation model. It also serves as a key input to the neutrino mass models and to the neutrinoless double beta decay searches. In addition, a sub-percent measurement of is mandatory for the MBRO experiments to obtain a reasonably good sensitivity to neutrino MH. In the foreseeable future, presently running T2K and upcoming NOA experiments can provide a more accurate measurement of beyond the current MINOS precision. In this paper, we have studied in detail the expected precision in that can be achieved after the complete runs of T2K and NOA experiments.
| True | T2K (5) | NOA (3 + 3) | T2K + NOA |
|---|---|---|---|
| 0.36 | 1.53% | 2.33% | 1.24% () |
| 0.50 | 1.16% | 1.45% | 0.87% () |
| 0.66 | 1.53% | 2.26% | 1.24% () |
It can be seen from Table 2 that T2K (NOA) can measure with a relative 1 precision of 1.45% (1.16%) assuming maximal 2-3 mixing. Combining the data from these two experiments, a sub-percent precision is achievable. It clearly demonstrates the possible synergy between these two experiments with different energy spectra and baselines. We have also studied the dependency of this measurement on the true value of . The precision in can vary in the range of 0.87% to 1.24% depending on the true value of in its currently-allowed 3region. As expected, for maximal 2-3 mixing, we have the best measurement of 0.87% (see Table 2). Any analysis assuming the full runs of these two long-baseline experiments can now assume a 1 prior of % on . In the last column, inside the parentheses, we also present the 3 allowed ranges of test () around its best-fit. This is a very robust measurement in the sense that it is quite immune to the present uncertainties in , , choice of hierarchy, and the systematic errors. This high-precision measurement of by the current generation experiments T2K and NOA will certainly provide a boost for the physics reach of MBRO experiments in addressing the neutrino mass hierarchy.
Acknowledgments
We would like to thank Jun Cao, Yu-Feng Li, Eligio Lisi, Panagiotis Stamoulis, and Yifang Wang for useful discussions. SKA acknowledges the support from DST/INSPIRE Research Grant [IFA-PH-12], Department of Science and Technology, India. SP acknowledges support from the Neutrino Project under the XII plan of Harish-Chandra Research Institute.
Appendix A Impact of 1-3 mixing angle on precision
The survival probability is independent of to the first order. Therefore, the precision measurement of should not be affected much by this parameter. This is indeed the case as shown in Fig. 6 where we have presented the precisions of for the best-fit as well as the 3upper and lower limits of true . The precision achieved by the experiment NOA is not affected by the uncertainty in . The same is true for T2K.
References
- (1) F. An et al. (Daya Bay), Phys.Rev.Lett. 108, 171803 (2012), 1203.1669.
- (2) F. An et al. (Daya Bay), Chin. Phys. C37, 011001 (2013), 1210.6327.
- (3) F. An et al. (Daya Bay Collaboration) (2013), 1310.6732.
- (4) J. Ahn et al. (RENO), Phys.Rev.Lett. 108, 191802 (2012), 1204.0626.
- (5) Y. Itow et al. (T2K Collaboration) pp. 239–248 (2001), hep-ex/0106019.
- (6) K. Abe et al. (T2K Collaboration), Nucl.Instrum.Meth. A659, 106 (2011), 1106.1238.
- (7) D. Ayres, G. Drake, M. Goodman, V. Guarino, T. Joffe-Minor, et al. (2002), hep-ex/0210005.
- (8) D. Ayres et al. (NOvA Collaboration) (2004), updated version of 2004 proposal. Higher resolution version available at Fermilab Library Server, hep-ex/0503053.
- (9) D. Ayres et al. (NOvA Collaboration) (2007).
- (10) R. Patterson (NOvA Collaboration), Nucl.Phys.Proc.Suppl. 235-236, 151 (2013), 1209.0716.
- (11) K. Hagiwara and N. Okamura, JHEP 0801, 022 (2008), hep-ph/0611058.
- (12) P. Huber, M. Lindner, T. Schwetz, and W. Winter, JHEP 0911, 044 (2009), 0907.1896.
- (13) S. K. Agarwalla, S. Prakash, S. K. Raut, and S. U. Sankar, JHEP 1212, 075 (2012), 1208.3644.
- (14) S. Prakash, S. K. Raut, and S. U. Sankar, Phys.Rev. D86, 033012 (2012), 1201.6485.
- (15) A. Chatterjee, P. Ghoshal, S. Goswami, and S. K. Raut, JHEP 1306, 010 (2013), 1302.1370.
- (16) M. Blennow, P. Coloma, A. Donini, and E. Fernandez-Martinez, JHEP 1307, 159 (2013), 1303.0003.
- (17) S. K. Agarwalla, S. Prakash, and S. U. Sankar, JHEP 1307, 131 (2013), 1301.2574.
- (18) S. Choubey and A. Ghosh (2013), 1309.5760.
- (19) Y. Wang, in NuFACT 2012 (2012).
- (20) RENO-50 collaboration (RENO-50), in International Workshop on RENO-50 toward Neutrino Mass Hierarchy (2013), URL http://home.kias.re.kr/MKG/h/reno50/.
- (21) S. Petcov and M. Piai, Phys.Lett. B533, 94 (2002), hep-ph/0112074.
- (22) J. Learned, S. T. Dye, S. Pakvasa, and R. C. Svoboda, Phys.Rev. D78, 071302 (2008), hep-ex/0612022.
- (23) L. Zhan, Y. Wang, J. Cao, and L. Wen, Phys.Rev. D78, 111103 (2008), 0807.3203.
- (24) L. Zhan, Y. Wang, J. Cao, and L. Wen, Phys.Rev. D79, 073007 (2009), 0901.2976.
- (25) X. Qian, D. Dwyer, R. McKeown, P. Vogel, W. Wang, et al., PRD, 87, 033005 (2013), 1208.1551.
- (26) S.-F. Ge, K. Hagiwara, N. Okamura, and Y. Takaesu, JHEP 1305, 131 (2013), 1210.8141.
- (27) Y.-F. Li, J. Cao, Y. Wang, and L. Zhan (2013), 1303.6733.
- (28) S. Kettell, J. Ling, X. Qian, M. Yeh, C. Zhang, et al. (2013), 1307.7419.
- (29) F. Capozzi, E. Lisi, and A. Marrone (2013), 1309.1638.
- (30) A. de Gouvea, J. Jenkins, and B. Kayser, Phys.Rev. D71, 113009 (2005), hep-ph/0503079.
- (31) H. Nunokawa, S. J. Parke, and R. Zukanovich Funchal, Phys.Rev. D72, 013009 (2005), hep-ph/0503283.
- (32) H. Minakata, H. Nunokawa, S. J. Parke, and R. Zukanovich Funchal, Phys.Rev. D76, 053004 (2007), hep-ph/0701151.
- (33) Y. Zhang and B.-Q. Ma (2013), 1310.4443.
- (34) C. H. Albright and M.-C. Chen, Phys.Rev. D74, 113006 (2006), hep-ph/0608137.
- (35) S. Pascoli, S. Petcov, and T. Schwetz, Nucl.Phys. B734, 24 (2006), hep-ph/0505226.
- (36) P. Adamson et al. (MINOS Collaboration), Phys. Rev. Lett. 110, 251801 (2013), %****␣delta31precision_Dec5.bbl␣Line␣250␣****1304.6335.
- (37) K. Abe et al. (T2K Collaboration) (2013), 1308.0465.
- (38) M. Fechner (2006), Ph.D dissertation presented on May 9, 2006.
- (39) S. Childress and J. Strait (NuMI, NOvA and LBNE Collaborations) (2013), 1304.4899.
- (40) P. Huber, M. Lindner, and W. Winter, Comput.Phys.Commun. 167, 195 (2005), hep-ph/0407333.
- (41) P. Huber, J. Kopp, M. Lindner, M. Rolinec, and W. Winter, Comput.Phys.Commun. 177, 432 (2007), hep-ph/0701187.
- (42) M. Gonzalez-Garcia, M. Maltoni, J. Salvado, and T. Schwetz, JHEP 1212, 123 (2012), 1209.3023.
- (43) NuFIT working group (2013), NuFIT webpage, URL http://www.nu-fit.org/.
- (44) R. Nichol (MINOS Collaboration), Nucl.Phys.Proc.Suppl. 235-236, 105 (2013).
- (45) Y. Abe et al. (Double Chooz), Phys.Rev.Lett. 108, 131801 (2012), 1112.6353.
- (46) Y. Abe et al. (Double Chooz), Phys.Rev. D86, 052008 (2012), 1207.6632.
- (47) Daya Bay Collaboration (Daya Bay Collaboration) (2013), 1309.7961.