Determining the Octant of with PINGU, T2K, NOA and Reactor Data
Abstract
We explore the prospects of determining the octant of with atmospheric neutrinos at PINGU. We study in detail the impact of energy and angle resolutions of the neutrino on the octant sensitivity. We show that the systematic uncertainties on the atmospheric neutrino flux predictions, especially the ones which affect the energy and zenith angle spectrum of the neutrinos, make a rather drastic reduction of the sensitivity of PINGU. We also study the prospects of measuring the octant of in the long baseline experiments T2K and NOA in conjunction with the reactor experiments. We study this for two configurations of NOA and T2K and make a comparative analysis of them. From just 3 years of PINGU data, the octant could be determined at more than C.L. for and if we add the reactor data and if normal hierarchy is true. On addition of the data from T2K and NOA, the sensitivity improves so that the octant could be determined at the C.L. for and if normal hierarchy is true. Even a significance for the right octant can be achieved if for the true normal hierarchy. The sensitivity for the true inverted hierarchy is lower and we expect a determination of for and from the combined data set for this case.
1 Introduction
PINGU [1] (Precision IceCube Next Generation Upgrade)
has been proposed as a low energy extension of the
already existing and successfully running IceCube
detector [2]. While the energy threshold of the full IceCube detector is 100 GeV,
PINGU is envisioned to have an energy threshold of
a few GeV, thereby allowing it to function as a
low energy
atmospheric neutrino experiment, with an effective fiducial mass in the multi-megaton range.
The plan is to increase the number of strings, increasing the optical module density, and hence
increasing the photo-coverage of the region. This will reduce the energy threshold for the
detection of the muons. The number of optical modules have already been
increased for the existing IceCube Deep Core (ICDC) area of the detector which
has an energy threshold of 10 GeV and which has already released its first data
on atmospheric neutrinos with energies greater than 10 GeV [3].
The ICDC has 8 extra strings in addition to the 7
strings belonging to the original IceCube design, providing a string spacing of
about 75m.
The plan is to increase the string density by putting
20 to 40 additional strings.
The 20 string option would allow for 26m spacing between strings.
The 40 string option will obviously have a larger
effective area compared to the 20 string option and possibly a lower energy threshold, and
hence will give better results.
The large fiducial mass gives PINGU an edge over other competitive experiments.
The potential of measuring the neutrino mass hierarchy at PINGU has been studied by
quite a few groups [4, 5, 7, 6, 8, 9, 10].
Amongst the other issues in neutrino physics that remain to be probed, is the
determination of the octant of mixing angle, in case it is found to be
different from maximal. Various ways have been suggested in the literature to
determine the in the current and next generation neutrino oscillation
experiments. One easy way is to combine the data from reactor experiments
with the -appearance data from conventional accelerator experiments
[11, 12, 13].
The reactor experiments return a pure measurement of the mixing angle
, while the -appearance data from conventional
accelerator experiments measure the combination , at leading order.
Using this combined analysis, one could then extract information on the .
Another approach studied in the literature has been to combine the
-appearance channel in long baseline experiments with the -disappearance
channel [14, 15].
The upshot of this reasoning is that the best-fit preferred by the
appearance channel is different from the best-fit favored
by the disappearance channel. This generates a synergy between the
two data sets in the long baseline experiment, leading to an octant
sensitivity.
The third way is to use dependent
terms in the oscillation probability, which depend on either
or , leading to octant sensitivity. This was shown
in the context of sub-GeV -events from atmospheric neutrinos at
a water Cerenkov experiment like Super-Kamiokande [16]
where the driven oscillatory terms bring in an dependence in the
low energy electron event sample.
Finally, one can use the dependence in the earth matter effects
in the channel to get a measure on this parameter [17].
Determining the through observation of earth matter effects in
channel has been studied for atmospheric neutrino
experiments with magnetized iron detectors
[17, 18, 19], water Cerenkov detectors [20]
and liquid argon detectors [15, 21, 22].
In this paper, we mainly focus at the prospects of determining the through
observation of earth matter effects in megaton-class Cerenkov detectors. In particular,
we will work with the PINGU set-up, though our results are also valid for ORCA
(Oscillation Research with Cosmics in the Abyss) [23],
with
suitable adjustments for the detector specifications like effective volume,
reconstruction efficiency and energy and angle resolutions. The physics potential
of PINGU has been studied in [4, 5, 7, 6, 8, 9, 10].
In particular, the issue of determining the octant of was briefly discussed in
[5]. Here, we will present detailed analysis of the reach of the PINGU
experiment towards the determination of the , taking into account the
detector specifications provided by the PINGU collaboration, as well as after including
full systematic uncertainties on the atmospheric neutrino fluxes. We will show in detail how the
projected reach of PINGU changes with the energy and angle resolution, as well as
with the inclusion of the systematic uncertainties in the analysis. We will also study how
the sensitivity to determination of the at PINGU goes down when one marginalizes over
the oscillation parameters , , and the neutrino mass hierarchy. 111Note that the
sensitivity to the at PINGU is almost insensitive to the value of and so we
take in the simulated data for PINGU throughout this paper. For
results that use only the PINGU data, we keep
fixed in the fit as well.
In this paper we will denote the true values of the oscillation parameters
by putting ‘true’ within brackets.
Since the Daya Bay, RENO,
Double Chooz and T2K experiments are already operational and since
NOA will also start operations soon, it is expected that we will have full or at least
partial data from these experiments by the time we have enough data collected at
PINGU. In addition, sizable octant sensitivity is expected from the combined results from
T2K, NOA and the reactor experiments as discussed above. Therefore, we will
use the projected data from these experiments
to give
the sensitivity to the from
these experiments combined with PINGU.
The combination of the data from the long baseline and reactor experiments to the PINGU data
serves four purposes.
Firstly, we can compare and contrast the prospects of
determining the at PINGU versus the prospects
expected from the current accelerator and reactor experiments.
Secondly, a combined analysis of PINGU with the accelerator and reactor experiments
shows possible synergies between the different experiments. Thirdly and most importantly, the
accelerator and reactor experiments
severely constrain the oscillation parameters , and
.
This reduces the effect of
marginalization in PINGU, thereby increasing the .
Finally, the net sensitivity to the will anyway be given by a global analysis
of all available
neutrino oscillation data after a few years of running of PINGU, and
our aim in this paper is to show this.
A discussion on the role of in the analysis of the data from long baseline experiment is in order.
The sensitivity of the LBL experiments to the
depends on the true value of the CP phase, .
This was studied in detail in [14, 15]
where the octant sensitivity of
the combined NOA and T2K data was shown as a function of the .
In particular, in [14], the authors showed the degeneracy between
and , and since the value of is completely unknown, the
sensitivity from long baseline experiments suffers. They showed that
running T2K in the antineutrino mode alleviates this
degeneracy issues. In particular, they compared results of
5 years of neutrino running alone in T2K [24], against those obtained with 2.5 years in neutrino
and 2.5 years in the antineutrino mode, and argued that the 2.5+2.5 years
option for T2K was better. This issue was also recently pointed out and studied
in [25].
We will also show our results for both possibilities for T2K.
The NOA experiment has recently re-optimized [26] their event selection
criteria, following the discovery of large [27, 28, 29, 30, 31].
We have used this new NOA configuration following [32] and
have compared the results using the new NOA configuration versus the
old NOA configuration [33]. For both NOA configurations we use
3+3 years of running of the experiment in the neutrino+antineutrino mode.
A final comment is in order.
The recent studies on the sensitivity from long baseline experiments
[14, 15],
imposed a prior on the value of in the fit and showed that the
octant sensitivity of the long baseline experiments depends crucially on that. In
this work we add the projected reactor data from the full 3 years run of
Daya Bay [34], RENO [35] and Double Chooz [36].
The paper is organized as follows. We start in section 2 with a description of the atmospheric neutrino events in PINGU and our method of the analysis of the simulated data in PINGU. In section 3 we present the octant sensitivity from PINGU alone, allowing for full marginalization of the oscillation parameters. We discuss in detail the impact of detector resolutions, systematic uncertainties and uncertainties in oscillation parameters on the final octant sensitivity at PINGU. In section 4 we begin with a discussion of the octant sensitivity of T2K+NOA+Reactor experiments. We compare and contrast the reach of old NO versus new NOA configuration. We also make a comparative study of the octant sensitivity with 5 years of T2K running in the neutrino mode alone vis-a-vis 2.5 years of T2K running in neutrino and remaining 2.5 years of T2K running in the antineutrino mode. Finally, we show the sensitivity coming from combined fits of the PINGU data along with the projected runs of the T2K+NOA+Reactor experiments. We end in section 5 with our conclusions.
2 Atmospheric Neutrinos in PINGU
The number of atmospheric muon events expected in PINGU after years of running of the experiment is given as
| (1) | |||||
where are the number of targets in the detector, is the exposure time, is the detector efficiency, is the effective mass of the detector, is the effective volume, is the neutrino flux of flavor [37], is the neutrino-nucleon interaction cross-section, and are the energy and angle resolution functions of the detector respectively, and and are the muon neutrino survival probability and electron neutrino to muon neutrino conversion probabilities, respectively. The resolution functions relate the true energy and zenith angle with the reconstructed energy and zenith angle , of the neutrino. We assume Gaussian functional form for the resolutions functions with widths
| (2) |
Since the final resolution widths for PINGU is still being estimated from detailed simulations, we will assume two sets of values for the energy resolution width corresponding to and , and two sets of values for the angle resolution width corresponding to and , where (and hence ) is in radians. These values for the resolution functions agree with that used in the literature [4, 8, 9]. The effective mass of the detector is read from [38] for the curve labelled “Triggered Effective Volume, R=100m”. The probabilities and are calculated numerically solving the propagation equation of the neutrinos through the atmosphere and inside the earth, and using the PREM profile [39] for the earth matter density. For simplicity we take , since any flat can be easily adjusted against the exposure taken at the detector. The index in Eq. (1) runs over the number of bins in the data while runs over the number of energy bins. In the analysis presented in this paper, we have taken 10 equal zenith angle bins in between and , and 7 equal energy bins between and GeV. The data is generated for the oscillation parameters given in Table 1 for either the normal or inverted hierarchy and for a given value of . Note that we use as our definition of the normal mass hierarchy and as inverted mass hierarchy, where
| (3) |
The simulated data is then fitted with the wrong octant solution of , allowing the test , , as well as the neutrino mass hierarchy to vary in the fit. The statistical fit is performed using a function defined as
| (4) |
| (5) |
where is the observed number of muon events in the and energy bin and is the corresponding theoretically predicted event spectrum for the wrong octant solution of . The in Eq. (5) is the systematic uncertainty in the and energy bin and is the pull variable corresponding to the uncertainty . We have included five systematic uncertainties in our analysis. They are, an overall flux normalization error of 20%, a cross-section uncertainty of 10%, a 5% uncertainty on the zenith angle dependence of the fluxes, an energy dependent “tilt factor”, and a 5% additional overall uncertainty. The parameters and are varied freely in the fit in the range given in Table 1. For , we marginalize around around the wrong octant for any given (true). Finally, the is computed for both the test hierarchies and the minimum chosen.
| Parameter | True value used in data | range used in fit |
|---|---|---|
| eV2 | eV2 | |
| 0.3 | ||
| eV2 | eV2 | |
| 0 | ||
| 0.1 |
3 Octant Sensitivity from PINGU Alone
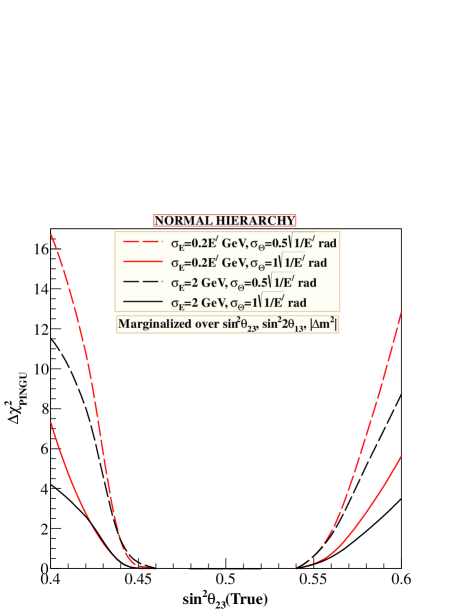
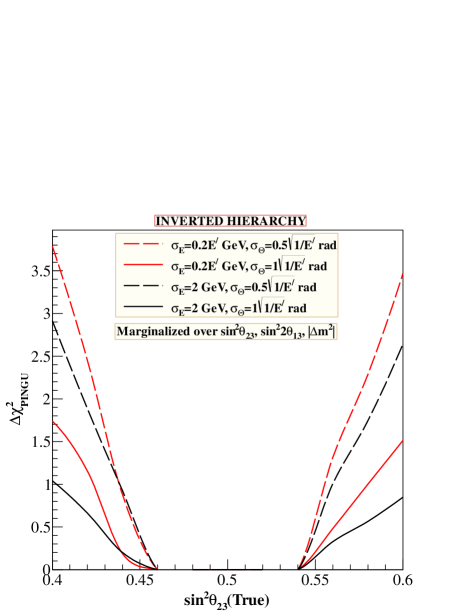
The results of our statistical analysis and the sensitivity of PINGU alone to the octant of
is given in Fig. 1, where we have shown the
as a function of . We have used 3 years of running of the experiment
with the effective mass of the detector read
from [38] for the curve labelled “Triggered Effective Volume, R=100m”.
The left panels of this figure give the octant sensitivity when the data is generated assuming
the normal hierarchy (), while the right panels are obtained when the data is
generated assuming the inverted mass hierarchy (). We have included the
full flux systematic uncertainties as outlined in the previous section. The top panels are
obtained when
the is marginalized over the oscillation parameters, , and
as described in the previous section, however, the test mass hierarchy is kept fixed at the
assumed true value. The bottom panels are obtained when in addition to , and
, the is marginalized also with respect to the mass hierarchy.
The four lines are for the four possible combinations for
the energy and angle resolutions of PINGU. The red dashed lines are for our
optimal choice of and , as
discussed in section 2.
This figure shows the impact of a variety of things on the octant sensitivity at PINGU.
Let us start by looking at the impact of the resolution functions on the octant sensitivity.
From the top left panel, we find that if the normal hierarchy was true and the test hierarchy
was kept fixed as normal, then
the wrong octant could be ruled out at more than C.L. 222Where
the number of is defined as .
if and if
and .
To show the impact of the resolution functions on the
octant sensitivity, we have repeated the exercise for different combinations of and
. Keeping and changing from
to GeV reduces the statistical significance of the octant measurement
and now we expect sensitivity for and .
The impact of worsening of the zenith angle sensitivity is seen to be sharper.
Keeping if we change to
, this
reduces the statistical significance of the octant measurement significantly
and now we have only sensitivity for and .
For the case where both energy resolution and angle resolutions are
worsened to GeV and , we find that
the wrong octant can be ruled out only at for and .
The right panels of Fig. 1 show the sensitivity of PINGU alone to the if the inverted hierarchy was true. We find that for the inverted hierarchy the sensitivity falls significantly, and even for , the wrong hierarchy would be barely ruled at the C.L.. The sharp difference between the reach of the experiment to the between the normal and inverted hierarchy can be understood as follows. Let us say that we generate the data at a certain value of and fit the data for for . Since the main sensitivity of PINGU to the comes from earth matter effects, for normal hierarchy the difference between number of events for and is expected to be non-zero for the neutrino events and nearly zero for the antineutrino events. In that case, since PINGU cannot distinguish between the particle and antiparticle, the obtained for normal hierarchy can be very roughly written as
| (6) |
where for simplicity, we have neglected the systematic uncertainties and have assumed the test hierarchy to be fixed. The same argument holds in the general case. In Eq. 6 we have taken , since for normal hierarchy there are almost no earth matter effects in the antineutrino channel. On the other hand for the inverted hierarchy the corresponding is approximately given as
| (7) |
since in the case of the inverted hierarchy the difference between the number of events , as for this case there are almost no earth matter effects in the neutrino channel. We can very approximately write
| (8) |
where and are the number of -events and -events in absence of oscillations and
| (9) |
For the inverted hierarchy case we have
| (10) |
where and are the number of -events and -events in absence of oscillations and and are given by
| (11) |
Since
| (12) |
and
| (13) |
| (14) |
Since the number of neutrino () events are more than twice the number of antineutrino () events, and since due to earth matter effects for any value of ,
| (15) |
and from Eq. (14) we see that we expect
| (16) |
This rough comparison between the expected octant sensitivity between normal and inverted
mass hierarchy cases is seen to agree rather well with the results shown in
Fig. 1, which have been obtained from a detailed numerical computation.
Finally, a comparison of the upper panels with the lower panels of Fig. 1
shows the impact of marginalization over the test mass hierarchy in the fit.
Let us first discuss the case where the data is generated for true inverted hierarchy.
For the true inverted hierarchy case we can see from the figure that marginalization
over the test mass hierarchy in the fit has no impact on the octant sensitivity of
the experiment.
However,
for true normal hierarchy there is significant reduction in the for
low values of . In particular, we can see that for the statistical
significance of the octant determination from 3 years of PINGU data alone,
comes down from to for the optimal
resolution case of and .
For the other choices of the combination for
and also we see a similar trend, wherein the data with
true normal hierarchy is fitted with the wrong test inverted hierarchy and with a lower
, reducing thereby the octant sensitivity from PINGU alone.
However, for the marginalization over hierarchy does not have any
impact what-so-ever on the octant sensitivity of PINGU, even for the case of
true normal hierarchy.
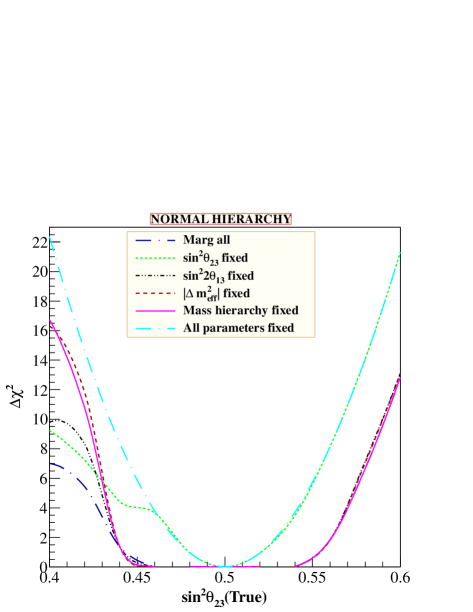
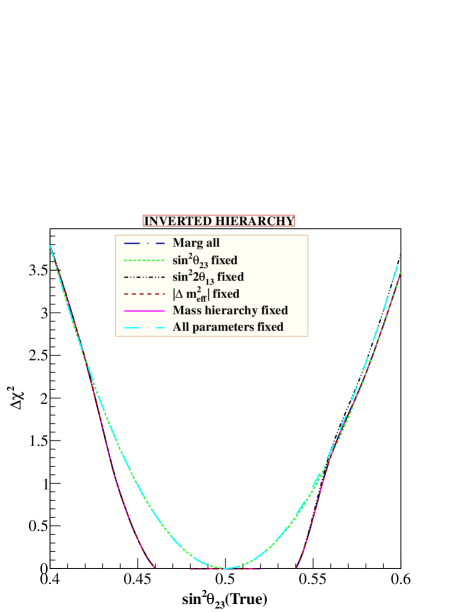
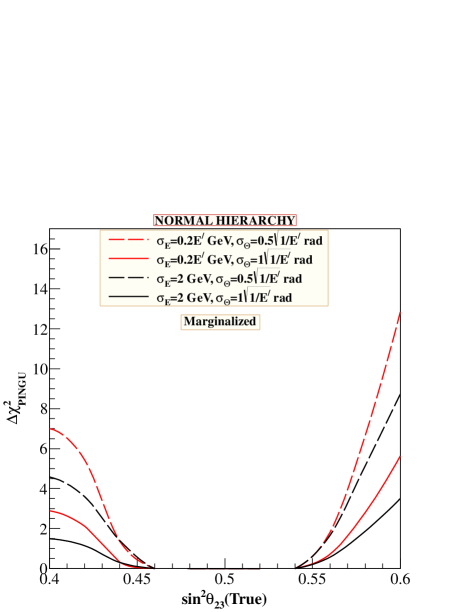
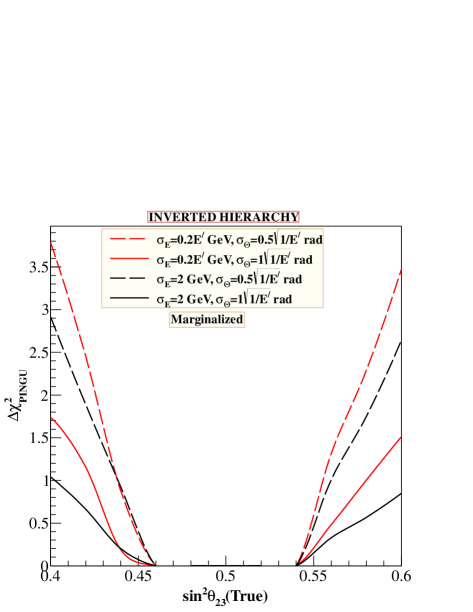
Note from Fig. 1 that the is large for significantly
far from maximal mixing. However, the statistical significance falls very fast and
nearly disappears for and . The main reason for this
flat between these two limiting regions of is the marginalization
over the mixing angle in the fit. We show the effect of marginalization on the
sensitivity in Fig. 2. We have shown this figure for
and .
The left-hand panel of this figure is for true normal hierarchy while the right-hand
panel is for true inverted hierarchy case.
The blue long dot-dashed
lines in the two panels of this figure
are the same as the red dashed line in the bottom panels of Fig. 1,
where the is
marginalized over all oscillation parameters in the range given in Table 1, as well
as over the test neutrino mass hierarchy.
The cyan long dot-dashed solid lines are
obtained when all oscillation parameters are taken fixed in the fit. We find that
in that case the sensitivity shows a remarkable improvement, especially for the
true normal hierarchy case. For the jumps from
about 7 for the fully marginalized case to more than 22 for the all parameter fixed
case. For the true inverted hierarchy case, the difference between the fully marginalized
line and the all parameters fixed line is less dramatic, with the difference coming only
for values of close to maximal mixing.
The other lines in this figure have been
drawn by keeping only one oscillation parameter fixed at a time, leaving the others to vary.
For the true inverted hierarchy case,
maximum difference to the plots, qualitatively as well as quantitatively,
comes on fixing in the fit, which is shown by the green dashed lines.
Fixing of this parameter increases the
octant sensitivity considerably in terms of the range of for which
the wrong octant solution can be disfavored,
and we get a sensitivity which is very close to what
we would have obtained if all oscillation parameters were fixed.
In particular, the now has a softer fall as
we approach maximal mixing angle. For the true inverted hierarchy
case, the right-hand panel reveals that fixing any of the other
oscillation parameter or the neutrino mass hierarchy makes no
impact on the .
For the true normal hierarchy case,
the effect of fixing one parameter at a time is seen to have a much
richer behavior, especially for low . This is because the
effect of marginalization over the oscillation parameters as well the
mass hierarchy is much larger for the true normal hierarchy case.
In particular, for low values of , we find that
fixing the neutrino mass hierarchy (pink solid line) causes a significant increase
in the , as we had seen before in Fig. 1.
Fixing (red short dashed line) is also seen to give a similar change to the
. The reason for this is as follows. When we let the test
hierarchy vary in the fit, the wrong inverted hierarchy is preferred by pushing
the fit value of to its current allowed upper limit as given in Table 1,
and by suitably adjusting the fit . When we fix , then this freedom
is lost, and in that case even if we allow the test hierarchy to vary, the minima
still comes for the test normal hierarchy. Therefore, the fixed case looks
very similar to the fixed hierarchy case. The other parameter which has a
significant impact for low values of is . The black dot-dashed lines
show that the increases when is fixed at its true
value in the fit. This point is worth noting. The reason is that constraint on
is expected to significantly improve with more data from the reactor
experiments, particularly Daya Bay, as well as T2K and NOA. In the next
section when we will add the reactor data to the PINGU data we will find a
sensitivity curve very close to the one shown in this figure for fixed .
Finally, as in the case of the true inverted hierarchy, fixing in the
fit brings a large effect on the octant sensitivity of PINGU. In fact, for the high
octant region of the curve, we see that only the parameter
plays a role in the marginalization process.
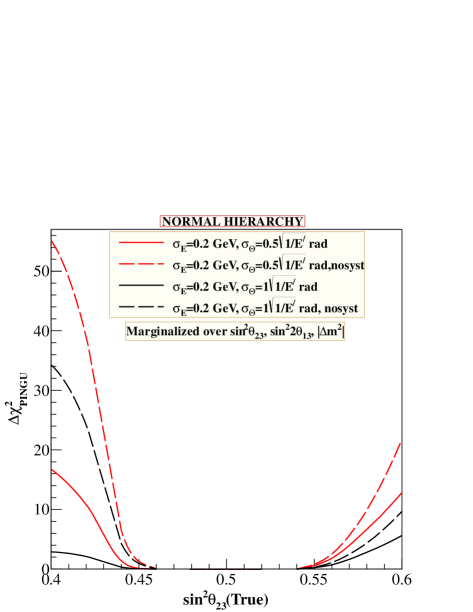
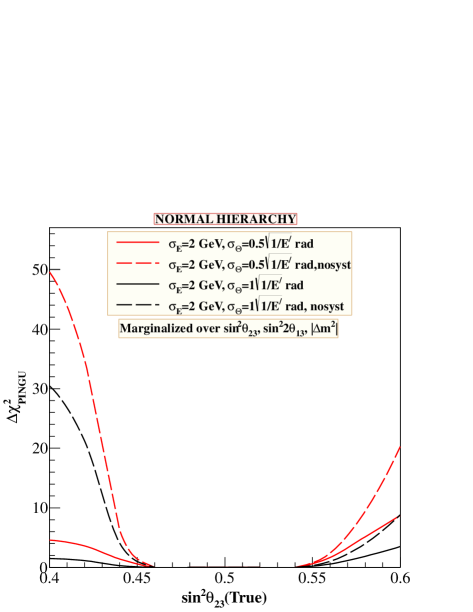
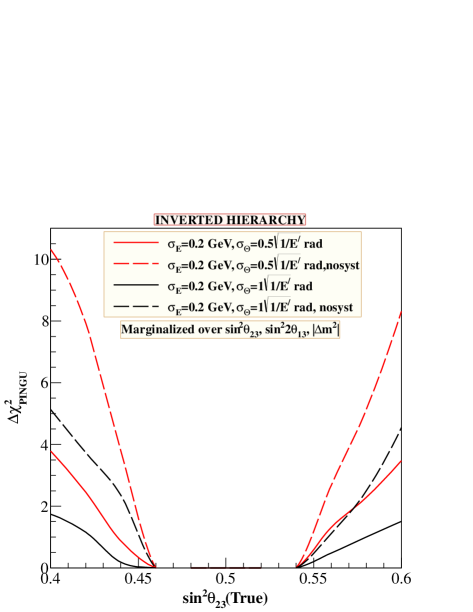
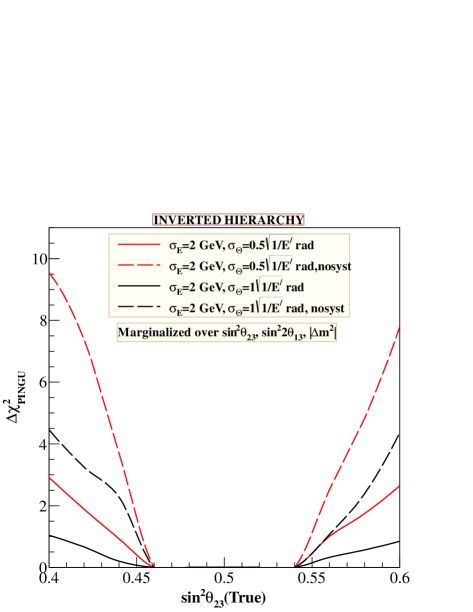
In order to show the impact of the systematic uncertainties on the sensitivity at PINGU, we plot in Fig. 3 the as a function of , with (solid lines) and without (dashed lines) systematic uncertainties. For simplicity we show the plot for the case where the mass hierarchy is kept fixed at the true value in the fit. The widths of the resolution functions assumed for each case is shown in the figure legend. The upper panels in this figure are for the normal hierarchy case while the lower panels show the result for the true inverted hierarchy. We can see that for the normal hierarchy case, systematic uncertainties reduce the by a factor of about 3.5 when GeV (upper left-hand panel) and for both and . For the worse energy resolution case of GeV (upper right-hand panel) the systematic uncertainties reduce the by a factor of about 4.2 for and by a factor of about 7.5 for . Notice that the impact of the systematic uncertainty increases as the energy and angle resolution of the detector deteriorates. For the inverted hierarchy case too, we can see a big reduction in the sensitivity due to the systematic uncertainties and the trend with the resolution functions is the same. Amongst the 5 systematic uncertainties that we have included in our analysis, the ones which bring about the most impact are the theoretical uncertainties in the atmospheric neutrino fluxes coming from the uncertainty in the energy spectrum (called ”tilt error” above) and from the uncertainty in the zenith angle. The uncertainties do not cancel between different bins and brings about a rather drastic decline in the sensitivity of PINGU to the .
4 Octant Sensitivity of PINGU Combined with Others Experiments
Sizable octant sensitivity is expected from the current accelerator and reactor experiments.
In the light of large , the reach of the combined data from T2K and
NOA towards the discovery of the
true octant of has been studied before in [11, 12, 13]
and more recently in [14, 15].
The configuration for NOA given in the earlier NOA DPR and used in [13]
was revised last year following the discovery of the relatively large .
The details of the modified configuration for NOA can be found in [26]
and was used in [32] to show the significant improvement expected in the
mass hierarchy sensitivity of NOA. This revised configuration was used
in the context of sensitivity from current long baseline experiments in
[14].
In [14], the authors also studied the impact of running T2K for 2.5 years in the
neutrino and 2.5 years in the antineutrino mode, on the sensitivity.
The T2K experiment is officially scheduled to run only in the neutrino mode for 5 years.
However, efforts are on to determine optimized exposure times for T2K in
neutrino mode vis-o-vis antineutrino mode. On the other hand,
the reactor experiments Daya Bay, RENO and Double Chooz, are expected to
tighten the constraint on , which as we had seen in the previous
section, makes a significant difference to the octant sensitivity of PINGU.
Accurate measurement of at the reactor experiments is also
known to be crucial for the octant determination using the T2K and NOA experiments.
In this section we will include the full 3 years run of each of the reactor experiments,
Daya Bay, RENO and Double Chooz, and combine this with long baseline data
from T2K and NOA. For NOA we consider 3 years of neutrino and 3 years of
antineutrino run and compare results between the old and
the revised configurations of this experiment, while for T2K we will show octant
sensitivity plots for both 5 years running in only the neutrino mode and 2.5 years in
neutrino and 2.5 years in the antineutrino mode.
Simulations of the event rates and for the long baseline and reactor
experiments have been performed using the GLoBES software [40].
Finally, we will combine the
reactor and long baseline data with 3 years of PINGU data and present the
sensitivity expected from the global data set.
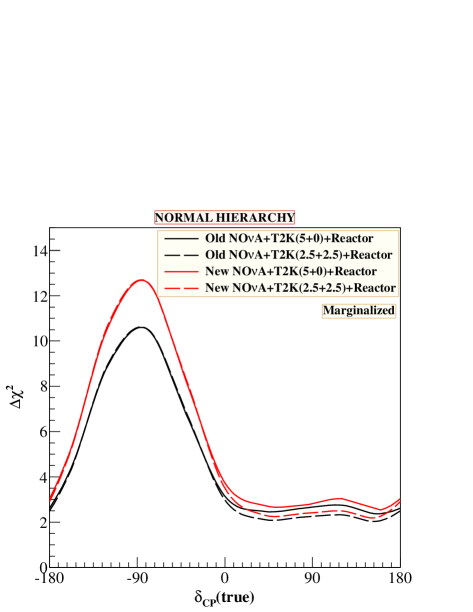
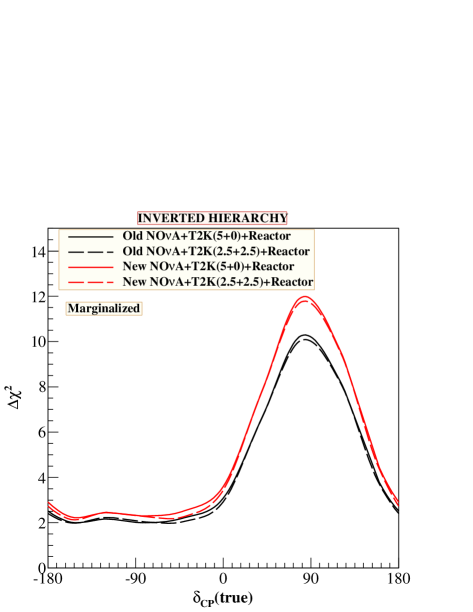
In Fig. 4
we show the impact of using the revised NOA configuration
on the mass hierarchy sensitivity from the combined analysis of the projected
data from T2K, NOA, Daya Bay, RENO and Double Chooz.
The for the mass hierarchy sensitivity with the new NOA configuration
is seen to agree well with a similar plot shown in [32], apart from the
fact that we have used for this plot while the used in
[32] was slightly lower. The other difference is that we have explicitly
added the reactor data to constrain while the authors of
[32] impose a prior on . The mass hierarchy sensitivity
is seen to increase with the new NOA configuration.
We also show in this plot the impact of running T2K for 2.5 years in the
neutrino and 2.5 years in the antineutrino mode. The solid lines are for 5 years of
T2K in only neutrino mode, while the dashed lines are with the 2.5+2.5 years configuration.
The mass hierarchy sensitivity is known to be almost independent of the addition of
T2K data in the range for true normal hierarchy
and range for true inverted hierarchy, where NOA gives very high sensitivity to the
mass hierarchy. However, in the region for true normal hierarchy and the region
for the true inverted hierarchy, the T2K data does play a major role in
increasing the mass hierarchy sensitivity of the combined analysis synergetically.
In this relevant region, it is seen from the figure that running T2K for 2.5 years in neutrino
and 2.5 years in antineutrino mode will result in a small loss in the net mass hierarchy
sensitivity.
The - degeneracy has been discussed recently in
[14, 25]. It has been shown in these works that this degeneracy can be broken
if one allows T2K to run partially in the antineutrino mode as well.
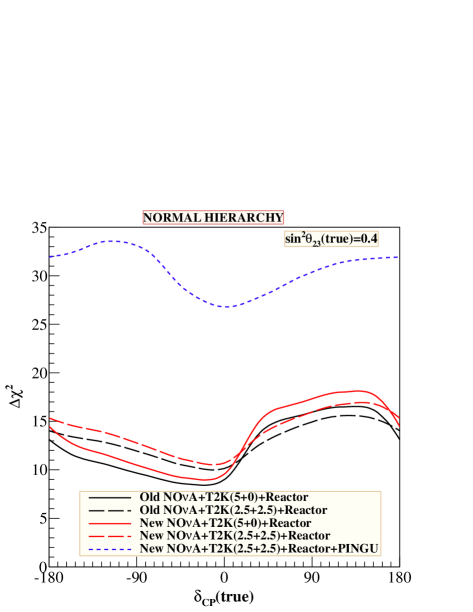
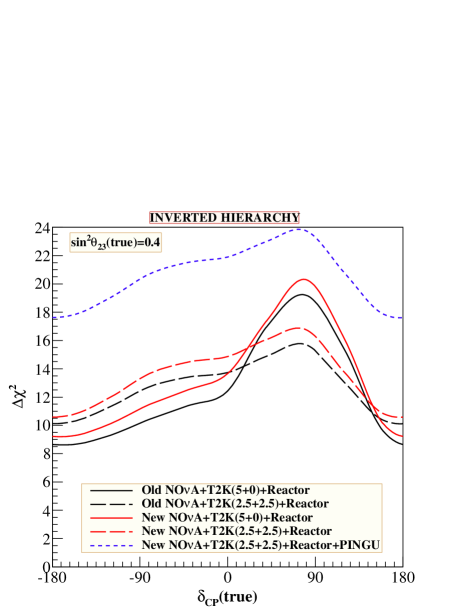
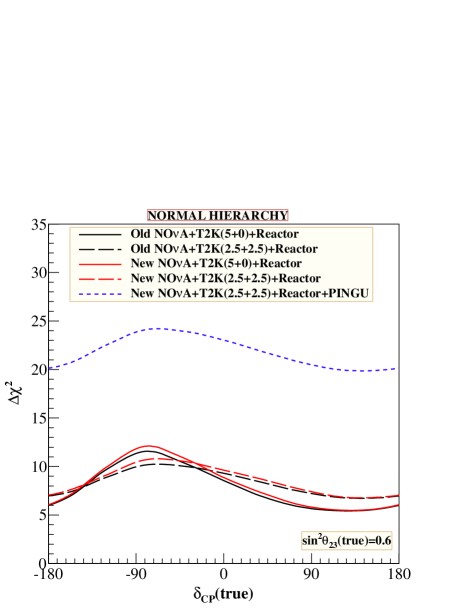
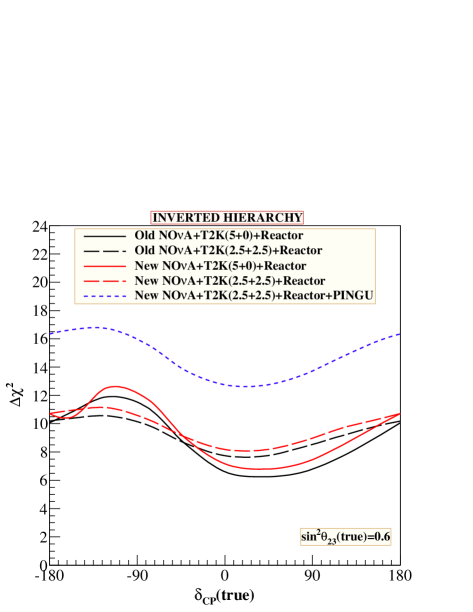
We show the octant sensitivity from the combined analysis of
NOA, T2K and the reactor experiments Daya Bay, RENO and Double Chooz,
in Fig. 5. The figure shows the for the wrong octant
solution as a function of . The left-hand panels are for true normal hierarchy
while the right-hand panels are for true inverted hierarchy. We show the octant
sensitivity for two benchmark values of (upper panels) and
(lower panels). Each of the shown are fully marginalized over
, , , as well as the mass hierarchy.
The black lines are for the combined analysis of
the long baseline and reactor data with the old NOA configuration, while the
red lines are with the new NOA configuration. The red lines in the Fig. 5
are always above the black lines for both hierarchies and for both the benchmark
chosen. Therefore, the new NOA configuration is seen to perform better
for the octant sensitivity as well. The comparison between the T2K set-up running
for full 5 years in the neutrino mode alone (solid lines)
with that where T2K is run for
2.5 years in neutrino and 2.5 years in the antineutrino mode (dashed lines)
is also shown in this figure. While the T2K 2.5+2.5 years set-up is seen to reduce the
for
values where the octant sensitivity of the combined long baseline and
reactor data was higher, it increases the in the
range where the sensitivity was lower. In particular, breaking up of the
T2K running time from 5 years in neutrino to 2.5+2.5 years in neutrino+antineutrino mode
reduces the fluctuation of as a function of .
The blue short-dashed lines in Fig. 5 are obtained when the
T2K, NOA and the reactor data are combined with 3 years of data from the
PINGU atmospheric neutrino experiment. We have used the PINGU configuration
where and and have
included the 5 systematic uncertainties as discussed before.
The PINGU data has almost no dependence
on and adds a constant constant contribution to the octant
sensitivity of the global data. However, note that this additive contribution is more than
what we were getting from PINGU alone. The increase in the from
PINGU comes from the constraint on imposed by the reactor data and
from the constraint on and from the long baseline data. This results in
reducing the effect of marginalization over these parameters. This shows the
synergy between PINGU and the long baseline and reactor data.
If we were to add any further data set
which could help in resolving the neutrino mass hierarchy, like the data from the
INO atmospheric neutrino experiment [41], then this could further lift the
for octant determination, for the low octant case () and for
true normal hierarchy. For the high octant case for true normal hierarchy and for all cases for
true inverted hierarchy, we had seen in the previous section that marginalization over the
hierarchy made no difference and hence for these cases information on the neutrino mass
hierarchy is not expected to bring any further improvement. We must stress here that
addition of the INO data in the combined analysis will also improve the octant
determination reach as INO itself has some octant sensitivity. However, we are
not considering that possibility in this paper and this work will appear elsewhere [42].
For the true normal hierarchy,
from the combined data from T2K, NOA, reactors and 3 years of PINGU,
we expect a for the wrong octant solution between
for , depending on the value of and between
for , depending on the value of .
On the other hand, for the true inverted hierarchy,
from the combined data from T2K, NOA, reactors and 3 years of PINGU,
we expect a for the wrong octant solution between
for , depending on the and between
for depending on the .
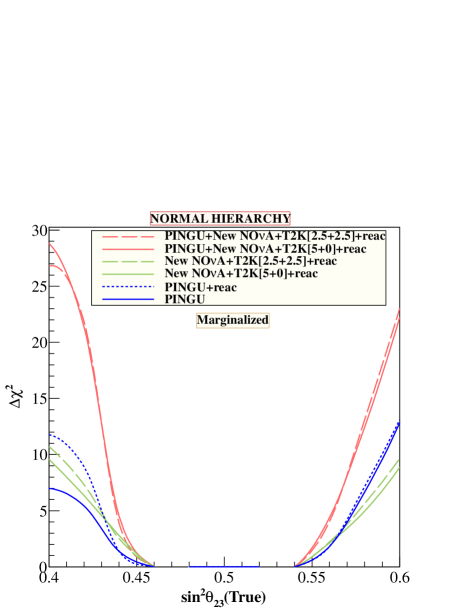
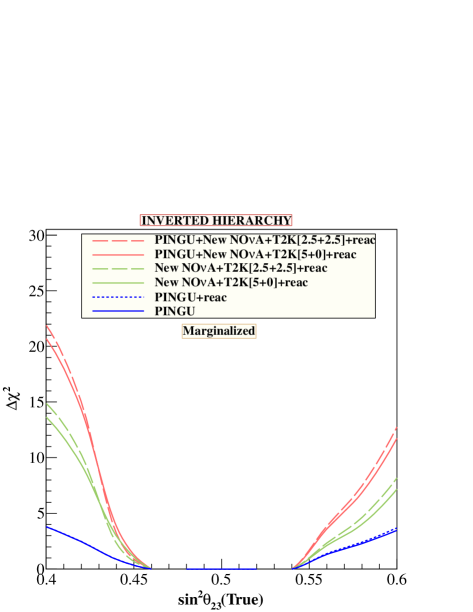
The effect of combining the long baseline and reactor data with 3 years of PINGU data and
the final combined sensitivity of the whole set-up together is shown in Fig. 6,
as a function of . We choose to simulate the data for this figure.
The left-panel of the figure is for true normal hierarchy while the right-panel is for true inverted
hierarchy. Each of the curves shown in this figure have been fully marginalized in the
way discussed before. The blue solid line shows the octant sensitivity of PINGU alone
after marginalizing over oscillation parameters, including the neutrino mass hierarchy.
Here we take and
for PINGU, and full systematic uncertainties as discussed
before. The blue dotted lines show the sensitivity from 3 years of PINGU when the
reactor data from 3 years of running of Daya Bay, RENO and Double Chooz are included
in the analysis. The addition of the reactor data constrains the range, killing the
effect of marginalization over this parameter and hence the
increases for the low values of . For the high
octant side for true normal hierarchy and for all values of for the true
inverted hierarchy, we do not see any improvement from the restriction on
due the reactor data, as was discussed in the
previous section (cf. Fig. 2).
The solid green lines are what we expect from T2K+NOA+Reactor experiments, where
we consider 5 years of running of T2K in the neutrino mode alone, while the dashed green
lines are for the case when T2K is run for 2.5 years in the neutrino mode and 2.5 years in the
antineutrino mode.
A comparison of the potential of PINGU versus the LBL+Reactor data shows that
for the true normal hierarchy case, just 3 years of data from PINGU alone
has a sensitivity to the octant of comparable to that of the
combined long baseline and
reactor data. For values of
closer to maximal mixing, the PINGU alone analysis suffers mainly from marginalization over
in the fit, while for values far away from maximal mixing, especially on the
low octant side, the PINGU sensitivity
is constrained mainly from the uncertainty in and the neutrino mass hierarchy.
This was demonstrated earlier
in Fig. 2. As a result, with the reactor data added the sensitivity
from PINGU improves further for these values of and for true normal hierarchy.
Adding the long baseline data helps constrain and better.
This synergy results in better sensitivity from the combined analysis of
PINGU with T2K, NOA and reactor experiments, and the combined is
higher than the simple sum of the from PINGU and the long baseline and reactor
experiments. The combined is shown by the red lines in the figure. The solid
red line is for T2K running for 5 full years in the neutrino mode while the dashed red lines are for
T2K running for 2.5 years in the neutrino mode and 2.5 years in the antineutrino mode.
For normal hierarchy, the combined data set including 3 years of PINGU will return a
if and , and if .
For the inverted hierarchy, as discussed before, the octant sensitivity of PINGU is
low. On combining with the T2K, NOA and reactor data we expect
if and , and if .
Finally, we have checked that the for the wrong octant from PINGU grows almost linearly with the number of years of running of the experiment. We have presented all results in this paper for a very short running time of only 3 years. But as this experiment accumulates more data, the statistical significance with which if can diagnose the true octant of will grow.
5 Conclusions
In this paper we explored the prospects of determining the octant of
with atmospheric neutrinos at PINGU. For illustration, we simulated 3 years of data
at this experiment with some benchmark detector specifications. We used the
effective volume of the detector read
from [38] for the curve labelled “Triggered Effective Volume, R=100m”. For the
energy and angle resolutions of the neutrino, we used some benchmark values
consistent with that used in the literature. We used Gaussian function for the resolution functions with
our optimal choice for the width of these Gaussians being
and for the
energy and angle resolution, respective. We studied the impact of the worsening of the
resolutions, both in energy and angle. We defined a and showed the statistical
significance with which the octant of can be determined with just 3 years of
running of PINGU. In our analysis we included 5 systematic uncertainties, 4 of which
come from uncertainties in the theoretical fluxes.
We showed in detail the impact of systematic uncertainties on the final from PINGU.
The systematic uncertainties were seen to make a huge impact on the sensitivity, with the
reducing by as much as a factor of 3.5 to 7.5, depending on the energy and angle
resolutions chosen.
Therefore, we conclude that the inclusion of systematic uncertainties on the theoretical
fluxes is a must for any PINGU analysis.
We also looked at the impact of the uncertainties on the neutrino oscillation parameters.
We presented results where the wrong octant from PINGU alone was marginalized
over all oscillation parameters, including the neutrino mass hierarchy. The effect of marginalizing
over was seen to be dominant for both true normal as well as true inverted hierarchy.
The effect of , and the neutrino mass hierarchy was seen to be
dominant for the true normal hierarchy and lower values of . The inclusion of the prospective
3 years of running of the Daya Bay, RENO and Double Chooz reactor data was shown to
alleviate the problem from parameter uncertainties in this region by severely constraining the
allowed range of .
We found that
for the true normal hierarchy, with just 3 years of
PINGU data alone, one could rule out the wrong hierarchy at the C.L.
for and . With addition of the data from the reactor experiments,
we could achieve C.L. determination of the octant for
and for the true normal hierarchy. The sensitivity of PINGU to the
octant of is shown to be rather low for the true inverted hierarchy. The
for the wrong hierarchy goes linearly with the statistics in this regime. Hence
the sensitivity will go up as we increase the number of year of running of PINGU.
We also looked in detail at the prospects of measuring the octant of at the
long baseline experiments T2K and NOA in conjunction with the reactor data which
synergetically determines the value of in a clean way.
The NOA configuration has been re-optimized by the collaboration following the
measurement of . Though the T2K experiment is still slated to run only in the
neutrino mode for the full 5 years, there have been recent studies looking to re-optimize the
T2K run by introducing a few years of antineutrino running for this experiment. In this paper,
we looked at the physics reach of both old as well as new NOA, and T2K run in
both the 5 years in the neutrino mode and 2.5 years of neutrino and 2.5 years in the
antineutrino mode.
We started by comparing the impact on
the mass hierarchy sensitivity due to the change of the NOA and T2K configurations.
We showed that while the new NOA configuration improves the mass
hierarchy sensitivity for the entire range of , running the T2K in the 2.5+2.5 years
of neutrino plus antineutrino mode results in a small reduction of the mass hierarchy sensitivity.
We next looked at the octant sensitivity from these experiments along with the reactor
experiments, and again we made a comparative study of the new vs old NOA and
T2K. As pointed out in the literature before, we found that the addition of the antineutrino run
in the T2K data helps in cancellation of the octant- degeneracy. As a result, in regions of
where the combined sensitivity of T2K, NOA and the reactors to the octant is
low, the addition of the antineutrino run improves the sensitivity to the .
Finally, we added 3 years of projected PINGU data to the projected data from T2K, NOA and the reactors and showed the results both as a function of as well as . Three years of PINGU data along with data from T2K, NOA and the reactors will be able to pin down the right octant of for the true normal hierarchy to better than C.L. for all values of and . A significance for the right octant can be achieved if for the true normal hierarchy. If the inverted hierarchy were true, then we would have a determination of for and from the combined data set with of 3 years of PINGU. The sensitivity will scale as we increase the number of years of running of the PINGU experiment and the coming from PINGU increases almost linearly with the number of years of running of this experiment.
Acknowledgements
We thank S. Prakash for discussions. S.C. acknowledges partial support from the European Union FP7 ITN INVISIBLES (Marie Curie Actions, PITN-GA-2011-289442).
References
- [1] D. J. Koskinen, Mod. Phys. Lett. A 26, 2899 (2011).
- [2] For details of the IceCube experiment see icecube.wisc.edu
- [3] M. G. Aartsen et al. [IceCube Collaboration], Phys. Rev. Lett. 111, 081801 (2013) [arXiv:1305.3909 [hep-ex]].
- [4] T. IceCube [PINGU Collaboration], arXiv:1306.5846 [astro-ph.IM].
- [5] E. K. .Akhmedov, S. Razzaque and A. Y. .Smirnov, JHEP 1302, 082 (2013) [JHEP 1302, 082 (2013)] [Erratum-ibid. 1307, 026 (2013)] [arXiv:1205.7071 [hep-ph]].
- [6] M. Ribordy and A. Y. Smirnov, Phys. Rev. D 87, 113007 (2013) [arXiv:1303.0758 [hep-ph]].
- [7] S. K. Agarwalla, T. Li, O. Mena and S. Palomares-Ruiz, arXiv:1212.2238 [hep-ph].
- [8] W. Winter, Phys. Rev. D 88, 013013 (2013) [arXiv:1305.5539 [hep-ph]].
- [9] M. Blennow and T. Schwetz, arXiv:1306.3988 [hep-ph].
- [10] S. -F. Ge, K. Hagiwara and C. Rott, arXiv:1309.3176 [hep-ph].
- [11] H. Minakata, H. Sugiyama, O. Yasuda, K. Inoue and F. Suekane, Phys. Rev. D 68, 033017 (2003) [Erratum-ibid. D 70, 059901 (2004)] [hep-ph/0211111]; K. Hiraide, H. Minakata, T. Nakaya, H. Nunokawa, H. Sugiyama, W. J. C. Teves and R. Z. Funchal, Phys. Rev. D 73, 093008 (2006) [hep-ph/0601258].
- [12] K. B. M. Mahn and M. H. Shaevitz, Int. J. Mod. Phys. A 21, 3825 (2006) [hep-ex/0409028].
- [13] P. Huber, M. Lindner, T. Schwetz and W. Winter, JHEP 0911, 044 (2009) [arXiv:0907.1896 [hep-ph]].
- [14] S. K. Agarwalla, S. Prakash and S. U. Sankar, JHEP 1307, 131 (2013) [arXiv:1301.2574 [hep-ph]].
- [15] A. Chatterjee, P. Ghoshal, S. Goswami and S. K. Raut, JHEP 1306, 010 (2013) [arXiv:1302.1370 [hep-ph]].
- [16] M. C. Gonzalez-Garcia, M. Maltoni and A. Y. .Smirnov, Phys. Rev. D 70, 093005 (2004) [hep-ph/0408170].
- [17] S. Choubey and P. Roy, Phys. Rev. D 73, 013006 (2006) [hep-ph/0509197].
- [18] D. Indumathi, M. V. N. Murthy, G. Rajasekaran and N. Sinha, Phys. Rev. D 74, 053004 (2006) [hep-ph/0603264].
- [19] A. Samanta and A. Y. .Smirnov, JHEP 1107, 048 (2011) [arXiv:1012.0360 [hep-ph]].
- [20] K. Abe, T. Abe, H. Aihara, Y. Fukuda, Y. Hayato, K. Huang, A. K. Ichikawa and M. Ikeda et al., arXiv:1109.3262 [hep-ex].
- [21] V. Barger, R. Gandhi, P. Ghoshal, S. Goswami, D. Marfatia, S. Prakash, S. K. Raut and S U. Sankar, Phys. Rev. Lett. 109, 091801 (2012) [arXiv:1203.6012 [hep-ph]].
- [22] A. Blake, H. Gallaghar, talk at ISOUP, May 26, 2013.
- [23] P. Coyle et al. [The Km3Net collaboration], contribu- tion to the European Strategy Preparatory Group Sym- posium, September 2012 Krakow, Poland.
- [24] Y. Itow et al. [T2K Collaboration], hep-ex/0106019.
- [25] P. A. N. Machado, H. Minakata, H. Nunokawa and R. Z. Funchal, arXiv:1307.3248 [hep-ph].
- [26] R. Petterson, talk at Neutrino 2012 Conference, June 2-9, 2012, Kyoto, Japan, http://neu2012.kek.jp
- [27] F. P. An et al. [DAYA-BAY Collaboration], Phys. Rev. Lett. 108, 171803 (2012) [arXiv:1203.1669 [hep-ex]].
- [28] J. K. Ahn et al. [RENO Collaboration], Phys. Rev. Lett. 108, 191802 (2012) [arXiv:1204.0626 [hep-ex]].
- [29] Y. Abe et al. [DOUBLE-CHOOZ Collaboration], Phys. Rev. Lett. 108, 131801 (2012) [arXiv:1112.6353 [hep-ex]].
- [30] K. Abe et al. [T2K Collaboration], Phys. Rev. Lett. 107, 041801 (2011) [arXiv:1106.2822 [hep-ex]].
- [31] P. Adamson et al. [MINOS Collaboration], Phys. Rev. Lett. 107, 181802 (2011) [arXiv:1108.0015 [hep-ex]].
- [32] S. K. Agarwalla, S. Prakash, S. K. Raut and S. U. Sankar, JHEP 1212, 075 (2012) [arXiv:1208.3644 [hep-ph]].
- [33] D. S. Ayres et al. [NOvA Collaboration], hep-ex/0503053.
- [34] X. Guo et al. [Daya-Bay Collaboration], hep-ex/0701029.
- [35] J. K. Ahn et al. [RENO Collaboration], arXiv:1003.1391 [hep-ex].
- [36] F. Ardellier, I. Barabanov, J. C. Barriere, M. Bauer, L. B. Bezrukov, C. .Buck, C. Cattadori and B. Courty et al., hep-ex/0405032.
- [37] M. Honda, T. Kajita, K. Kasahara and S. Midorikawa, Phys. Rev. D 70, 043008 (2004) [astro-ph/0404457].
- [38] D. Cowan, talk at Snowmaaa Cosmic Frontier Workshop, March 6-8, 2013, SLAC, USA, http://
-
[39]
A. M. Dziewonski and D. L. Anderson,
Phys. Earth Planet. Interiors 25, 297 (1981);
S. V. Panasyuk, Reference Earth Model (REM) webpage,
http://cfauves5.harvrd.edu/lana/rem/index.html. - [40] P. Huber, J. Kopp, M. Lindner, M. Rolinec and W. Winter, Comput. Phys. Commun. 177, 432 (2007) [hep-ph/0701187]; P. Huber, M. Lindner and W. Winter, Comput. Phys. Commun. 167, 195 (2005) [hep-ph/0407333].
- [41] A. Ghosh, T. Thakore and S. Choubey, JHEP 1304, 009 (2013) [arXiv:1212.1305]; A. Ghosh and S. Choubey, arXiv:1306.1423 [hep-ph].
- [42] A. Ghosh and S. Choubey, in preparation.