15cm
The JHF-Kamioka neutrino project
Abstract
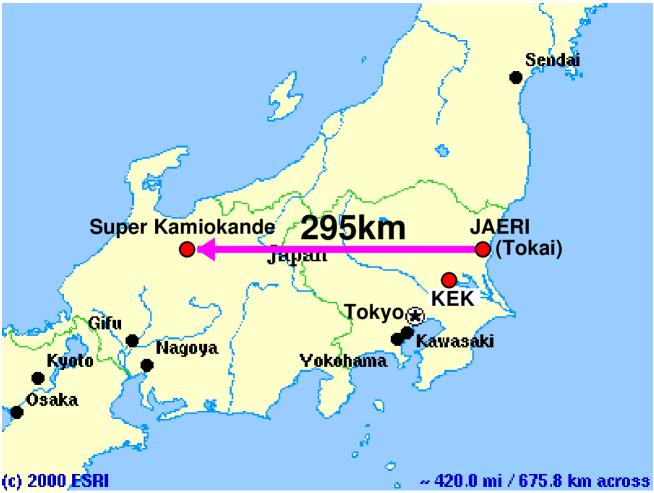
The JHF-Kamioka neutrino project is a second generation long base line neutrino oscillation experiment that probes physics beyond the Standard Model by high precision measurements of the neutrino masses and mixing. A high intensity narrow band neutrino beam is produced by secondary pions created by a high intensity proton synchrotron at JHF (JAERI). The neutrino energy is tuned to the oscillation maximum at 1 GeV for a baseline length of 295 km towards the world largest water Čerenkov detector, Super-Kamiokande. Its excellent energy resolution and particle identification enable the reconstruction of the initial neutrino energy, which is compared with the narrow band neutrino energy, through the quasi-elastic interaction. The physics goal of the first phase is an order of magnitude better precision in the oscillation measurement ( eV2 and ), a factor of 20 more sensitive search in the appearance (), and a confirmation of the oscillation or discovery of sterile neutrinos by detecting the neutral current events. In the second phase, an upgrade of the accelerator from 0.75 MW to 4 MW in beam power and the construction of 1 Mt Hyper-Kamiokande detector at Kamioka site are envisaged. Another order of magnitude improvement in the oscillation sensitivity, a sensitive search of the CP violation in the lepton sector (CP phase down to ), and an order of magnitude improvement in the proton decay sensitivity is also expected.
1 Introduction
1.1 Physics Motivation
The developments of high-energy physics and astrophysics in twentieth century have finally reached the stage where the universe can be described upto second after its birth when electro-weak phase transition took place. However, many mysteries remain to be explored. One of the most profound one is the asymmetry of particles and anti-particles in the universe. Another one is the generation problem; i.e. why three generations of quarks and leptons exist, how are their masses and mixing are determined, and whether quarks and leptons are unified at ultra-high energy. All these questions may closely be related, but they are out of scope of the Standard Model of high energy physics. The JHF-Kamioka neutrino project aims at the studies of physics beyond the Standard Model through precision measurements of the masses and mixing of leptons which seem to be very different from those of quarks.
The discovery of the existence of neutrino oscillation in the atmospheric neutrinos by Super-Kamiokande [1] has opened the possibility of detailed studies of the masses and mixing in the lepton sector. The first accelerator-based long baseline neutrino oscillation experiment, K2K, has started [2]. Its first result already show the indication of the oscillation. The establishment of neutrino oscillation in the first generation experiment should be followed by high precision measurements of neutrino oscillation with much more powerful accelerator.
1.2 Neutrino Oscillation
The lepton mixing is described by a unitary 3x3 matrix (Maki-Nakagawa-Sakata [3] (MNS) matrix) that is defined by a product of three rotation matrices with three angles (, , and ) and complex phase () as in Cabibbo-Kobayashi-Maskawa matrix [4].
| (1) |
| (2) |
where are the flavor indices, =1, 2, 3 are the indices of the mass eigenstates, () stands for (). Neutrinos are produced as flavor eigenstates and each component of mass eigenstates gets a different phase after traveling a certain distance. The detection of neutrino by charged current interactions projects these new state back onto flavor eigenstates. The probability of oscillation is given by the formula,
| (3) | |||||
where
| (4) |
, is the flight distance, and is the neutrino energy. The sign in the third term is the CP violation effect, for neutrinos and for anti-neutrinos. Because , there exist only two independent for three species of neutrinos. Thus 3 generation neutrino oscillation can be described by two ’s, three angles () and one phase ().
We take the two values as the values suggested by solar and atmospheric neutrino measurements; eV2 and eV2. For an oscillation measurement with as in this proposed experiment, the contribution of term is small and the oscillation probabilities can be approximately expressed by two mixing angles;
| (5) | ||||||
| (6) | ||||||
| (7) |
If we define effective mixing angles as and , then the expressions reduce to the ones in the two flavor approximation;
| (8) | ||||||
| (9) |
Experimental constraints obtained from disappearance in the atmospheric neutrino are and eV2 [5]. Solar neutrino observations allow several allowed regions in oscillation parameter space. But even for the largest solution (Large mixing angle solution: LMA), eV2 at 95% CL [6]. The most stringent constraint on comes from reactor disappearance experiments. As can be seen in eq. (7), disappearance directly measures . The current limit is for eV2 and for eV2 at 90 % C.L [7]. Since is very small and atmospheric neutrino data indicates almost full mixing , the effective two flavor mixing angles defined above and 3 flavor angles have following approximate relations;
| (10) |
It follows from eq. (3) that CP violation can be observed only with appearance experiments, since for . Especially oscillation is known to provide the best chance in measuring the CP asymmetry in lepton sector. This is because the leading CP conserving term of oscillation is highly suppressed due to small and the subleading terms, such as related and CP violating terms, give leading contributions, as shown below. If the oscillation is at the observable level in the first phase of the project, further investigation of CP violation will be carried out in the second phase. In addition since CP violation in three generations requires that all three members should be involved in the process, solar neutrino related quantities (, ) must be large (namely large mixing angle solution for solar neutrino oscillation) in order for the CP violation of the neutrino oscillation to be observable.
The appearance probability can be written using MNS matrix element as [8]
| (11) |
The first term has the largest contribution. The second term is generated by CP phase but CP conserving. The third term violates CP. The fourth term, which is the solar neutrino term, is suppressed by . The matter effect is characterized by
| (12) |
where is the Fermi constant, is the electron density and is the earth density. The probability is obtained by the replacing and in eq. (11). As seen in eq. (12) the matter effect is proportional to neutrino energy, so the lower the energy, the smaller the effect is. The CP asymmetry in the absence of matter effect is calculated as
| (13) |
Because is small, CP asymmetry can be large, especially for small .
2 Overview of the experiment
The JHF-Kamioka neutrino project is a long baseline neutrino oscillation experiment using the JHF 50 GeV proton synchrotron (PS). The JHF project was officially approved in 2001 by the Japanese government. The construction of the 50 GeV PS will be completed in 2006. The 50 GeV PS is designed to deliver protons every seconds (0.77 MW), later to be upgraded to 4 MW [9]. A high intensity narrow-band neutrino beam of energy around 1 GeV is produced by using the full proton intensity. The initial far detector is Super-Kamiokande, a 50 kt water Čerenkov detector. The baseline length of the experiment for neutrino oscillation is 295 km between JHF at Tokai and Super-Kamiokande at Kamioka as shown in Figure 1.
A 1 Mt Water Čerenkov detector, Hyper-Kamiokande to be built at Kamioka, is proposed as the second far detector.
A feature of the JHF-Kamioka neutrino experiment is its high intensity narrow band neutrino beam. The neutrino energy of narrow band beam is tunable, and the well-defined energy spectrum has an advantage to achieve the maximum sensitivity for neutrino oscillation. The peak of the beam energy will be tuned at the point of maximum oscillation and the width will be narrowed to suppress the background from non-oscillated neutrinos. With 295 km baseline, the neutrino energy will be tuned to between 0.4 and 1.0 , which corresponds to between and suggested by the recent Super-Kamiokande result [5]. In the design of the neutrino beam line, a shorter decay volume is adopted to lower the flux from muon decays, which is an intrinsic background in search. The narrow band neutrino beam is produced with a conventional method in which parent pions are focused by two magnetic horns. There are two methods to make the narrow band beam: one is momentum-selection of the parent pions by a dipole magnet and the other is a technique called off-axis tuning described in Section 3.
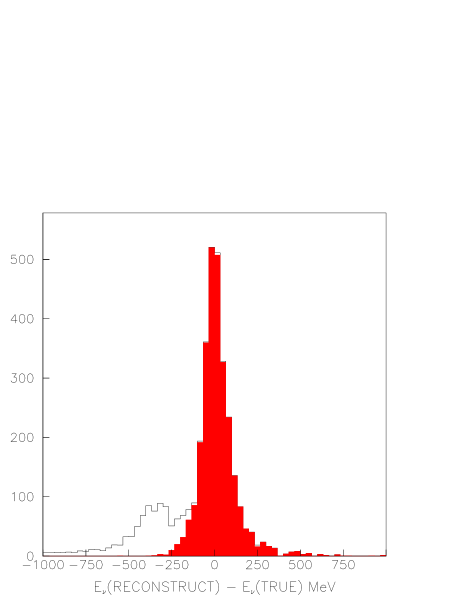
Another feature of the experiment is the reconstruction of the neutrino energy using quasi-elastic (QE) interaction. The QE interaction is the dominant process at a neutrino energy around 1 . In QE interaction, the neutrino energy can be well reconstructed with the charged lepton in charged current interaction. In QE interaction, the neutrino energy is expressed as:
| (14) |
where and is the mass of the neutron and the lepton (=e or ), and , and is the energy, the momentum, and the angle of the lepton relative to the neutrino beam, respectively. This method matches well with the characteristics of the water Čerenkov detector which has an excellent performance for electrons, muons and photons in this energy scale. As an example, the relation between the reconstructed neutrino energy and the true one, and the energy resolution of events are shown in Figure 2 for 2 degree off-axis beam explained in Section 3.

The project is divided into two phases. In the first phase, the main physics goal is the precision measurement of neutrino oscillation with the 50 GeV PS of 0.77 MW beam power and Super-Kamiokande. Typically, interactions per year in the full volume of the detector are expected without neutrino oscillation. In oscillation channel, a measurement of the oscillation pattern determines with precision and with a precision better than . A non-oscillation scenario, such as a model of neutrino decay or a model with extra dimension [10], can be ruled out in the measurement. A search for appearance channel is conducted with a sensitivity of down to . Many theories suggest large value of [11]. A confirmation of oscillation is carried out by counting the number of neutral current interaction. The measurement also constrains the existence of a sterile neutrino or a model of non-oscillation, which is introduced to explain both LSND result and solar neutrino results together with atmospheric neutrino oscillation. In the second phase, there are mainly three physics goals: (1) search for below level, (2) search for CP violation in neutrino oscillation, and (3) discovery of the proton decay as an evidence of the Grand unification theory (GUT). In the search for CP violation, the low energy neutrino beam has the advantage of large CP asymmetry and small matter effect as discussed in Section 1.2.
The JHF-Kamioka neutrino project is a unique experiment in the world. The experiment has much more sensitivity for neutrino oscillation than other long baseline neutrino experiments (K2K, MINOS, and OPERA) due to the high power JHF accelerator and the huge Super-Kamiokande detector. The second phase of the experiment is competitive with a recent proposal of a neutrino factory [12] in terms of CP violation reach and uses established technologies. The JHF-Kamioka neutrino project is expected to start in 2007 at the same time of completion of the JHF accelerator.
3 Neutrino beam at JHF
The layout of JHF facility is drawn in Figure 3.
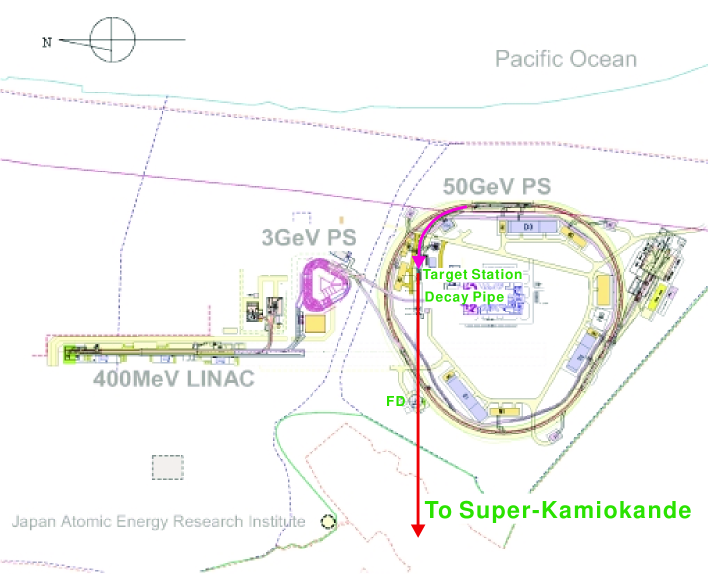
The proton beam is fast-extracted from the 50 GeV PS in a single turn and transported to the production target. The design intensity of the PS is protons/pulse (ppp) at a repetition rate of 0.292 Hz (3.42 second period), resulting in a beam power of 0.77 MW (2.64 MJ/pulse). The spill width is 5.2 sec. We define a typical one year operation as protons on target (POT), which corresponds to about 130 days of operation. The protons are extracted toward inside of the PS ring, and are bent by 90∘ to SK direction by the transport line with a radius of curvature of 110 m smaller than the PS arc. We will adopt superconducting magnets for the transport line. The secondary pions (and kaons) from the target are focused by electromagnetic horns [13], and decay in the decay pipe. The length of the decay pipe from the target position is 80 m. The first front detector is located at 280 m from the target.
There are three options of beam configurations; wide band beam (WBB), narrow band beam (NBB) and off axis beam (OAB). The difference is in the optics for the secondary particles. The WBB uses two electromagnetic horns to focus secondary pions. Horn-focused WBB has been widely used in experiments including K2K. Since the momentum and angular acceptance of the horn system is large, the resulting neutrino spectrum becomes wide. The NBB is obtained by placing a dipole magnet between the two horns of WBB. Momentum selected pion beam produces a monochromatic neutrino beam. The peak neutrino energy can be tuned easily by changing the current of the dipole magnet. The OAB is another option to produce a narrow neutrino energy spectrum [14]. The optics is almost same as the WBB, but the axis of the beam optics is displaced by a few degree from the far detector direction (off-axis). With a finite decay angle, the neutrino energy becomes almost independent of parent pion momentum as a characteristics of the Lorenz boost, which provides the narrow spectrum. The peak neutrino energy can be adjusted by choosing the off-axis angle. For each of the above beam configurations, and can be switched by flipping the polarity of the focusing magnets.
Monte-Carlo (MC) simulations using GEANT [15] have been performed to estimate expected neutrino spectra and number of events. The target, horns, bending magnet and decay pipe are put into the geometry of the simulation. The target is assumed to be simple Cu rod of 1-cm diameter and 30-cm long. Hereafter we refer to the NBB with selected pion momentum of # GeV/c as LE# and OAB with a beam axis # degree offset as OA#∘. The simulation code is essentially the one used in the K2K experiment except for the hadron production model. The Calor-Fluka model [16], which is known to work better at higher energies, is used in the present simulation while a dedicated model base on hadron production data taken near 12 GeV is used in the K2K. From the observation of neutrino events at front detector of K2K, the K2K beam MC is known to provide absolute neutrino flux within 20% error.
Fig. 4 shows expected neutrino energy spectrum of charged current interactions at Super-Kamiokande.
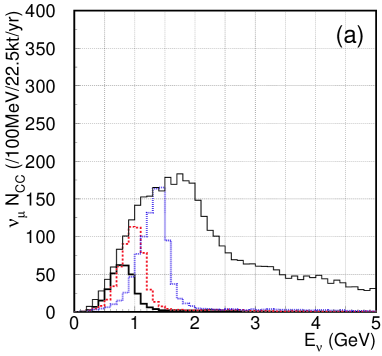
Fluxes and numbers of interactions are summarized in Table 1.
| Flux | /(%) | # of interactions | |||||
|---|---|---|---|---|---|---|---|
| Beam | total | ||||||
| WIDE | 1.1 | 25.5 | 0.19 | 0.74 | 0.34 | 7000(5200) | 78(59) |
| LE1.5 | 0.7 | 5.3 | 0.05 | 1.00 | 0.39 | 510( 360) | 5.7(4.2) |
| LE2 | 0.95 | 7.0 | 0.05 | 0.73 | 0.15 | 870( 620) | 6.8(5.0) |
| LE3 | 1.4 | 8.0 | 0.05 | 0.65 | 0.16 | 1400(1000) | 9.3(6.9) |
| OA2∘ | 0.7 | 19.2 | 0.19 | 1.00 | 0.21 | 3100(2200) | 60(45) |
| OA3∘ | 0.55 | 10.6 | 0.13 | 1.21 | 0.20 | 1100( 800) | 29(22) |
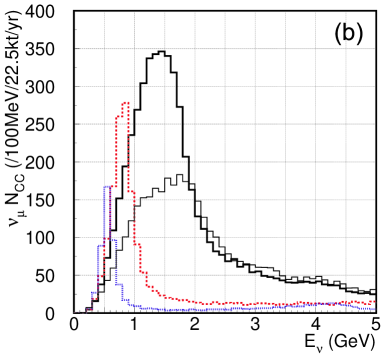
LE2 and OA2∘ have a sharp peak at 0.95 GeV and 0.7 GeV, respectively, and WBB has a broad peak at 1 GeV. The OAB is roughly a factor of three more intense than NBB. NBB has the least high energy tail among the three beams. The contamination in the beam are expected to be 0.7%, 0.7% and 1.0% for WBB, LE2 and OA2∘. The sources of are decay chain and K decay (Ke3). Their fractions are -dacay: 54%, K-decay: 46% for LE2 and -dacay: 37%, K-decay: 63% for OA2∘. The energy spectra of the contamination are plotted in Fig. 5.
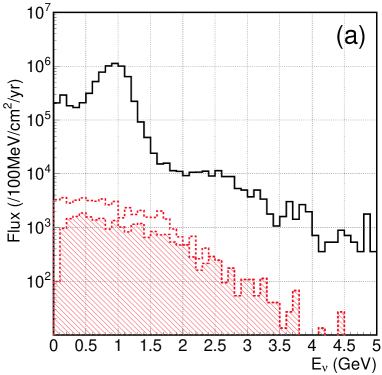
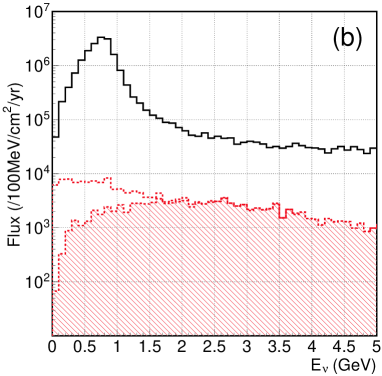
At the peak energy of spectrum, the ratio is as small as 0.2% in the cases of NBB and OAB. This indicates that beam background is greatly suppressed (factor ) by appling energy window cut in the event selection. The decay is the largest contribution at the peak neutrino energy as shown in the figure.
One of the sources of systematic uncertainties in estimating the expected number of events in the far detector from the observation in the near detector is the spectrum difference between far site and near site. In Figure 6, spectra at far and near sites are compared. The peak postion is shifted to higher energy at the far site than at the near site. The far/near spectrum ratio is also plotted in the figure. The difference is as large as 4050% for NBB and OAB and reaches almost 80% for WBB.
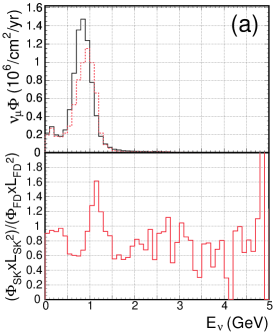
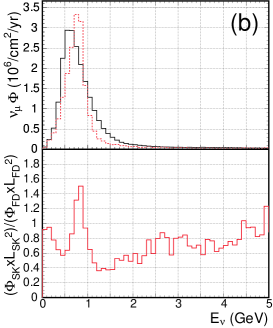
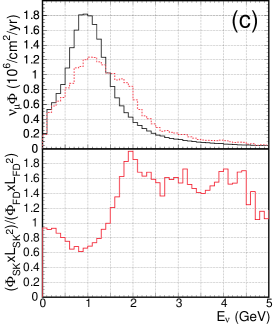
The sources of this far/near difference are
-
•
Difference in the solid angle between far and near detectors. Larger angle neutrinos from beam axis can contribute more to the near detector than to the far detector. The Large angle neutrinos have different energies from neutrinos at zero degree direction.
-
•
Finite length of decay pipe. The near detector has a larger solid angle for pions which decay near the end of the decay pipe than those decaying at the beginning of the decay pipe. Higher momentum pions decay further downstream. For the far detector, the length of the decay pipe can be neglected as a point source. Thus the neutrino spectrum is also distorted by this finite decay pipe effect.
At the distance longer than one km from the target, both of the above two effects become negligible and the far/near ratio becomes flat.
4 Secondary beam monitor and Neutrino detectors
4.1 Muon monitor
Muons from pion decays are measured by the muon monitor. Only such a beam monitor can monitor the beam condition spill by spill, since a neutrino detector cannot monitor the beam condition in such a short period of spill. The primary purpose of the muon monitor is to measure the beam direction with a precision of 1 similar to K2K [2] by measuring the center of the muon beam profile. The stability of the neutrino beam intensity is also monitored by measuring the time dependent muon yield.
The beam monitor is located right after the beam dump which stops all hadronic activities. We prepare separate beam monitors for each beam, since the beam center and the muon energy of NBB is different from those of OAB.
4.2 Near neutrino detector
The main purposes of the front-detector at the near site are as follows.
-
1.
Measurement of the neutrino flux to estimate the flux at SK.
-
2.
Measurement of the neutrino energy spectrum. The spectrum measurement as a function of the distance from the beam center gives constraint on the estimation of the “” ratio.
-
3.
Measurement of neutrino cross sections for various interaction modes, such as charged current quasi-elastic, charged current non quasi-elastic, and neutral current interactions.
-
4.
Measurement of the contamination for the appearance search.
-
5.
Measurement and monitoring of neutrino beam direction.
For these purposes, we have several options for the detector. For low energy neutrinos with energy below 1 GeV, fully active detectors, such as water Čerenkov and a fine grained scintillator detectors satisfy our requirements. Because typical event rate in the first near detector is events per spill per ton for OAB and events for NBB, it hard to use a water Čerenkov detector like the 1kt detector of K2K. The fully active scintillator tracker proposed for the K2K upgrade [17] can be operated at high event rate. The difference in the neutrino target material between H2O and CH2 needs to be studied using the near detector and the narrow-band neutrino beam.
There is a possibility of a second near detector located at a few kilometers distance from the target. At that distance, the “ ratio” is almost flat as discussed in section 3. In addition, because the neutrino flux is not as high as at the near site, a Water Čerenkov detector can be operated with a reasonable event rate. Currently, we look for a place for the detector, and we study the necessity of the detector at the position.
4.3 Far detector: Super-Kamiokande
The far detector, Super-Kamiokande, is located in the Kamioka Observatory, Institute for Cosmic Ray Research (ICRR), University of Tokyo, which has been successfully taking data since 1996. The detector is also used as a far detector for K2K experiment. It is a 50,000 ton water Čerenkov detector located at a depth of 2,700 meters water equivalent in the Kamioka mine in Japan. Its performance and results in atmospheric neutrinos or solar neutrinos have been well documented elsewhere[1, 5, 6]. A schematic view of detector is shown as Fig 7.
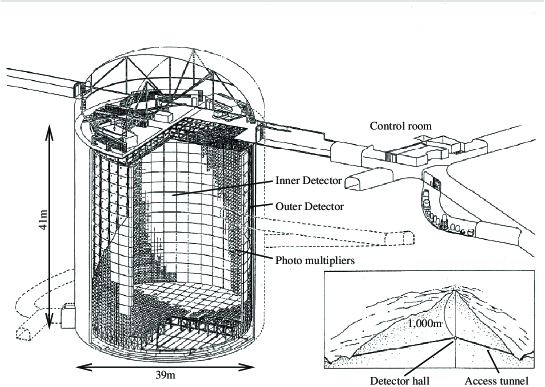
The detector cavity is 42 m in height and 39 m in diameter, filled with 50,000 tons of pure water. There is an inner detector (ID), 33.8 m diameter and 36.2 m high, surrounded by an outer detector (OD) of approximately 2 m thick. The inner detector has 11,146 50 cm photomultiplier tubes (PMTs), instrumented on all surfaces of the inner detector on a 70.7 cm grid spacing. The outer detector is instrumented with 1,885 20 cm PMTs and used as an anti-counter to identify entering/exiting particles to/from ID. The fiducial volume is defined as 2 m away from the ID wall, and the total fiducial mass is 22,500 ton. Čerenkov rings produced by relativistic charged particles are detected by ID PMT’s. The trigger threshold is recently achieved to be 4.3 MeV. The pulse hight and timing information of the PMT’s are fitted to reconstruct the vertex, direction, energy, and particle identification of the Čerenkov rings. A typical vertex, angular and energy resolution for a 1 GeV is 30 cm, 3∘ and 3% for vertex, respectively. The Čerenkov ring shapes, clear ring for muons and fuzzy ring for electrons, provides good / identification. A typical rejection factor to separate ’s from ’s (or vice versa) is about 100 for a single Čerenkov ring events at 1 GeV. The ’s and ’s are further separated by detecting decay electrons from the decays. A typical detection efficiency of decay electrons from cosmic stopping muons is roughly 80% which can be improved by further analysis. A 4 coverage around the interaction vertex provides an efficient detection and / separation as discussed in sections 5.2 amd 5.3.
Interactions of neutrinos from the accelerator are identified by synchronizing the timing between the beam extraction time at the accelerator and the trigger time at Super-Kamiokande using the the Global Positioning System (GPS). The synchronization accuracy of the two sites is demonstrated to be less than ns in the K2K experiment. Because of this stringent time constraint, and the quiet environment of the deep Kamioka mine, chance coincidence of any entering background is negligibly low. A typical chance coincidence rate of atmospheric neutrino events is /spill, which is much smaller than the signal rate of about 3/spill for the WBB option.
5 Physics in the first stage of the project
5.1 High precision measurement of and with disappearance
The neutrino energy can be reconstructed through quasi-elastic (QE) interactions as shown in Equation 14 by the Super-Kamiokande (SK) detector. In this analysis, we use the same muon selection criteria as those used in the atmospheric neutrino analysis by the Super Kamiokande collaboration [1]; fully contained single ring muon-like events in a fiducial volume of kt. The neutrino energy spectrum at SK in five years exposure of the JHF OA2∘ neutrino beam is shown in Figure 8 (bottom) assuming no neutrino oscillation. The observed energy spectrum for the neutrino oscillation with the parameters of is shown in Figure 8 (top), which shows large dip at around 800 MeV. In this analysis, is approximated to be zero and thus . The value of will be determined in the search.
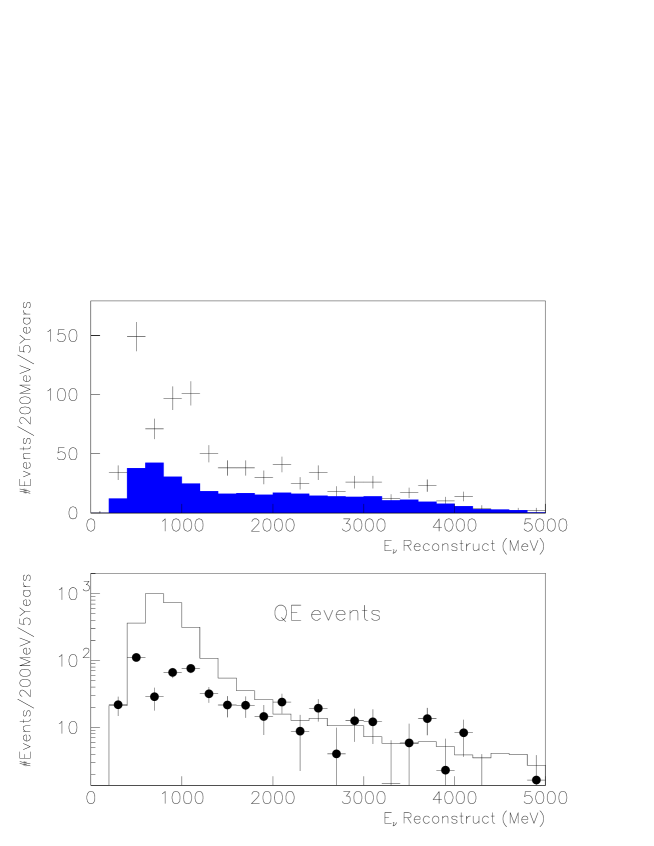
In the oscillation analysis, the true neutrino energy spectrum is extracted by subtracting the contribution of non-QE background events. To measure the oscillation parameters, full Super-Kamiokande Monte Carlo events are generated and the ratio between the “measured” spectrum at SK and the the expected one without oscillation is fitted by the function of in Equation 6 after subtracting the non-QE contribution. Since the spectrum of non-QE events depends on the oscillation parameters, the non-QE spectrum are updated by the fit result at each iteration of the fitting. The survival probability of is shown in Figure 9, which gives the fit result of . The oscillation pattern is clearly seen and the precision of 1 % and the precision of are expected.
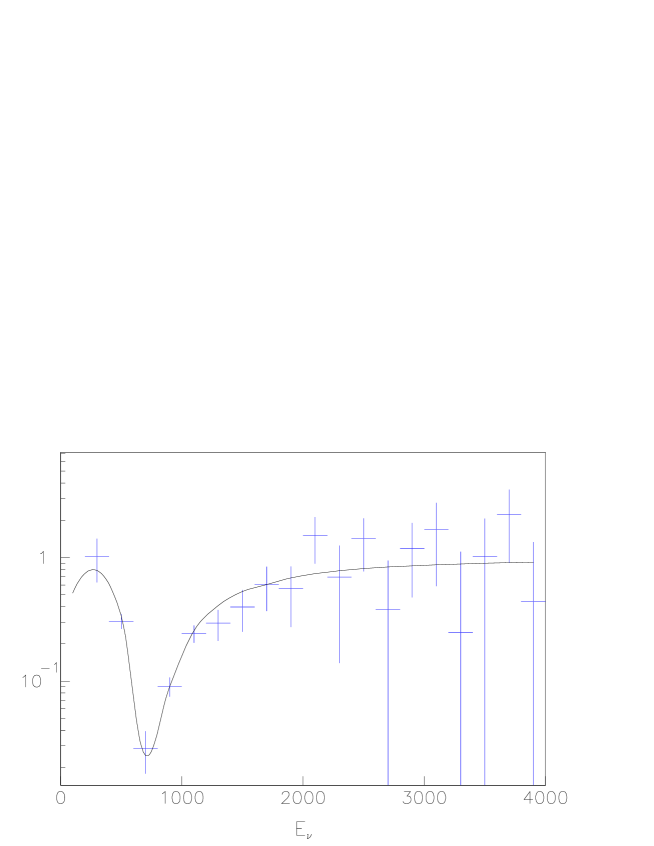
Several beam configurations are studied in the range of between and . The result is summarized in Figure 10. With OA2∘, the maximum sensitivity to the oscillation parameters is achieved at .
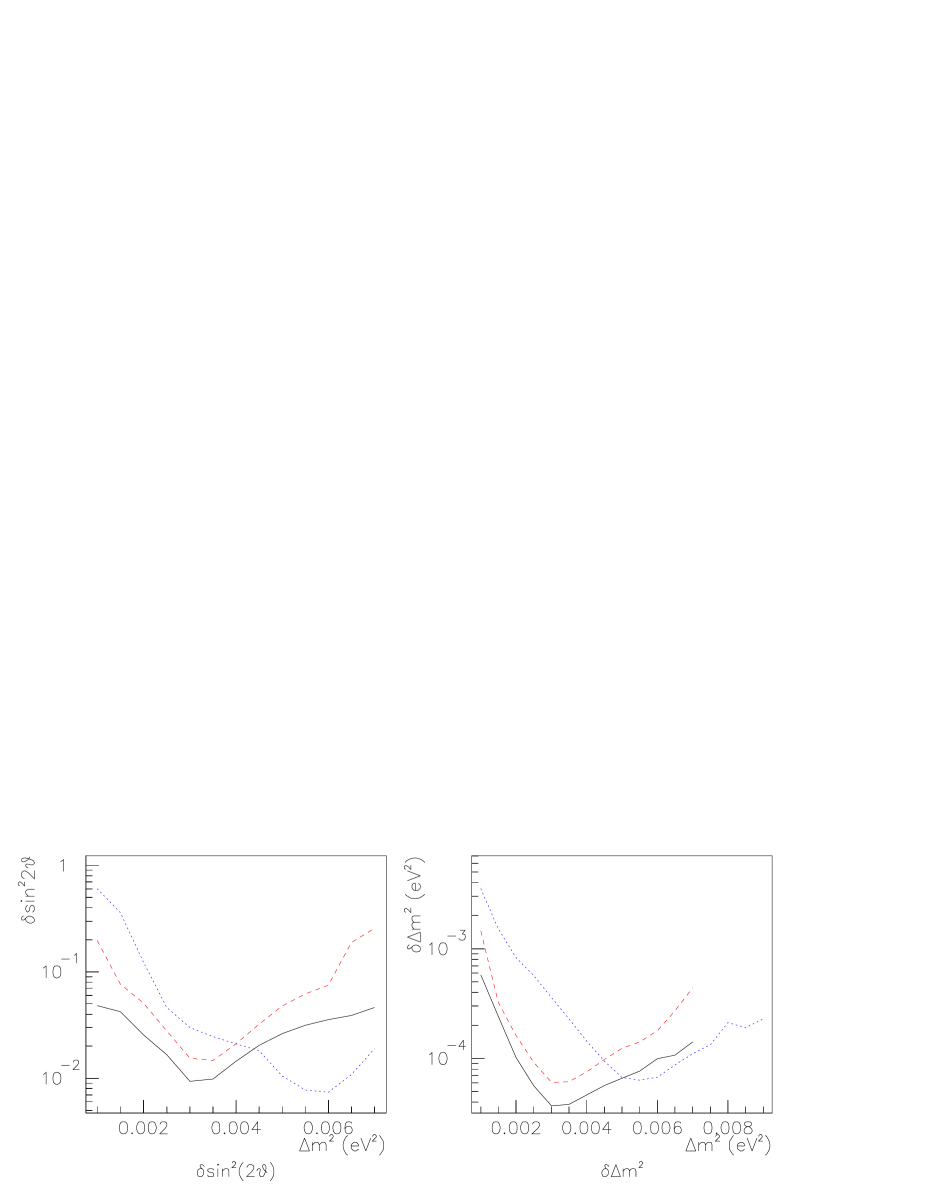
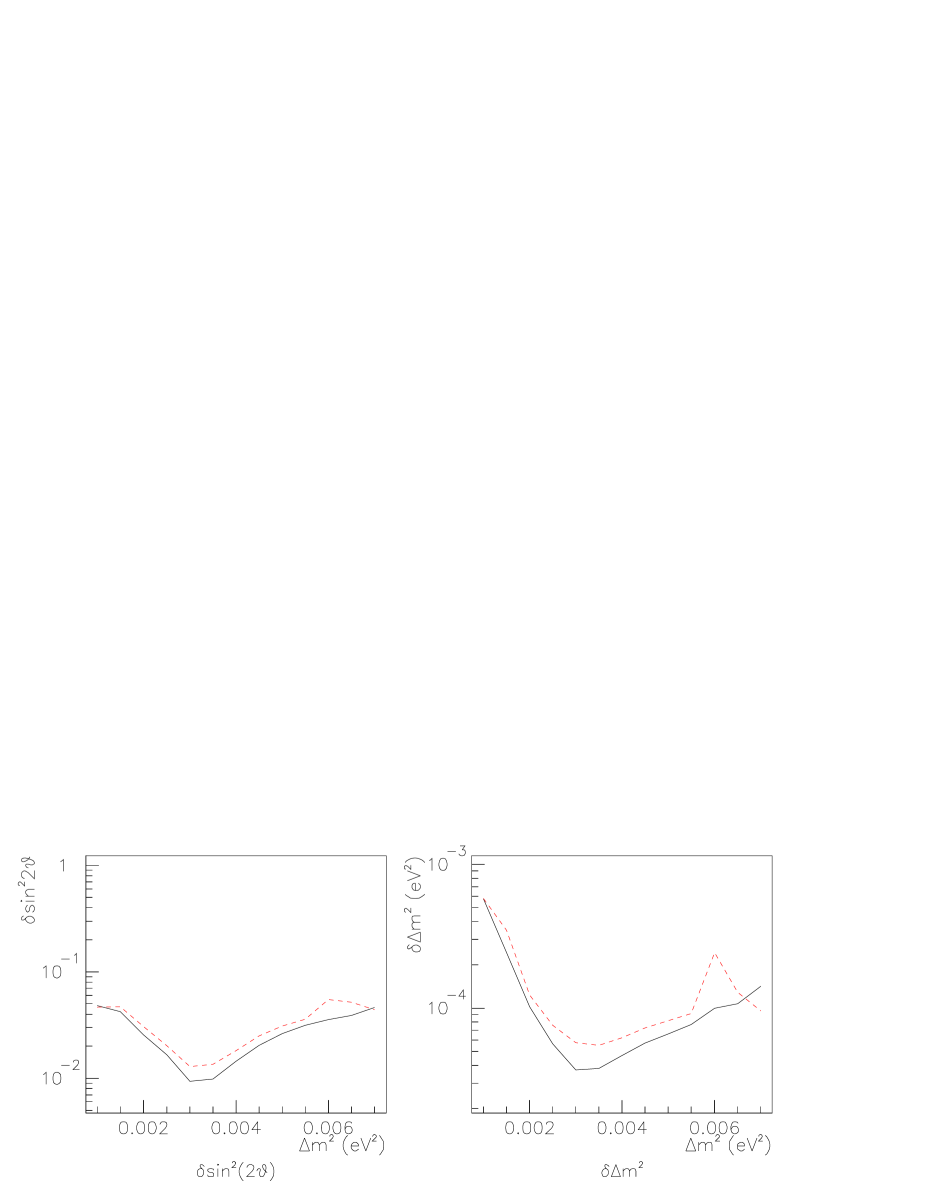
So far, we assumed . In the case of , which is the lower bound suggested by atmospheric neutrino result of Super-Kamiokande, is shown in Figure 11. The precision is slightly worse due to non-oscillated neutrino events at the oscillation maximum.
By selecting the bin at the oscillation maximum, the disappearance signal dip is enhanced and thus the contribution of the systematic uncertainties are largely suppressed. For example, the depth of the dip in Figure 9, which corresponds to , is as small as 3%. Thus, a systematic uncertainty of 10% in the flux normalization (far/near ratio) contributes to 0.3% in the measurement. Assuming 10% systematic uncertainty in the far/near ratio, which is similar to K2K’s number of 6%, 4% uncertainty in the energy scale, and 20% uncertainty in the non-QE background subtraction, the total systematic error is estimated to be less than 1 % for and less than for . The systematic uncertainties are expected to be reduced further below the statistical uncertainties by the neutrino flux measurement using QE events and detailed non-QE background measurement by the front detector, by the pion production measurement, and possibly a second near detector at a few km point which makes the systematics in the far/near ratio negligible.
The overall sensitivity of the first phase is expected to be 1% in precision for and better than for .
5.2 appearance search
The JHF neutrino beam has small contamination (0.2% at the peak energy of OAB and NBB) and the appearance signal is enhanced by tuning the neutrino energy at its expected oscillation maximum. Reconstruction of the neutrino energy provides oscillation pattern and makes a positive identification of the appearance signal. Thus, JHF-Kamioka neutrino experiment has an excellent opportunity to discover appearance and thus measure . In this section, the sensitivity on appearance is described based on the full Monte Carlo simulations and analysis of Super-Kamiokande and K2K experiments.
5.2.1 Background sources and event selection criteria
The process of the appearance signal is searched for in the QE interaction. Since the proton momentum from the QE interaction is usually below the Čerenkov threshold, the signal has only a single electro-magnetic shower (single ring e-like). The possible background processes are with e/ misidentification, contamination, and background. The background from misidentification is found to be negligible due to excellent e/ separation of Super-Kamiokande. The contamination is as small as 0.2-0.3%. A produced by neutral current and inelastic charged current processes is a possible background when one of the photon is missed or 2 photons overlaps.
The standard Super-Kamiokande atmospheric neutrino analysis requirements are used to select a single ring e-like event: single ring, electron like (showering), visible energy greater than 100 MeV, and no decay electrons. The electron identification eliminates all of the background, and the decay electron cut further eliminates inelastic charged current processes associated with . Reduction of number of events by the “standard” 1ring e-like cut for charged and neutral current events are listed in Table 2 2). The remaining background events at this stage are predominantly from single production through neutral current interaction and a contamination.
| OAB | C.C. | N.C. | Beam | Oscillated |
|---|---|---|---|---|
| 1) Generated in F.V. | 10713.6 | 4080.3 | 292.1 | 301.6 |
| 2) 1R e-like | 14.3 | 247.1 | 68.4 | 203.7 |
| 3) e/ separation | 3.5 | 23.0 | 21.9 | 152.2 |
| 4) 0.4 GeV GeV | 1.8 | 9.3 | 11.1 | 123.2 |
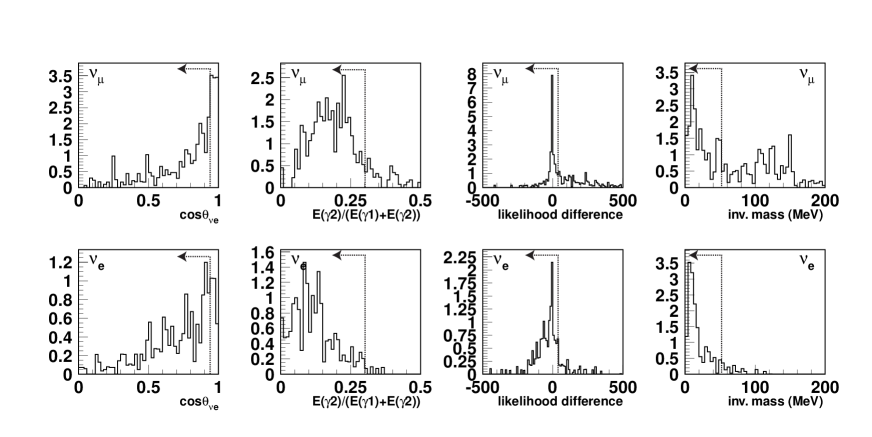
For neutrino energies below 1 GeV, the energy of produced is low and thus the probability of the two photons to merge to one is small. The limitation comes from asymmetric decay of with one high and one low photon energies, where the lower energy photon tends to be hidden under the scattered light111About 10-20% of the light are scattered in the water before reaching the photomultiplier tubes causing broadly distributed background light. of the higher energy photon. In order to recover this hidden lower energy photon and further suppress the background, the photomultiplier hit pattern including scattered light is fitted under the hypotheses of single and that of double electro-magnetic rings. Figure 12 shows distributions of four characteristic quantities that separates signal events from background events as follows:
-
•
Angle between and e ():
Some fraction of background has a steep forward peak, which is likely due to coherent production. Those events in the extreme forward direction are rejected. -
•
Energy fraction of lower energy ring ()
The signal tends to have a low energy second ring which is either a fake ring or a ring due to bremsstrahlung. Those events with the large energy fraction are rejected. -
•
Difference between double and single ring likelihood:
Single ring like events are selected. -
•
Invariant mass of 2 photons:
The background shows a peak at 135 MeV whereas the signal shows small invariant mass. Those events with large invariant mass are rejected.
Table 2 3) lists the number of events after this separation. An order of magnitude extra rejection (247.1/23) in the neutral current background is achieved with 152.2/203.7=75% in signal acceptance.
5.2.2 Oscillation sensitivity
Figure 13 (left) shows the reconstructed neutrino energy distributions for 5 years exposure of JHF OA2∘. The oscillation parameters of eV2 and are assumed. A clear appearance peak is seen at the oscillation maximum of 0.75 GeV. By integrating the number of events in the energy range between 0.4 and 1.2 GeV, 90% and 3 limits are derived as a function of the exposure time (the right plot of Figure 13). The reach of the first phase is as good as at 90% confidence level. The systematic uncertainty in background subtraction is chosen to be 2%, 5% and 10%. Though the systematic uncertainty is not important in the first phase, it becomes significant in the second phase.
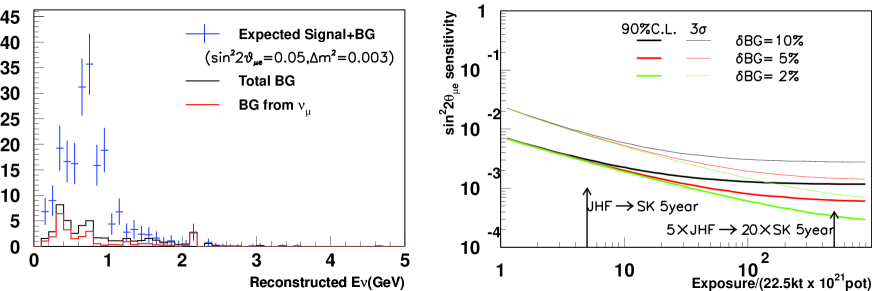
Figure 14 shows 90%C.L. contours for 5 year exposure of each beam configuration assuming 10% systematic uncertainty in background subtraction.
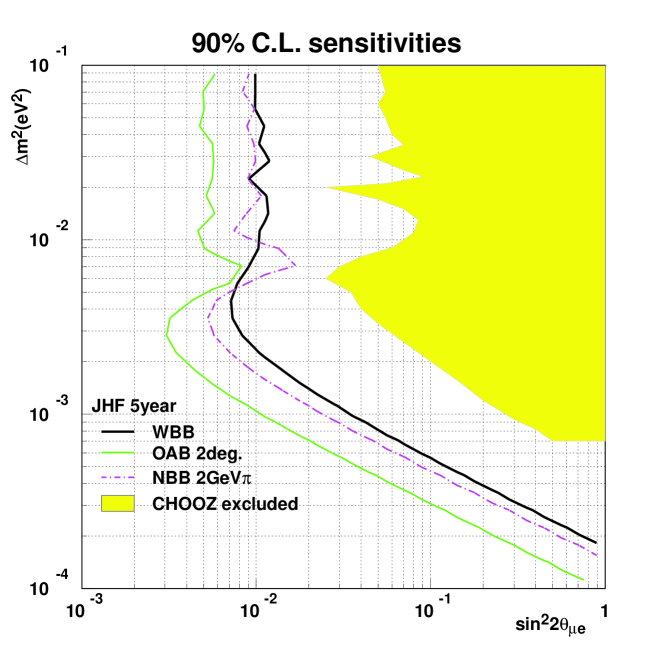
The best sensitivity at around eV2 is given by OA2∘ and the sensitivity is at 90%C.L. If the is significantly larger or smaller than eV2, the sensitivity can be optimized by adjusting the neutrino energy as described in section 3. In the predicted range of eV eV2 by the Super-Kamiokande, the sensitivity is better than or at 90% confidence level.
5.3 Confirmation of in atmospheric neutrino observation
Neutral current (NC) interaction detects the sum of , and oscillations222According to the LEP result, there are only 3 light active neutrinos.. Therefore, NC measurement combined with and measurements provide indirect measurement of the oscillation. The NC measurement also provides a constraint on the existence of a sterile neutrino, , since the oscillation results in reduction of NC interactions.
In the JHF neutrino beam energy of 1 GeV, the dominant NC interactions are single productions. Among those, single production process has a unique signature that only electromagnetic showers made by decay photons are observed without any other activities. Therefore, we focus on the single production mode.
A background from charged current (CC) interactions with a are separated by identifying at least one muon in the final state. Muons are identified by detecting an extra Čerenkov ring or the Cherenkov photons, or by detecting the decay electrons. In the Super-Kamiokande analysis, the efficiency of detecting the decay electrons is better than 80%. Another background is from NC interactions by high energy neutrinos which are out of the oscillation maximum. Though we cannot reconstruct the initial neutrino energy for the NC interaction, the total energy deposit in the detector, called “visible energy”, is used to reject high energy events. When the high energy neutrino produces multiple pions, which is the dominant process at high energy, they are further suppressed by vetoing on the extra pion rings as well as decay electrons from the decay chain.
Thus, the selection criteria are defined as follows: 1) the event must be fully contained, 2) visible energy (electron equivalent energy) must be greater than 100 MeV and less than 1500 MeV, 3) the number of rings in an event must be less than three, 4) all the rings must be electron-like and 5) no decay electron is identified.
After applying these selection criteria, about 315 events are expected to be observed in one year without neutrino oscillation for WBB. Out of 315 events, 88% are from NC interactions, 9% are from CC interactions, and 3% are from CC interaction intrinsically in the beam. The remaining 9% events from CC interactions is hard to be eliminated because the muon is captured by oxygen and does not decay. The results are summarized in Table 3 together with the other beam configurations.
| Beam | #NC Events | Beam exposure | |||
|---|---|---|---|---|---|
| WBB | 315 | 1 years | 0.88 | 0.09 | 0.03 |
| LE2 | 250 | 5 years | 0.80 | 0.13 | 0.07 |
| OA2∘ | 700 | 5 years | 0.84 | 0.09 | 0.07 |
The expected numbers of events as a function of are shown in Figure 15. In the figures, maximal oscillations, =1.0, is assumed.
(a) (b) (c)
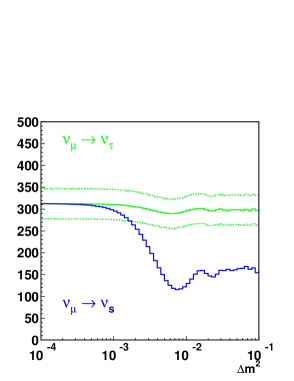
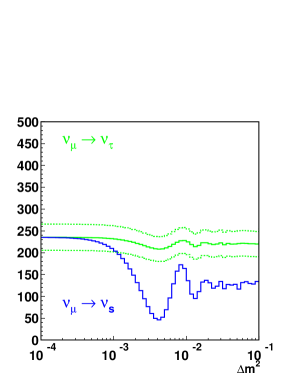
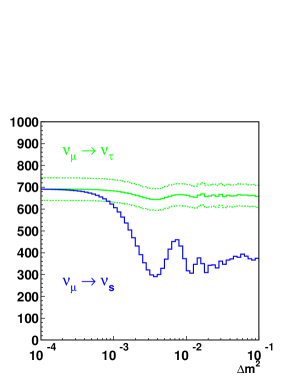
Although full mixing is assumed, expected number of events does not become 0 even at the deepest dip point. This is due to the NC interactions of high energy neutrinos. The dotted lines in each figure correspond to the 90% C.L. limit for oscillations assuming a systematic uncertainty of 5%. The expected numbers of events for and for are clearly separated if the is larger than for WBB, for LE2 and for OA2∘.
6 Physics in the future extension with Hyper-Kamiokande
In the 2nd phase of the JHF-Kamioka neutrino experiment, the proton intensity is planned to go up to 4 MW [9]. The pion (or neutrino) production target will also be upgraded to a liquid metal target to accept the 4 MW beam. The shielding of the decay pipe will be designed to accomodate such a beam.
As for the far detector, Hyper-Kamiokande detector is proposed as a next generation large water Čerenkov detector [18] at Mozumi zinc mine in Kamioka, where the Super-Kamiokande detector is located. Schematic view of one candidate detector design is shown in Figure 16. A large water tank is made from several 50 m 50 m 50 m sub-detectors. The tank will be filled with pure water and photomultiplier tubes (PMTs) are instrumented on all surfaces of sub-detectors. The fiducial volume of each sub-detector is about 70 kt and 1 Mt volume is achieved by 14 sub-detectors. The 2.0 m thick outer detectors completely surround the inner sub-detectors and the outer region is also instrumented with PMTs. The primary function of the outer detectors is to veto cosmic ray muons and to help identify contained events.
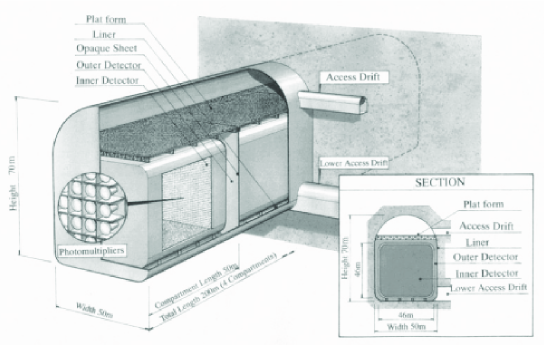
The Kamioka site satisfies the conditions required for constructing large water Čerenkov detectors: easy access to underground, clean water, hard and uniform rock, and infrastructure/technology for excavation. The overburden of the Hyper-Kamiokande is expected to be somewhere between 1900 and 2700 meter-water-equivalent, depending on the actual location of the detector.
With these upgrades in both accelerator () and detector (), the statistics is expected to increase by a factor of 200. The goal of the second phase is
-
•
sin sensitivity below
-
•
CP phase measurement down to 10-20 degrees
-
•
Test of the unitarity triangle in the lepton sector
-
•
Search for Proton decay:
6.1 Discovery potential of CP violation in the lepton sector
If is not observed in the first phase, another order of magnitude improvement in sensitivity to better than will be performed in the second phase (Fig 13). Systematic uncertainty in background subtraction becomes important in the 2nd phase. Enhancement of the signal at the oscillation maximum and capability of measuring the background by the side-band of the oscillation pattern in the reconstructed neutrino energy distribution provide an excellent handle in controlling the systematic uncertainty.
If the large mixing angle solution of the solar neutrino deficit, which is the current favored solution, and if is observed in the first phase, there is a good chance of observing CP violation in the 2nd phase. The CP asymmetry is calculated as
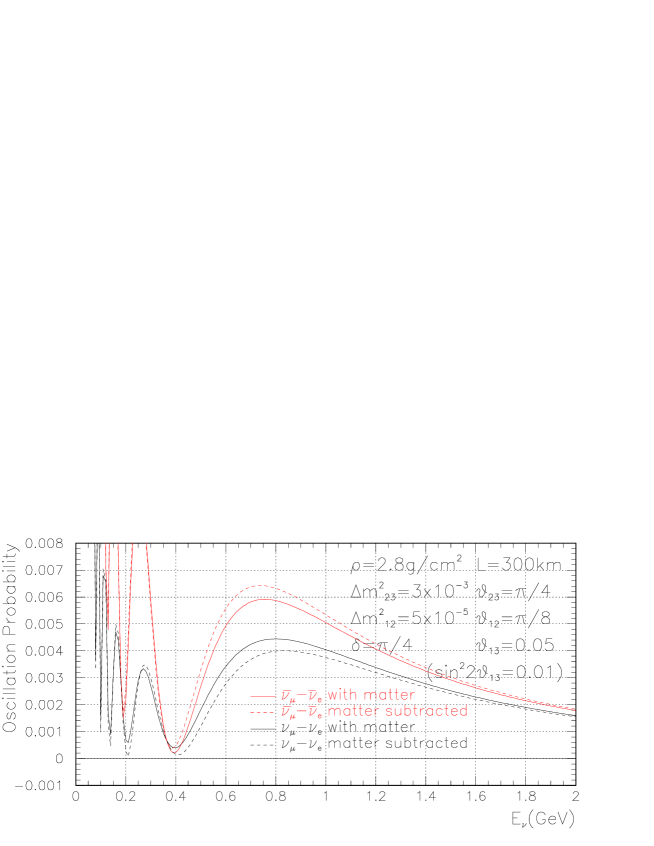
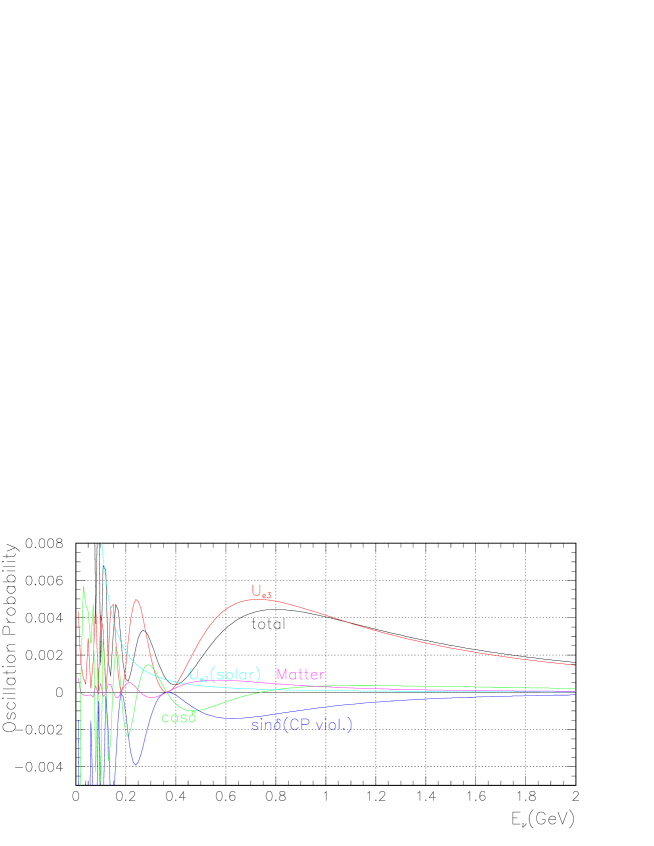
By choosing low energy neutrino beam at the oscillation maximum (E0.75 GeV and L295 km for JHF) the CP asymmetry is enhanced as 1/E. Taking the central value of LMA, namely and , and (1/10 of CHOOZ limit) and (half of the maximum CP effect), becomes as large as 25%. Matter effect, which creates fake CP asymmetry, increases linearly with the neutrino energy. Because of the use of low energy neutrinos, the fake asymmetry due to matter effect is small for the JHF-Kamioka experiment. Figure 17 shows oscillation probabilities for (black) and (red) for the central LMA parameters as discussed above. The solid curves includes asymmetry due to matter effect. For the dashed curves, the matter effect is subtracted and the difference between (black) and (red) are all due to CP effect. The CP asymmetry is as large as 25% and the fake asymmetry due to matter effect is only 5-10% as discussed above.
6.1.1 Sensitivity to CP violation and the unitarity triangle
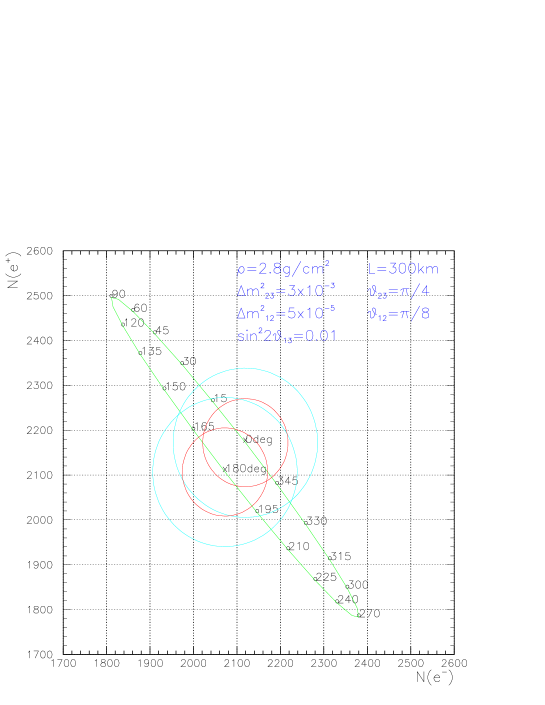
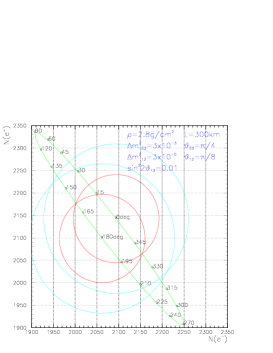

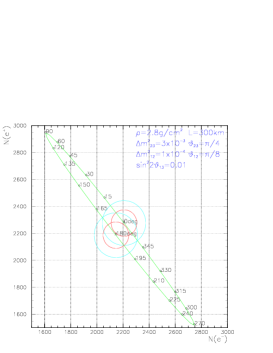
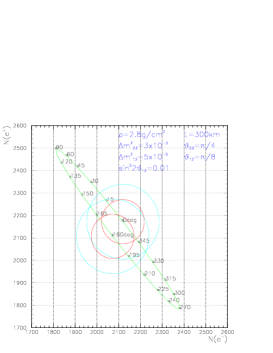
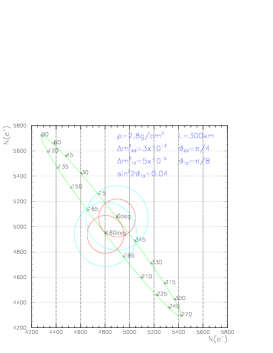
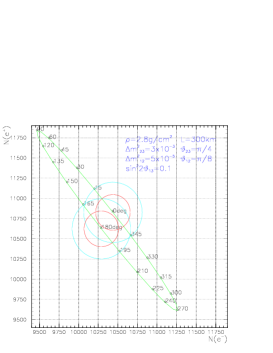
Figure 18 shows the numbers of and appearance events including those from backgrounds after 6 years of and 2 years of running in the 2nd phase of the JHF-Kamioka neutrino experiment. Numbers on the plots indicates CP phase in degrees. CP phase at 0 degrees and 180 degrees correspond to no CP violation. 3 sigma discovery is possible for .
Figure 19 shows the CP sensitivity for , and . Because CP asymmetry () increases linearly with , CP sensitivity goes up linearly with . For small , CP asymmetry increases as , but the statistics are down as . As a result, CP sensitivity does not depend much on the value of (for ) as shown in Figure 20. Figure 21 shows the contributions of each of the terms in appearance for the typical LMA number discussed before. Because contribution of these terms are all significant, each of the components in Eq (11) can be determined by measuring the oscillation pattern of the and appearances.
This oscillation pattern provides 4 independent measurements of the MNS matrix elements and can overconstrain the unitary triangle: [19].
6.2 Sensitivity of proton decay
The existence of the neutrino oscillation indicates the extremely small neutriino masses, which is 12-13 orders of magnitude smaller than the top quark mass. A natural way to explain this hierarchy is Grand Unified theories (with see-saw mechanism), which is also indicated by the running gauge coupling constants. The only known way to directly observe the grand unification phenomenon is a nucleon decay measurement. The main gauge-boson-mediated decay is and the predicted lifetime could be as short as years [20]. For supersymmetric grand unified theories, decay tends to be the main decay mode and its predicted life time is somewhere between years, although this decay mode is highly model dependent. For both of these modes, it is highly desirable to reach the sensitivity of 1035 years and beyond. Current lower limits on partial lifetimes of these two modes from 79 kton-year of Super-Kamiokande data [21] are
where is the proton lifetime and is the branching ratio of the decay mode.
In the following sensitivity study [22], the neutrino interaction simulation and detector simulation used in Super-Kamiokande are used. Figure 22 shows simulated atmospheric neutrino backgrounds for 20 Mtyear exposure. The solid box shows the signal region used in Super-Kamiokande [23]. An estimated number of background events is 45 for 20 Mtyear and it appears that background limits the statistics in the future search and a tighter cut is desired.
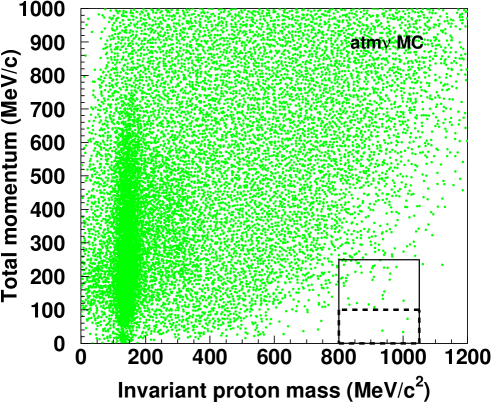
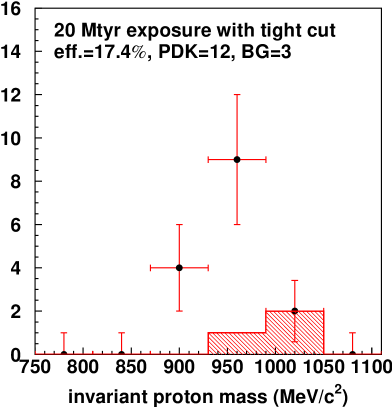
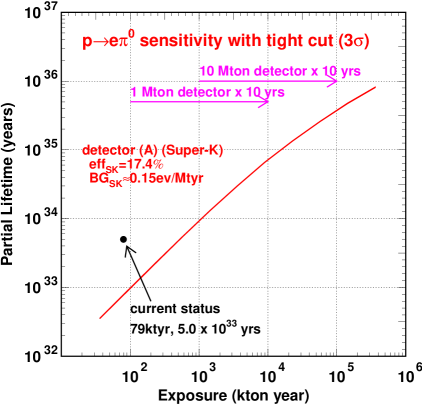
In the water molecule, 2 out of 10 protons are free protons. These free protons have no Fermi motion and thus give sharp proton mass peak in invariant mass distribution (x-axis) and nearly perfect momentum balance (y-axis). The detection efficiency is also higher because of no pion interaction loss in the Oxygen nucleus. The dashed box in the figure represents a tighter selection criterion in momentum balance to select only the free proton decay. The background level is reduced by a factor of 15, or 3 background events/20 Mtyear), whereas the 39% of the signal detection efficiency is maintained. The overall signal detection efficiency is 17.4%. Figure 22(right) shows the expected invariant mass distribution for 20 Mtyear exposure data, assuming a partial lifetime for the proton of years and the tight cut described above. A sharp peak at the proton mass is seen, which would provide a redundant positive evidence of proton decay. Figure 23(left) shows 99.73%(3) discovery sensitivity. With 20 Mtyear exposure, we will reach a sensitivity beyond years.
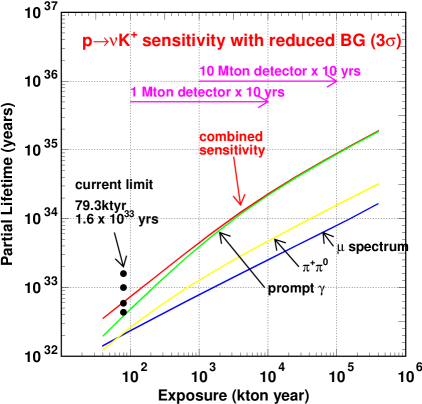
For the search, Super-Kamiokande developed a nearly background free method of detecting from a decay accompanied by a prompt from the residual oxygen nucleus [24]. The backgrounds for this prompt tagging is assumed to come from kaon production by atmospheric neutrinos. Figure 23(right) shows 99.73%(3) discovery sensitivity for the search. With 20 Mtyear exposure, we will reach a sensitivity of years, closing (or opening?) the windows for many of the supersymmetric grand unified theories.
7 Summary
The next generation long baseline neutrino experiment from JHF to Super Kamiokande with a baseline length of 295 km is proposed to explore the physics beyond the Standard Model. The JHF PS is designed to be capable of delivering protons every 3.42 seconds (0.77 MW), which is upgradeable to more than five times greater intensity (4 MW) later. The high intensity neutrino beam is produced with a conventional method. Low energy narrow band beam whose peak energy is tuned to the oscillation maximum of 0.8 GeV is used to maximize the sensitivity on the neutrino oscillation. Super-Kamiokande has very a good energy resolution and excellent particle identification at this low energy. The neutrino energy is reconstructed through quasi-elastic interaction, which is a dominant process for the neutrino energy of below 1 GeV. The experiment will be divided into two phases. The goals for the first phase are precision measurements of oscillation parameters in disappearance, search for appearance, a confirmation of oscillation by detecting neutral current events, and search for sterile neutrinos. The expected precision and reach are estimated by using 1) the neutrino flux and spectrum obtained by the simulation code of neutrino beam production used by the K2K experiment, 2) Super-Kamiokande’s full detector simulator which has been tested in detail over the last 5 years for the atmospheric neutrino observation. The expected precision is , eV2 in disappearance and appearance can be explored down to . In the second phase of the experiment with an upgraded 4 MW PS and 1 Mt Hyper-Kamiokande, appearance can be searched for in the region and CP violation can be observed if in the case of large mixing angle solution of the solar neutrinos. Sensitivity in the proton decay search is significantly improved upto () years in life time for the () mode. The first phase experiment is planned to start in 2007.
References
- [1] Super-Kamiokande collaboration, Phys.Rev.Lett. 81,1562 (1998)
- [2] K2K collaboration, hep-ex/0103001, accepted for publication in Phys. Lett. B.
- [3] Z. Maki, M. Nakagawa, S.Sakata, Prog. Theor. Phys. 28,870 (1962)
- [4] M.Kobayashi, T. Maskawa, Prog. Theor. Phys. 49,652 (1973)
- [5] Y. Fukuda et al., Phys. Rev. Lett. 81, 1562 (1998); K. Kaneyuki, talk presented at 2001 Aspen winter conference on particle physics “PARTICLE PHYSICS AT THE MILLENNIUM”, Jan. 2001.
- [6] The Super-Kamiokande collaboration, hep-ex/0103032, hep-ex/0103033, to appear in Phys. Rev. Lett.
- [7] CHOOZ: Apollonio M. et al., Phys. Lett. B466 (B1999) 415. Palo Verde:F. Boehm et al., Nucl.Phys.Proc.Suppl.91:91-98,2001
- [8] B. Richter, SLAC-PUB-8587 (hep-ph/0008222), 2000 and references there in.
- [9] M. Furusaka, R. Hino, Y. Ikeda et al., “The Joint Project for High-Intensity Proton Accelerators”, KEK Report 99-4; JAERI-Tech 99-056; JHF-99-3 (1999).
- [10] For example, R. Barbieri, P. Creminelli, A. Strumia, Nucl. Phys. B585, 28 (2000).
- [11] L. Hall, H. Murayama, N. Weiner, Phys. Rev. Lett. 84, 2572 (2000)
- [12] S. Geer, Phys. Rev. D57, 6989 (1998)
- [13] For example, Yamanoi Y. et al., KEK Preprint 97-225, November 1997.
- [14] D. Beavis, A. Carroll, I. Chiang, et al., Proposal of BNL AGS E-889 (1995).
- [15] R. Brun et al., CERN DD/EE/84-1 (1987).
- [16] T.A.Gabriel et al., ORNL/TM-11185; C.Zeitnitz and T.A.Gabriel, Nucl. Instr. and Meth. A349, 106 (1994).
- [17] K. Nishikawa, talk presented at KEK-PS review, Dec., 2000; T. Nakaya, talk presented at 2001 Lake Louise Winter Institute, Feb., 2001.
- [18] M. Koshiba, Phys. Rep. 220, 229 (1992); K. Nakamura, talk presented at Int. Workshop on Next Generation Nucleon Decay and Neutrino Detector, 1999, SUNY at Stony Brook; K. Nakamura, Neutrino Oscillations and Their Origin, (Universal Academy Press, Tokyo, 2000), p. 359.
- [19] J. Sato, hep-ph/0008056 (2000).
- [20] W. Marciano, talk presented at UNO proto-collaboration meeting, 2000, Carlsbad, USA.
- [21] M. Shiozawa, talk presented at the 30th Int. Conf. on High Energy Physics (ICHEP2000), 2000, Osaka, Japan.
- [22] M. Shiozawa, Next Generation Nucleon Decay and Neutrino Detector(NNN99) (AIP Conference Proceedings 533, AIP, New York, 2000) p.21; M. Shiozawa, talk presented at Int. Workshop on Next Generation Nucleon Decay and Neutrino Detector, 2000, Fermi National Laboratory, USA.
- [23] M. Shiozawa et al., Phys. Rev. Lett. 81, 3319 (1998).
- [24] Y. Totsuka, 7th Workshop on Grand Unification, ICOBAN ’86, (World Scientific, 1986), p. 118; Y. Hayato et al., Phys. Rev. Lett. 83, 1529 (1999).