Universal fluctuations in the growth of semiconductor thin films
Abstract
Scaling of surface fluctuations of polycrystalline CdTe/Si(100) films grown by hot wall epitaxy are studied. The growth exponent of surface roughness and the dynamic exponent of the auto-correlation function in the mound growth regime agree with the values of the Kardar-Parisi-Zhang (KPZ) class. The scaled distributions of heights, local roughness, and extremal heights show remarkable collapse with those of the KPZ class, giving the first experimental observation of KPZ distributions in dimensions. Deviations from KPZ values in the long-time estimates of dynamic and roughness exponents are explained by spurious effects of multi-peaked coalescing mounds and by effects of grain shapes. Thus, this scheme for investigating universality classes of growing films advances over the simple comparison of scaling exponents.
pacs:
68.43.Hn, 05.40.-a, 68.35.Fx , 81.15.AaNon-equilibrium interface dynamics and kinetic roughening theories are fascinating topics in statistical mechanics due to the emergence of scaling invariance and universality and a wide number of applications barabasi . A paradigm in this field is the Kardar-Parisi-Zhang (KPZ) equation KPZ
| (1) |
which is a hydrodynamic approach to an interface driven by white noise () and subject to linear and nonlinear (slope-dependent) tension mechanisms. A number of applications of the KPZ equation was suggested in the last decades based on the comparison of scaling exponents of surface roughness barabasi . An increased interest in this problem was observed after the exact calculation of the height distribution (HD) of the -dimensional KPZ equation in the growth regime SasaSpo1 and its connection to random matrix theory TW1 (long after the first calculation of the HD of some lattice models in the KPZ class johansson ). These results were confirmed by numerical works SidTiaSil1 and in experiments on fluid convection and colloidal particle deposition TakeSano ; yunker . In dimensions, which is the most interesting case for applications, recent numerical studies of lattice models healy ; SidTiaSil3 showed that the KPZ HD have the same scaling properties of dimensions, with two universal distributions for flat and radial growth. However, the exact solution and the experimental confirmation are still lacking.
Thin film and multilayers form the basis of modern micro and optoelectronic industry ohring . The application of kinetic roughening theory to describe their morphology helps to understand their physical properties and to predict the conditions for growth of novel structures. Here, cadmium teluride thin films are grown on substrates by hot-wall epitaxy and their surface morphology is studied along those lines. is a direct gap semiconductor that, in the form of either bulk crystal, thin films or quantum dots, has widespread use as solar cells, X-ray and detectors, and other optoelectronic devices cdteappl .
A thorough atomic force microscopy (AFM) study of grown films provides very accurate distributions of heights, local roughness, and extremal heights, which, together with global roughness scaling, provide the first experimental confirmation of those KPZ distributions in dimensions. Local roughness exponents are consistently related to the shapes of surface mounds. The nontrivial mound coalescence and coarsening dominated by grains in (111)-direction explains the excess velocity that leads to KPZ scaling. This establishes a robust procedure to understand local and global features of a film surface from existing theories.
Details of the growth procedure of films by hot wall epitaxy can be found in Ref. lowtemp . Prior to film growth, substrates were etched with a 2 HF solution to remove the native oxide layer. The samples were grown from a single high purity solid source, at substrate temperature of . Growth times range from 15 to , with constant rate /s for all samples, corresponding to thickness between and . Surface characterization was performed in air by AFM using a Ntegra Prima SPM in contact mode. Surface topographies of 3 to 8 different regions of each sample were scanned, producing images of areas with pixels. This size was chosen so that morphological properties in domains smaller and larger than the average mound size could be simultaneously investigated.
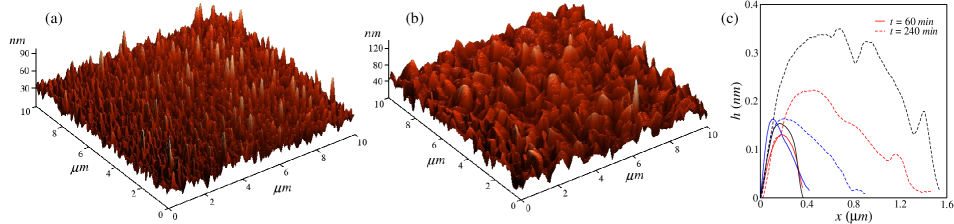
Figures 1a and 1b show typical surface morphologies of films grown for 60 and 240 minutes, respectively. The mounded morphology typical of polycrystalline samples is observed, and the average mound size increases in time. Indeed, it was already shown that grains grow faster than the ones with other crystallographic orientations lowtemp , which tend to be covered. Height profiles of typical grains are shown in Fig. 1c to reveal mound coalescence and change of aspect ratio. For short times, sharp isolated surface structures are found with size , which probably originate from islands formed in submonolayer regime. For long times, the mound basis are 2-4 times larger (close to ), while their heights barely increase by a factor 2, and a multi-peaked shape is observed, which indicates a coalescence mechanism.
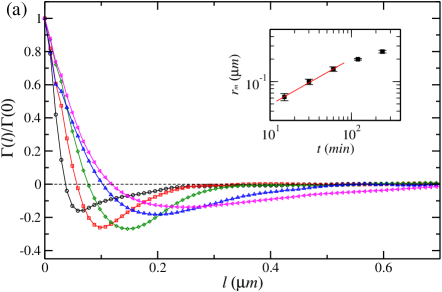
The mound size is estimated from the first minima of the slope-slope correlation function siniscalco , shown in Fig. 2a for several growth times. Those minima () are shown in the inset of Fig. 2a as a function of growth time. For , before mound coalescence (see Fig. 1c), it scales as , with . The lateral correlation length is of the same order of the mound size in this regime, thus is the inverse of the dynamic exponent, , which is in excellent agreement with the KPZ value Marinari . For longer times, the inset of Fig. 2a shows , which is not the size of the multi-peaked mounds in Fig. 1c. Instead, the long-time estimates of represent the size of the original mounds that are constrained upon coalescence, providing a small coarsening exponent in this regime. This value is similar to other systems dominated by surface diffusion etb , but not representative of long lengthscale surface fluctuations.
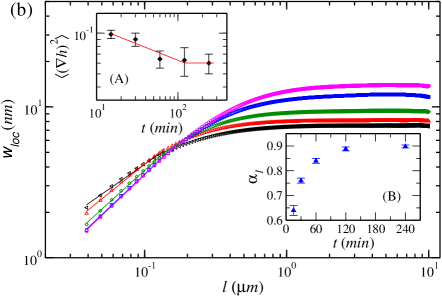
The local roughness of a sample is measured as the average height fluctuation in boxes of lateral size that scan the film surface. Fig. 2b shows as a function of for several growth times. For short times and small sizes , measures the roughness of a single mound surface, which evolves from sharp to rounded shape, respectively with larger and smaller height fluctuation. This leads to the time decrease of , corresponding to a decrease of the local slope, which is shown in the inset (A) of Fig. 2b. For comparison, this is the opposite of systems with anomalous roughening ramasco . In the first few minutes of deposition, island heights rapidly increase because substrate wetting is not energetically favorable (a signature of the initial Volmer-Weber growth mode observed for this system suka ), but the inset (A) of Fig. 2b shows the subsequent regime in which the substrate is fully covered and local slopes relax until saturating, while long wavelength fluctuations ( for large ) increase.
The inset (B) of Fig. 2b shows the initial slope of the curves, which increases in time from () to (). This slope should not be interpreted as a local roughness exponent, which characterizes long wavelength fluctuations. Instead, is measured for , which is smaller than or close to the average mound size tiago3 , thus it characterizes the intragrain surface morphology. The estimates of are fully consistent with the values obtained in grainy surface models of Ref. tiago3 , which vary from for sharply peaked grains (similar to the short time structures of Fig. 1c) to for grains with flat or weakly rounded surfaces (similar to the long time structures of Fig. 1c). Those models also explain the values of reported for growth of on glass Nascimento and on glass covered by fluorine-doped tin oxide Mata .
Now we turn to the analysis of large lengthscale features and distributions, providing striking evidence of KPZ kinetics, which is related to the polycrystalline packing in the growing films.
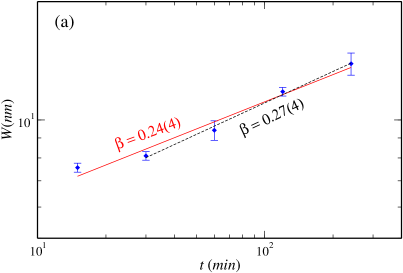
Fig. 3a shows the time increase of the global roughness of the samples, , which is expected to scale as , where is the growth exponent. A linear fit of the data gives , which is in excellent agreement with the KPZ exponent Marinari . The smallest time point in Fig. 3a slightly deviates from the linear fit, probably due to a transient dynamics, commonly observed in KPZ systems tiago3 . However, the growth exponent measured without that data point is , which is still near the KPZ value.
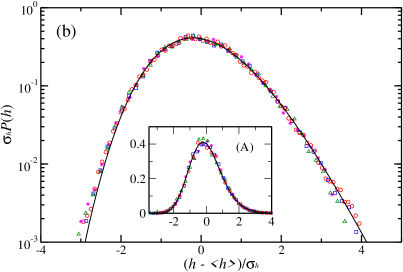
In Fig. 3b, the HDs of four samples at the largest growth time are compared with the Gumbel distribution with parameter gumbel , which was recently shown to fit the (numerically calculated) HD of KPZ in the growth regime of dimensions SidTiaSil3 . The excellent agreement in log-linear and linear-linear plots (see inset of Fig. 3b), is the first experimental confirmation of this KPZ distribution in dimensions. Small deviations between the experimental data and the theoretical curve are only observed for the smallest heights (), indicating an increased density of these deeper regions, which tend to appear between the surface grains.
The visually observed collapse of distributions in Fig. 3b is reinforced by comparing the skewness and kurtosis ( is the cumulant of the fluctuating variable ). For films, we obtain , while numerical simulations of KPZ models give healy ; SidTiaSil3 , but this discrepancy is expected from the enhancement of the experimental left tail, as explained above. Furthermore, the numerical value was obtained in the asymptotic limit and, in general, smaller values are observed in finite times SidTiaSil3 . On the other hand, for the films is in good agreement with the KPZ value healy ; SidTiaSil3 .
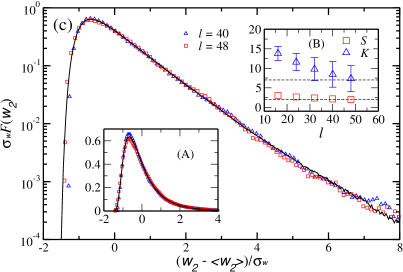
Roughness distributions Foltin ; Antal are known to have much weaker finite-size corrections than scaling exponents and HDs. Using digitalized images of a film surface, the suitable quantity to measure is the squared local roughness distribution (SLRD) Antal in boxes of size much larger than the pixel size and much smaller than the whole image size, so that a large number of microscopic environments can be sampled. Fig. 3c shows the SLRDs of films with two box sizes and of KPZ models in dimensions FabioGR , with an excellent data collapse in three orders of magnitude of . Inset (A) of Fig. 3c confirms the agreement near the SLRD peaks. Inset (B) of Fig. 3c confirms the convergence of the amplitude ratios and to the KPZ values as increases, i. e. approaching a continuous limit. Also note the stretched exponential decay of SLRDs in Fig. 3c, which is the main signature of this KPZ distribution in dimensions FabioGR (in contrast to simple exponential decays of linear growth equations and other Gaussian interface models Antal ).
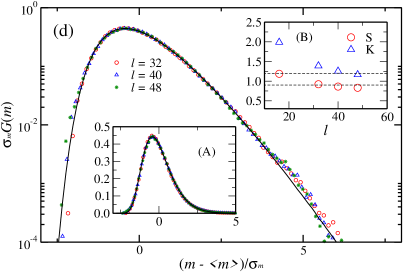
Finally, maximal relative height distributions (MRHDs - ) Raychaudhuri of the films were also measured in several box sizes. They are compared in Fig. 3d with the universal MRHD of the KPZ class in dimensions, again showing excellent agreement in two orders of magnitude. Agreement in the peaks is confirmed in inset (A) and convergence of and to the KPZ values is shown in inset (B) of Fig. 3d.
The importance of comparing distributions is clear if one observes that the scaling exponents obtained here are close to those of diffusion-dominated growth governed by the Villain-Lai-Das Sarma (VLDS) equation, which are , , and . Similar results in Refs. Mata ; Nascimento led to that proposal. However, comparison of HDs, SLRDs, and MRHDs discard the VLDS interpretation; for instance, the SLRD of the VLDS class is Gaussian, in striking contrast to the stretched exponential of films. The simultaneous calculation of exponents and visual inspection of surface features is also essential, since it led to the interpretation of as representative of intragrain features (not a Hurst exponent) and to the connection between the long time exponent and the restricted growth of coalescing mounds. This establishes a reliable procedure to check the universality class of a growing process and, consequently, to interpret its growth dynamics.
Thus, understanding the origin of KPZ scaling is in order. During the growth of films, the morphology of a crystalline grain is not templated by the shapes of the previously formed grains. Instead, that morphology follows from an interplay between intragrain surface energetics (that determine the favorable shape of that grain) and the constraints imposed by the neighborhood. This leads to a complex packing of crystalline grains. A simple illustration is provided by the models of Ref. tiago3 , in which a new cubic grain is firmly attached to the boundary of the grains below it, but does not fill all available space in their neighborhood because its shape is constrained to be cubic. This aggregation mechanism has the same effect of the lateral aggregation in ballistic aggregation barabasi . It generates excess velocity, which is the landmark of KPZ scaling.
In summary, a consistent analysis of the dynamic scaling properties of films grown on substrates is presented, giving the first experimental evidence of the universal KPZ distributions of heights, maximal heights, and roughness in the growth regime in dimensions. The evolution of mound shape determines the local roughness scaling and the non-(111) mound coverage followed by coalescence of (111) mounds provides a scenario similar to typical KPZ models, explaining the excess velocity. Our results also shows that the analysis of distributions is a powerful and essential tool in the study of universality classes of growth processes, which will motivate future works in the field to go beyond the direct comparison of estimated scaling exponents and model results.
Acknowledgements.
The authors acknowledge the support from FAPEMIG, FAPERJ, CAPES and CNPq (Brazilian agencies).References
- (1) A.-L. Barabasi and H. E. Stanley, Fractal Concepts in Surface Growth (Cambridge University Press, Cambridge, England, 1995).
- (2) M. Kardar, G. Parisi, and Y.-C. Zhang, Phys. Rev. Lett. 56, 889 (1986).
- (3) T. Sasamoto and H. Spohn, Phys. Rev. Lett. 104, 230602 (2010); G. Amir, I. Corwin, and J. Quastel, Commun. Pure Appl. Math. 64, 466 (2011); P. Calabrese and P. Le Doussal, Phys. Rev. Lett. 106, 250603 (2011); T. Imamura and T. Sasamoto, Phys. Rev. Lett. 108, 190603 (2012).
- (4) C. A. Tracy and H. Widom, Commun. Math. Phys. 159, 151 (1994).
- (5) K. Johansson, Commun. Math. Phys. 209, 437 (2000); M. Prähofer and H. Spohn, Phys. Rev. Lett. 84, 4882 (2000); ibid Physica A 279, 342 (2000).
- (6) S. G. Alves, T. J. Oliveira and S. C. Ferreira Jr., Europhys. Lett. 96, 48003 (2011); T. J. Oliveira, S. C. Ferreira and S. G. Alves, Phys. Rev. E 85, 010601(R) (2012).
- (7) K. A. Takeuchi, M. Sano, Phys. Rev. Lett. 104, 230601 (2010); K. A. Takeuchi, M. Sano, T. Sasamoto and H. Spohn, Sci. Rep. 1, 34 (2011).
- (8) P. J. Yunker, M. A. Lohr, T. Still, A. Borodin, D. J. Durian, and A. G. Yodh, Phys. Rev. Lett. 110, 035501 (2013).
- (9) T. Halpin-Healy, Phys. Rev. Lett. 109, 170602 (2012).
- (10) T. J. Oliveira, S. G. Alves and S. C. Ferreira, Phys. Rev. E 87, 040102(R) (2013).
- (11) M. Ohring, Materials Science of Thin Films - Deposition and Structure, 2nd. ed., Academic Press, 2001.
- (12) T. M. Razykov, C. S. Ferekides, D. Morel, E. Stefanakos, H. S. Ullal and H. M. Upadhyaya, Solar Energy 85, 1580 (2011); M. Niraula et al., IEEE Trans. on Nuclear Science 56, 836 (2009); M. Saba et al., Nature 414, 731 (2001).
- (13) I. R. B. Ribeiro, J. Suela, J. E. Oliveira, S. O. Ferreira and P. Motisuke, J. Phys. D: Appl. Phys. 40, 4610 (2007).
- (14) D. Siniscalco, M. Edely, J.-F. Bardeau, and N. Delorme, Langmuir 29, 717 (2013).
- (15) J. W. Evans, P. A. Thiel, and M. C. Bartelt, Surf. Sci. Rep. 61, 1 (2006).
- (16) J. Villain, J. Phys. I 1, 19 (1991); Z.-W. Lai and S. Das Sarma, Phys. Rev. Lett. 66, 2348 (1991).
- (17) J. J. Ramasco, J. M. López, and M. A. Rodríguez, Phys. Rev. Lett. 84, 2199 (2000).
- (18) S. O. Ferreira, E. C. Paiva, G. N. Fontes and B. R. A. Neves, J. Appl. Phys. 93, 1195 (2003).
- (19) T. J. Oliveira and F. D. A. A. Reis, J. Appl. Phys. 101, 063507 (2007); T. J. Oliveira and F. D. A. Aarao Reis, Phys. Rev. E 83, 041608 (2011).
- (20) F. S. Nascimento, S. C. Ferreira, S. O. Ferreira, Europhy. Lett. 94, 68002 (2011).
- (21) A. S. Mata, S. C. Ferreira, I. R. B. Ribeiro, S. O. Ferreira, Phys. Rev. B 78, 115305 (2008).
- (22) E. Marinari, A. Pagnani, G. Parisi, J. Phys. A 33, 8181 (2000).
- (23) E. J. Gumbel, Statistics of Extremes (Columbia University, New York, 1958).
- (24) G. Foltin, K. Oerding, Z. Rácz, R. L. Workman, and R. K. P. Zia, Phys. Rev. E 50, R639 (1994).
- (25) T. Antal, M. Droz, G. Györgyi, and Z. Rácz, Phys. Rev. E 65, 046140 (2002).
- (26) T. Paiva and F. D. A. Aarão Reis, Surf. Sci. 601, 419 (2007).
- (27) S. Raychaudhuri, M. Cranston, C. Przybyla, and Y. Shapir, Phys. Rev. Lett. 87, 136101 (2001); S. N. Majumdar and A. Comtet, Phys. Rev. Lett. 92, 225501 (2004); G. Györgyi, P. C. W. Holdsworth, B. Portelli, and Z. Rácz, Phys. Rev. E 68, 056116 (2003); D.-S. Lee, Phys. Rev. Lett. 95, 150601 (2005).