Missing bright red giants in the Galactic center: A fingerprint of its once active state?
Abstract
In the Galactic center nuclear star cluster, bright late-type stars exhibit a flat or even a decreasing surface-brightness profile, while fainter late-type stars maintain a cusp-like profile. Historically, the lack of red giants in the Galactic center was discovered via the drop in the strength of the CO absorption bandhead by Kris Sellgren et al. (1990), later followed by the stellar number counts based on the high angular resolution near-infrared observations. Several mechanisms were put forward that could have led to the preferential depletion of bright red giants: star-star collisions, tidal stripping, star-accretion disc collisions, or an infall of a massive cluster or a secondary black hole. Here we propose a novel scenario for the bright red-giant depletion based on the collisions between red giants and the nuclear jet, which was likely active in the Galactic center a few million years ago and could have led to the formation of the large-scale -ray Fermi bubbles. The process of the jet-induced ablation of red giants appears to be most efficient within (S-cluster), while at larger distances it was complemented by star–accretion disc collisions and at smaller scales, tidal stripping operated. These three mechanisms likely operated simultaneously and created an apparent core of late-type stars within .
keywords:
Galaxy: center — stars: supergiants — galaxies: jets — stars: kinematics and dynamics1 Introduction
The analysis of the intergrated diffuse starlight at of the Galactic center region within revealed a drop in the CO absorption bandhead strength inside (Sellgren et al., 1990). Since CO molecules are present in the extended atmospheres of late-type stars, this discovery indicated the missing red-giant problem. Later on, with the development of the adaptive optics technology, individual sources were detected, initially up to magnitude 16 in the -band, now even up to magnitude 19. This allowed to construct surface-density distributions of late-type and early-type stars. Buchholz et al. (2009) found that late-type stars have a flat surface-density distribution, while young OB stars have a cusp-like distribution in the same region. Recently, Gallego-Cano et al. (2018) studied the surface density distribution of late-type stars up to the observed magnitudes of mag. They recovered the previous findings of the core-like distribution for giant late-type stars in the range mag, while the faint stars with mag exhibit a single power-law 3D distribution with the slope of (the surface density slope is ). Gallego-Cano et al. (2018) estimate that bright giants could be missing within the projected distance of . An independent analysis by Habibi et al. (2019) confirms these findings. They can also recover a single power-law surface-density distribution (“cusp”) of faint giants ( mag) with the projected power-law index of , while they estimate that about 4-5 bright giants appear to be missing within the S-cluster region (). In addition, they constrain the least and the most extended atmospheres of late-type stars in the range between and located within .
By constructing the -band luminosity function (KLF) of late-type stars and by fitting theoretical luminosity functions to it, Schödel et al. (2020) inferred that of the stellar mass of the Nuclear Star Cluster (NSC) formed 10 Gyr or earlier. This episode was followed by a quiescent phase, and another formed 5 Gyr ago. The remaining few percent could have formed within the last 100 Myr. This implies that the star-formation in the NSC is rather episodic (Pfuhl et al., 2011) and most of the stellar mass is old.
In the Galactic center, the two-body relaxation time is of the order of ,
| (1) |
where we considered the Coulomb logarithm of the order of 10 and the stellar mass density estimate of is based on the enclosed mass as determined by Schödel et al. (2009). The relaxation time could further be shortened by a factor of at least 10 due to the presence of massive perturbers (Perets et al., 2007). Given that is comparable or even shorter than the formation time of most of late-type stars, the late-type NSC is expected to be relaxed and its 3D number density should follow a single power-law profile similar to the theoretical Bahcall-Wolf cusp ( for unequal stellar masses according to Bahcall and Wolf, 1977 and for stellar black holes; see also Alexander, 2005, 2017, for reviews). Schödel et al. (2020) confirm in their analysis that late-type stars in all magnitude bins follow a single power-law surface-density profile, except for the brightest stars with the observed K-band magnitude in the range of mag, which exhibit a flat to a decreasing surface-density profile that can be described by a broken power law.
To explain this apparent paradox of missing bright red giants, several mechanisms have been proposed based on their preferential effect on bigger stars with more extended, loosely-bound envelopes. Below we list the main proposed mechanisms:
- •
- •
- •
- •
-
•
central luminosity source as a source of ionizing radiation (Sellgren et al., 1990).
In the following, we present a novel scenario reminiscent of the last scenario that includes a central luminosity source that photoionizes molecular content in the large envelopes of red giants, including the CO molecule (Sellgren et al., 1990). However, instead of photoionization, we focus on the possibility of the mechanical ablation of large red-giant atmospheres by a nuclear jet, which could have been significantly more active in the Galactic center a few million years ago. The observed -ray Fermi (Su et al., 2010) and radio bubbles (Heywood et al., 2019) as well as the X-ray chimneys (Ponti et al., 2019) and optical ionization cones (Bland-Hawthorn et al., 2019) could be its fingerprints. We describe the model and analyze its consequences in detail in Zajaček et al. (2020). In this contribution, we summarize the main concepts and subsequently, we compare different scenarios of the red giant depletion and how they can complement each other on different spatial scales from Sgr A*.
2 Model description
The basic assumption in our model is the active jet phase of Sgr A*. Recently, multiwavelength evidence has been accumulated for the presence of bipolar cones – these include -ray Fermi bubbles (Su et al., 2010), radio bubbles (Heywood et al., 2019), X-ray chimneys (Ponti et al., 2019), and optical large-scale ionization cones (Bland-Hawthorn et al., 2019). Their overall energy content appears to be consistent with the active jet and/or the nuclear disc outflows with the kinetic luminosity of (Miller and Bregman, 2016). On the other hand, a nuclear starburst appears to be inconsistent with the bubble energetics by about a factor of 100 (Bland-Hawthorn and Cohen, 2003; Bland-Hawthorn et al., 2019). Guo and Mathews (2012) simulated the formation of the Fermi bubbles by an active jet and the basic energetics and properties could be explained by the jet duration of . Taking into account the total energy content of ionization cones of (Bland-Hawthorn et al., 2019), the jet kinetic luminosity can be estimated as . This is in agreement with the upper limit given by the Eddington luminosity of Sgr A*,
| (2) |
The active jet during the Galactic center Seyfert phase was dominated by the kinetic pressure (Guo and Mathews, 2012). The kinetic luminosity can be estimated using the conversion efficiency as , where is the bolometric accretion luminosity. Since for most radio galaxies (Ito et al., 2008), this yields the upper limit of . In the following, we explore the jet-star interaction for , where the lower limit was estimated for the current quiescent phase of Sgr A* (Yusef-Zadeh et al., 2012).
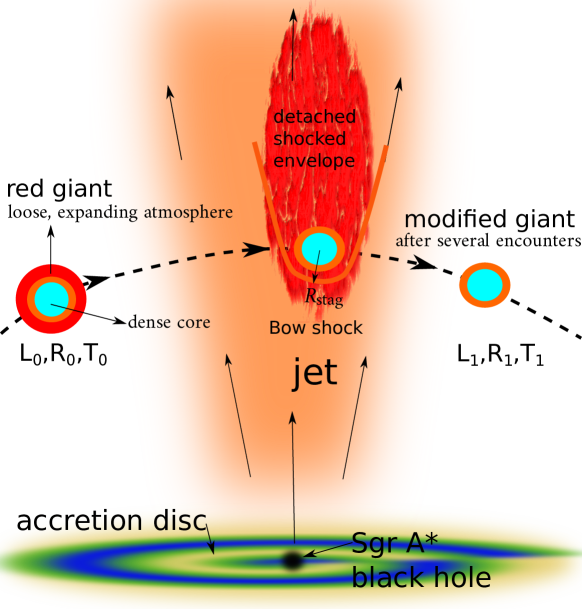
During the Seyfert phase of Sgr A* that occurred Myr ago (Bland-Hawthorn et al., 2019), most of the NSC late-type stars were certainly present since 80% of the stellar mass formed at least 10 Gyr ago (Schödel et al., 2020). Given this setup, it is straightforward to invoke a scenario where red giants, supergiants, and asymptotic giant-branch stars cross the jet. This scenario was studied extensively in relation to the non-thermal emission of jetted active galactic nuclei (AGN; see e.g. Barkov et al., 2010, 2012; Araudo et al., 2013; Perucho et al., 2017). Here we focus instead on the expected impact of the repetitive jet-star interactions on the visual appearance of red giants, mainly in the near-infrared domain, see Fig. 1 for illustration. Even in the current quiescent state of Sgr A*, there is evidence for the interaction of wind-blowing stellar objects with the ambient wind or even a low surface-brightness jet (Yusef-Zadeh et al., 2020). Clear examples are comet-shaped sources X3, X7 (Mužić et al., 2010), and the bow-shock source X8 (Peißker et al., 2019) located in the so-called mini-cavity.
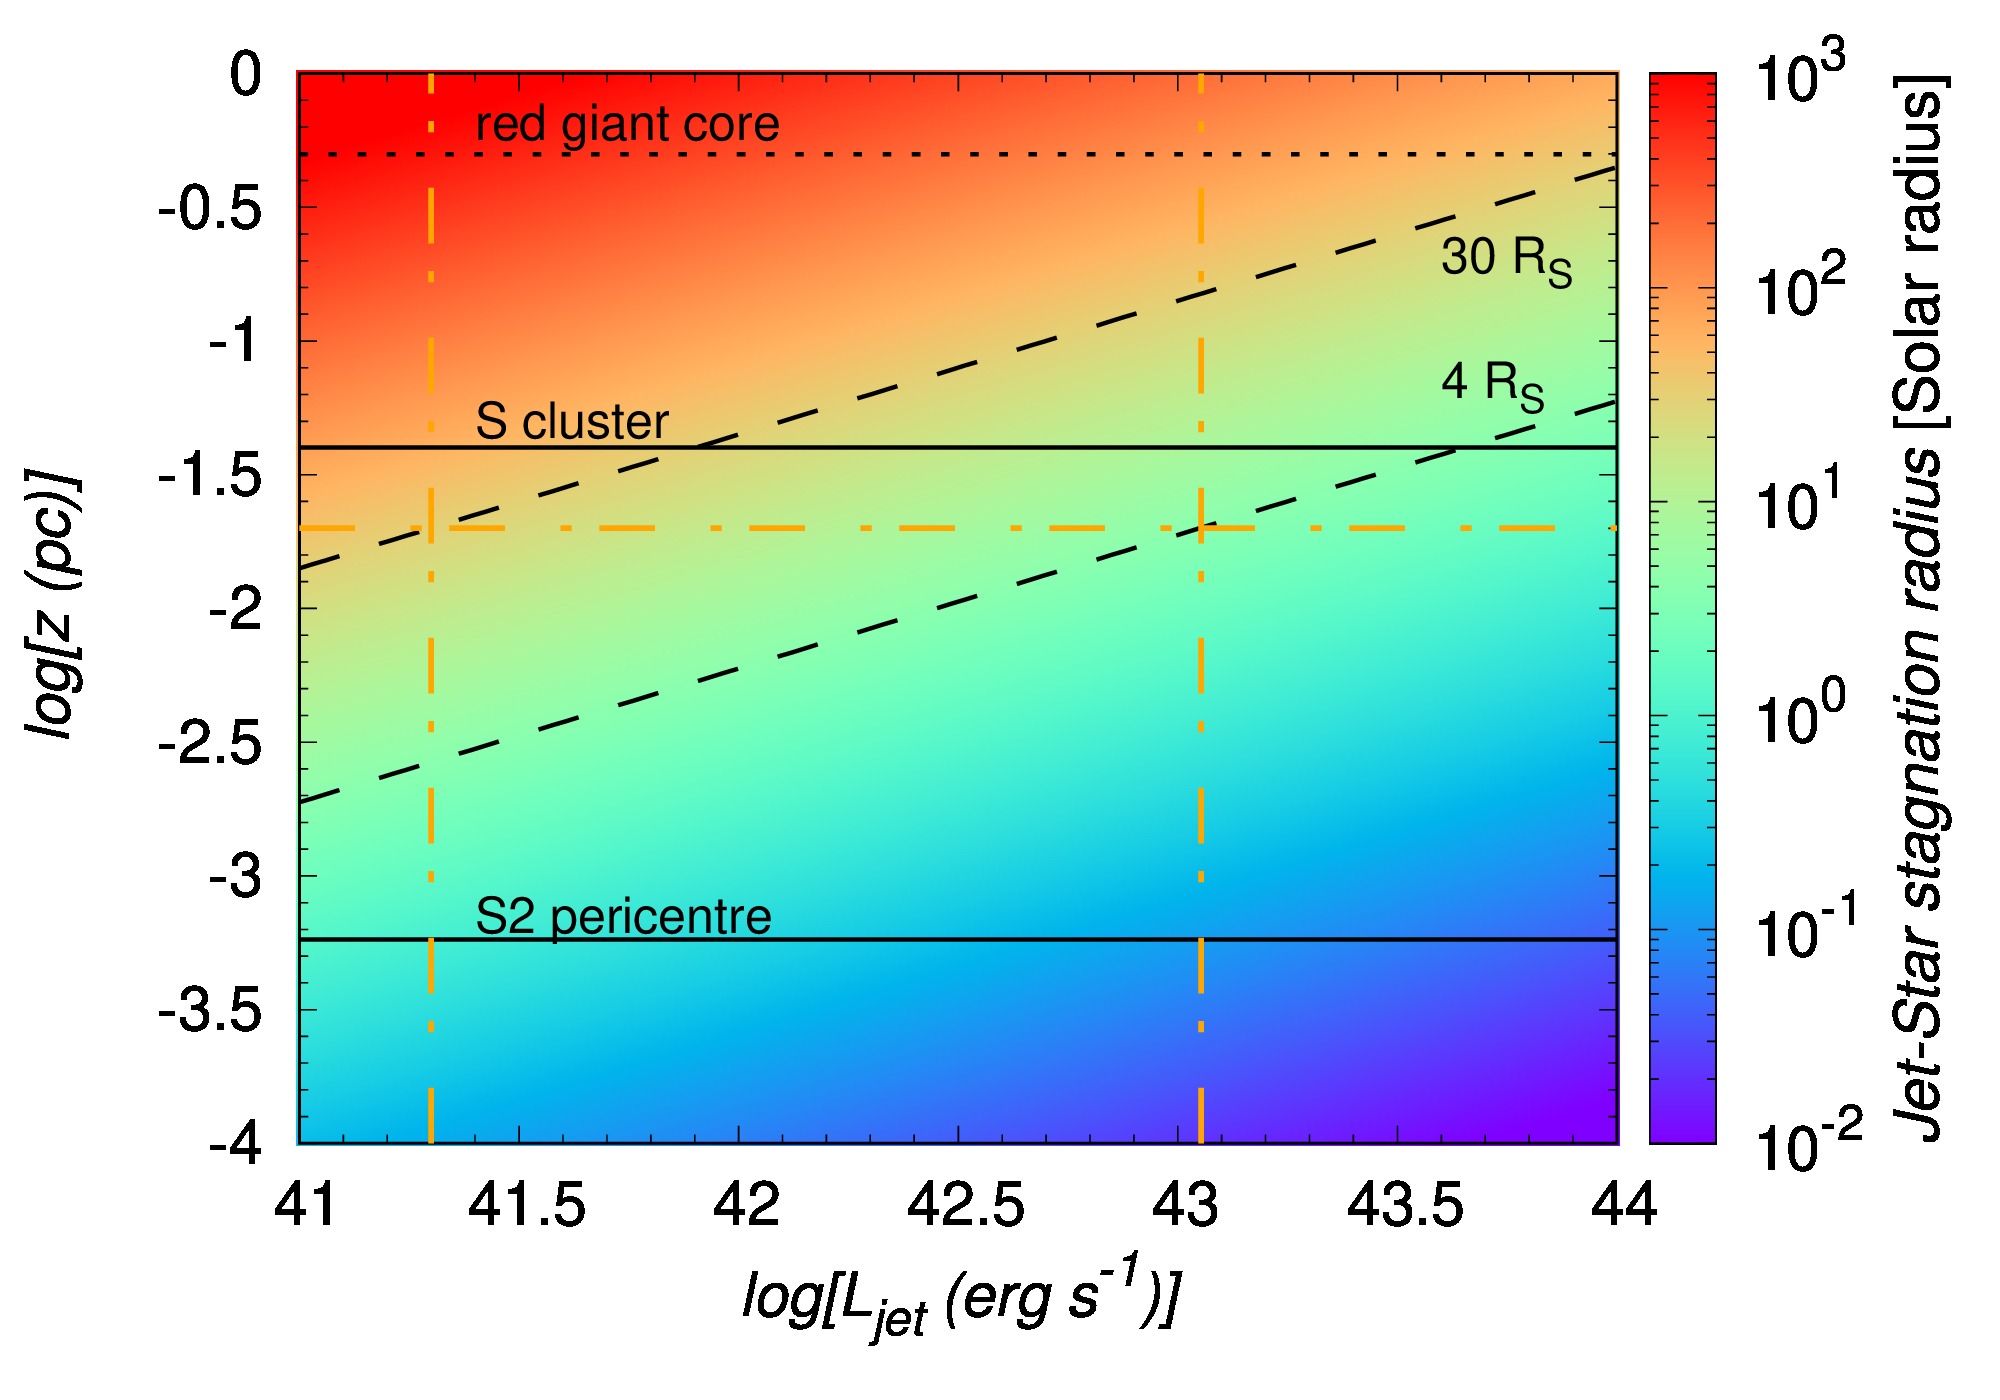
The basic length-scale that determines where the red-giant envelope is truncated is given by the stagnation radius , where the stellar-wind pressure is comparable to the jet kinetic pressure , which leads to
| (3) |
where is the distance of the star from Sgr A*, is the stellar mass-loss rate, is the terminal stellar-wind velocity. The half-opening angle is set to (see Li et al., 2013, for the opening angle estimate for Sgr A*). The stellar parameters – and – are scaled to the typical values for red giants (Reimers, 1987). According to Eq. (3), the typical stagnation radius in the S cluster region () is comparable to the largest atmosphere radius of inferred by Habibi et al. (2019). In Fig. 2, we plot the stagnation radius in Solar radii with respect to the expected jet luminosity and the distance from Sgr A* (in parsecs). Within the S cluster, the stagnation radius can reach 30 up to a few Solar radii only, depending on the exact location and the jet luminosity. These values of generally reach below the atmosphere of larger red giants.
The number of encounters between the jet and the red giant is expected to be at least of the order of 1000 since the orbital timescale is much smaller than . Once a red giant enters the jet, it will continue to cross it during subsequent orbits during the jet lifetime. In principle, the vector resonant relaxation and/or the jet precession could cause that the interaction halts. For the following estimates, we assume that these processes take place on longer timescales than the jet lifetime (see also Zajaček et al., 2020, for a detailed discussion of these effects). The number of red giant–jet encounters is then approximately,
| (4) |
Within the S cluster, the number of encounters reaches at the S2 pericentre () and goes down to at . These estimates represent upper limits since during the jet existence the vector resonant relaxation operates that changes the orbital inclination and the star may leave the collisional orbit before the jet ceases its activity. In addition, the same can occur due to the potential jet precession (caused by a secondary black hole or the Lense-Thirring effect) that can change the jet direction on the timescales of tens of years for some sources, such as OJ287 (Britzen et al., 2018).
During one encounter, the mass removal from the red giant of radius can be estimated from the balance of jet kinetic force and the gravitational force acting on the shell to be removed, , from which follows,
| (5) |
The mass removed during encounters can be estimated simply as , which yields,
| (6) |
Since 80% of the stellar mass formed 10 Gyrs or more ago, red giants in the NSC are expected to have gone through several AGN-like phases. Typical AGN phases are short, of the order of years, while the total growth time of the SMBHs is between and years (Schawinski et al., 2015). This implies at least AGN-like events during the Galaxy lifetime. The total removed mass during all active phases then is, , which makes the numerical estimate in Eq. (6) larger by at least two orders of magnitude.
The mass removal from red giants estimated by Eqs. (5)-(6) and the associated impulse can also effect the orbit of late-type stars. The effect of one encounter is typically negligible, but the cumulative effect of several thousand crossings through the jet can noticeably change the dynamics of the largest red giants. This is, however, beyond the scope of the current contribution and the effect will be studied in detail in our future studies.
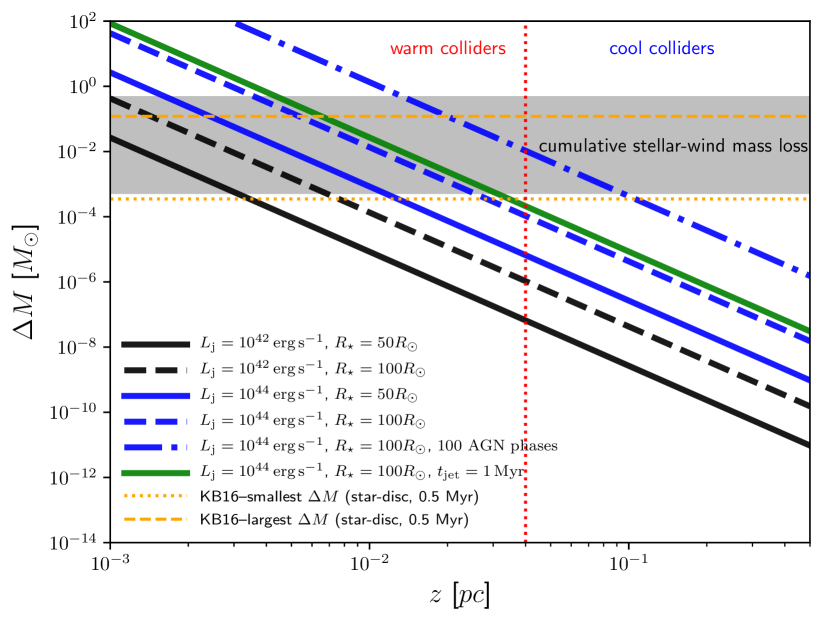
We plot the distance profiles of the removed mass from red giants for different jet luminosities ( and ) and atmosphere radii ( and ) in Fig. 3. In addition, we also include the profile for the longer duration of the jet activity (; solid green line) as well as the cumulative mass removal for red giants going through 100 AGN phases (dash-dotted blue line). For comparison, we also show the cumulative mass removal during star–disc interactions according to Kieffer and Bogdanović (2016) (dashed and dotted horizontal orange lines) assuming that the star-disc mass removal is constant throughout the studied distance range. However, star-disc interactions are expected to remove the mass more efficiently at larger distance scales where the gaseous disc was denser and the Toomre’s stability criterion plunged below one because of a larger surface density of the disc. On the other hand, the jet-star interactions are clearly the most efficient in removing the atmosphere mass within the S cluster, where the cumulative mass removal is comparable to the one resulting from standard red-giant stellar winds (shaded gray rectangle) as well as the mass removed during star-disc interactions. This is also enhanced by another effect, which is related to the thermal Kelvin-Helmholtz timescale. In Zajaček et al. (2020) we showed that approximately within the S cluster, colliding red giants were not able to cool off before the subsequent collision, which resulted in larger atmosphere cross-sections and hence larger removed mass (warm colliders). Outside the S cluster (), stars were able to cool off because of longer orbital timescales (cool colliders) and their collisional cross-sections were smaller and therefore also the jet-ablation was further reduced by this effect.
Concerning the probability of an encounter between red giants and the jet with a half-opening angle , it is clear that for a spherical stellar cluster, not all the stars will interact with the jet at a given moment. In Zajaček et al. (2020), we derive an analytical formula for the mean number of encounters per orbital period in the region with an outer radius ,
| (7) |
where , , and are the parameters describing 3D number density of late-type stars in the power-law form, . For the values inferred by Gallego-Cano et al. (2018), , , and , we obtain within and within , which is within uncertainties consistent with the number of missing bright giants at these scales (Gallego-Cano et al., 2018; Habibi et al., 2019). Moreover, the number of encounters given by Eq. (7) is a lower limit as the various dynamical processes (resonant relaxation, jet precession) can effectively increase the interaction volume during the jet lifetime.
3 Results: Simulated surface-density profiles
The Galactic center stellar population can only be studied in detail in the near-infrared domain, mainly in the -band at (see e.g. Schödel et al., 2014). As the red giant crosses the jet several times, see Fig. 1, its radius will shrink from to , but its bolometric luminosity will stay constant as it depends on the core mass (Paczyński, 1970; Refsdal and Weigert, 1971), which is not affected. This gives us the basic scaling for the effective temperature after the jet-red giant interactions,
| (8) |
The infrared luminosity will decrease with the decrease in the radius. This can be shown by taking the Rayleigh-Jeans approximation, though very crude in the infrared domain, from which . The ratio between the post- and the pre-collision infrared luminosity can then be expressed as,
| (9) |
For illustration of the effect, let us consider the red giant with an initial atmosphere radius of that is ablated down to after several thousand crossings through the jet. From Eq. (8), the effective temperature will increase to , while the infrared luminosity will decrease to according to Eq. (9) or the magnitude will increase by mag. For an even more profound transition from to , the post-collision values are expected to be , , and the magnitude increase is mag. These changes can already significantly influence stellar counts in individual magnitude bins.
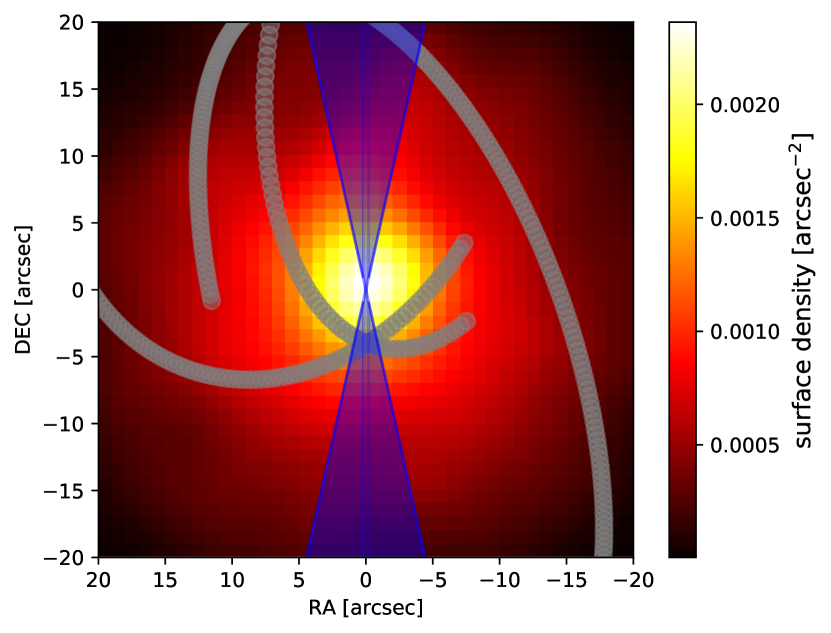
To better evaluate how the red giant–jet interactions could have affected the surface-density profiles of late-type stars in individual near-infrared magnitude bins, we perform a Monte Carlo simulation by generating a mock NSC. The NSC is assumed to be spherical and described by the volume number density of with , , and according to Gallego-Cano et al. (2018). This number density profile implies the presence of late-type stars inside one parsec, whose properties were generated using the Monte Carlo approach. The surface density distribution of such a cluster is depicted in Fig. 4 including the jet with a half-opening angle of and the three minispiral streamers as currently observed are also plotted for a better orientation.
Each star was assigned a mass in the range between and according to the Kroupa initial mass function (IMF; Kroupa, 2001). The Chabrier/Kroupa IMF seems to be consistent with the IMF of the Galactic center late-type stellar population (Pfuhl et al., 2011). Subsequently, we also assigned the core mass to each star. For the purposes of our analysis, we fixed the core-mass fraction to , which lies between the value derived from the Schönberg-Chandrasekhar limit and the values expected from the last phase of the stellar evolution, when the white-dwarf core constitutes most of the mass of solar-type stars.
To calculate the magnitude distribution in the near-infrared -band, we followed this procedure,
-
1.
We calculate the bolometric stellar luminosity and the stellar radius as a function of the core mass, and , according to Eq. (19) in Zajaček et al. (2020).
-
2.
When the jet is active, we compare of the entering star with calculated using Eq. (3). When , we set . For this analysis, we assumed that almost all late-type stars within could have interacted with the jet for at least several hundred times. This would be possible when the vector resonant-relaxation timescale is shorter than the jet lifetime or the jet would be precessing.
-
3.
The effective temperature is calculated as .
-
4.
From the Planck function , we calculate the flux density at -band, , where is the distance to the Galactic center. The intrinsic (dereddened) apparent magnitude is then calculated as .
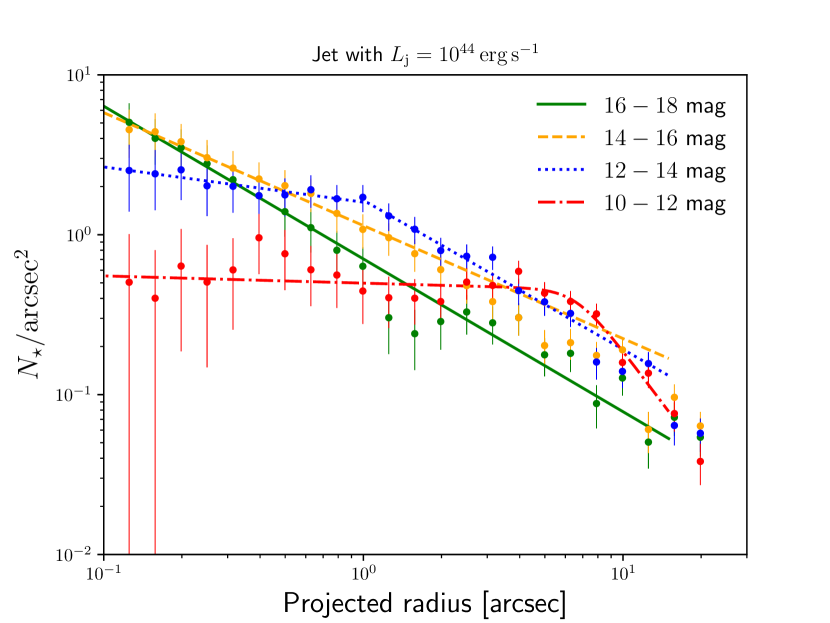
In the next step, to estimate the surface-density distributions, we count the number of stars in the concentric annuli with the mean radius and the width , from which we estimate the surface density as with the uncertainty of . Then we bin the stars into two-magnitude bins, starting at 18 mag and going down to the brightest stars with 10 mag. Initially, without any jet influence, the surface density distribution across all magnitude bins could be described as a single power-law described as , hence as a proper cusp, see Table 1. When the jet is switched on with the kinetic luminosity of , the surface-density profile of the brightest giants (10-12 mag, dereddened) becomes flat up to , see Fig. 5. The flattening inside is also apparent for late-type stars in the 12-14 mag bin (dereddened), while fainter stars with larger magnitudes maintain a cusp-like distribution as the most recent observational studies indicate (Gallego-Cano et al., 2018; Habibi et al., 2019; Schödel et al., 2020). The surface-density distribution of bright late-type stars can be fitted by a broken power-law function in the form , where is the break radius, is the slope of the inner cluster part inside , is the slope of the outer cluster part, and describes the sharpness of transition. For both the case without any jet and the case with the jet kinetic luminosity of , we summarize the slopes and the break radii of the fitted power-law functions in Table 1 for individual magnitude bins.
| Magnitude bin | No jet activity | Jet |
|---|---|---|
| 18-16 mag | single: | single: |
| 16-14 mag | single: | single: |
| 14-12 mag | single: | broken: , , |
| 12-10 mag | single: | broken: , , |
4 Discussion and Conclusions
We presented a novel scenario based on the red giant–nuclear jet interactions to explain the peculiarities of the Milky Way Nuclear Star Cluster – on one hand, the cusp-like distribution of faint late-type stars, which is expected from the two-body relaxation, and on the other hand, the core-like distribution of bright red giants, which requires a mechanism that preferentially acts on stars with more extended atmospheres. The interaction of red giants with the nuclear jet during active phases of Sgr A* can naturally explain the observed surface-density features since the jet removes the envelopes of more extended red giants more efficiently from basic principles. The repetitive mechanical removal of the atmosphere material also ensures that the resulting effect on the late-type star is permanent – its effective temperature will increase, its mass will decrease, and the infrared luminosity will drop. This is an advantage of this model in comparison with the central luminosity source proposed by Sellgren et al. (1990), since after the source luminosity drops, the CO molecule could form again in the extended atmosphere because of the lowered ionizing potential.
In addition, we showed that the jet–red giant interactions are the most efficient in removing the mass inside or the S cluster region, where the removed mass by the jet ablation is comparable to the cumulative mass loss from stellar winds. Hence, the overall mass loss can effectively be doubled in comparison with the standard stellar evolution during the jet existence. The mass removal in the S cluster could also be enhanced by the fact that red giants are expected to be warm colliders in this region, i.e. stars that are not able to cool off before the subsequent collision with the jet. Therefore their envelopes are more puffed up, which increases the collisional cross-sections and the overall mass loss. For bright giants with atmosphere radii of the order of , the increase in the near-infrared magnitude is expected to be mag, which leads to the flattening of their surface-density profile, while they can turn into fainter gaints in the near-infrared after the ablation and make their profiles even more cuspy.
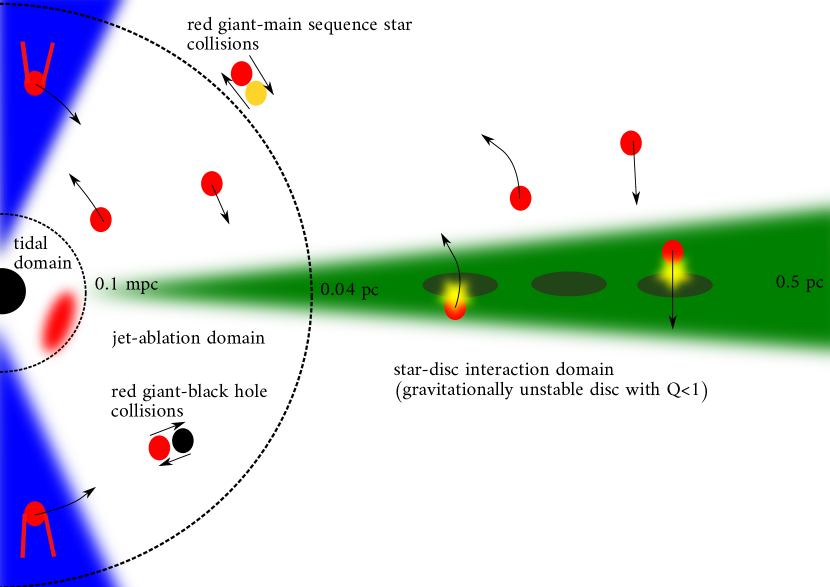
Outside the S cluster, the efficiency of jet–red giant interactions in terms of the mass removal drops in comparison with star-disc collisions. Therefore, the star-disc collisions likely complemented jet–red giant interactions at larger scales, where the massive gaseous disk fragmented into star-forming clumps with significantly increased density (Levin and Beloborodov, 2003; Milosavljević and Loeb, 2004). On the other hand, at much smaller scales of a fraction of a milliparsec, tidal stripping of envelopes operated. Throughout the NSC, occasional collisions of large red giants with stellar black holes and main-sequence stars could partially have contributed to the depletion, but they cannot alone explain the missing brightest giants (Dale et al., 2009). We illustrate all of these mechanisms and the regions of their largest efficiency in Fig. 6. They likely all contributed to the observed dearth of bright red giants in the inner .
A limitation of our model is that only a fraction of late-type stars that at a given time cross the jet will suffer the mass removal because of the narrow opening angle of the jet. A wide-angle outflow, e.g. resulting from the accretion disc winds, with a half-opening angle , with , could hit more stars. However, this is at the cost of enlarging the stagnation radius by and diminishing the mass removal by . Hence, a highly-collimated jet is required for the mechanism to work efficiently enough to create an apparent core in the surface-density distribution. Moreover, discussed dynamical processes, such as the coherent resonant relaxation and the jet precession, can considerably enlarge the interaction volume during the active jet phase. Since there are at least such phases during the Galaxy lifetime, the total number of affected giants is consistent with the number of missing large giants.
We would like to thank the organizers of RAGtime 22 (dedicated to Prof. Zdeněk StuchlÃk) for the smooth and efficient performance of the conference in the online space during the COVID19 pandemic. MZ thanks Robert “Ski" Antonucci (UC Santa Barbara) for input and useful comments. MZ and BC acknowledge the financial support by the National Science Center, Poland, grant No. 2017/26/A/ST9/00756 (Maestro 9). VK thanks MŠMT grant LTI 17018 for support. We are also grateful to the Czech-Polish mobility program (MŠMT 8J20PL037) for support. In addition, MZ also acknowledges the NAWA financial support under the agreement PPN/WYM/2019/1/00064 to perform a three-month exchange stay at the Astronomical Institute of the Czech Academy of Sciences in Prague. VW was supported by European Unionâs Horizon 2020 research and innovation programme under grant agreement No 894881.
References
- Alexander (2005) Alexander, T. (2005), Stellar processes near the massive black hole in the Galactic center [review article], Phys. Rep., 419(2-3), pp. 65–142, astro-ph/0508106.
- Alexander (2017) Alexander, T. (2017), Stellar Dynamics and Stellar Phenomena Near a Massive Black Hole, ARA&A, 55(1), pp. 17–57, 1701.04762.
- Amaro-Seoane and Chen (2014) Amaro-Seoane, P. and Chen, X. (2014), The Fragmenting Past of the Disk at the Galactic Center: The Culprit for the Missing Red Giants, ApJ, 781(1), L18, 1310.0458.
- Amaro-Seoane et al. (2020) Amaro-Seoane, P., Chen, X., Schödel, R. and Casanellas, J. (2020), Making bright giants invisible at the Galactic Centre, MNRAS, 492(1), pp. 250–255, 1910.04774.
- Antonini et al. (2012) Antonini, F., Capuzzo-Dolcetta, R., Mastrobuono-Battisti, A. and Merritt, D. (2012), Dissipationless Formation and Evolution of the Milky Way Nuclear Star Cluster, ApJ, 750(2), 111, 1110.5937.
- Araudo et al. (2013) Araudo, A. T., Bosch-Ramon, V. and Romero, G. E. (2013), Gamma-ray emission from massive stars interacting with active galactic nuclei jets, MNRAS, 436(4), pp. 3626–3639, 1309.7114.
- Armitage et al. (1996) Armitage, P. J., Zurek, W. H. and Davies, M. B. (1996), Red Giant–Disk Encounters: Food for Quasars?, ApJ, 470, p. 237, astro-ph/9605137.
- Bahcall and Wolf (1977) Bahcall, J. N. and Wolf, R. A. (1977), The star distribution around a massive black hole in a globular cluster. II. Unequal star masses., ApJ, 216, pp. 883–907.
- Barkov et al. (2012) Barkov, M. V., Aharonian, F. A., Bogovalov, S. V., Kelner, S. R. and Khangulyan, D. (2012), Rapid TeV Variability in Blazars as a Result of Jet-Star Interaction, ApJ, 749(2), 119, 1012.1787.
- Barkov et al. (2010) Barkov, M. V., Aharonian, F. A. and Bosch-Ramon, V. (2010), Gamma-ray Flares from Red Giant/Jet Interactions in Active Galactic Nuclei, ApJ, 724(2), pp. 1517–1523, 1005.5252.
- Baumgardt et al. (2006) Baumgardt, H., Gualandris, A. and Portegies Zwart, S. (2006), Ejection of hypervelocity stars from the Galactic Centre by intermediate-mass black holes, MNRAS, 372(1), pp. 174–182, astro-ph/0607455.
- Bland-Hawthorn and Cohen (2003) Bland-Hawthorn, J. and Cohen, M. (2003), The Large-Scale Bipolar Wind in the Galactic Center, ApJ, 582(1), pp. 246–256, astro-ph/0208553.
- Bland-Hawthorn et al. (2019) Bland-Hawthorn, J., Maloney, P. R., Sutherland, R., Groves, B., Guglielmo, M., Hao Li, W., Curzons, A., Cecil, G. and Fox, A. J. (2019), The Large-scale Ionization Cones in the Galaxy, ApJ, 886(1), 45.
- Bogdanović et al. (2014) Bogdanović, T., Cheng, R. M. and Amaro-Seoane, P. (2014), Disruption of a Red Giant Star by a Supermassive Black Hole and the Case of PS1-10jh, ApJ, 788(2), 99, 1307.6176.
- Britzen et al. (2018) Britzen, S., Fendt, C., Witzel, G., Qian, S. J., Pashchenko, I. N., Kurtanidze, O., Zajacek, M., Martinez, G., Karas, V., Aller, M., Aller, H., Eckart, A., Nilsson, K., Arévalo, P., Cuadra, J., Subroweit, M. and Witzel, A. (2018), OJ287: deciphering the ‘Rosetta stone of blazars, MNRAS, 478(3), pp. 3199–3219.
- Buchholz et al. (2009) Buchholz, R. M., Schödel, R. and Eckart, A. (2009), Composition of the galactic center star cluster. Population analysis from adaptive optics narrow band spectral energy distributions, A&A, 499(2), pp. 483–501, 0903.2135.
- Dale et al. (2009) Dale, J. E., Davies, M. B., Church, R. P. and Freitag, M. (2009), Red giant stellar collisions in the Galactic Centre, MNRAS, 393(3), pp. 1016–1033, 0811.3111.
- Ernst et al. (2009) Ernst, A., Just, A. and Spurzem, R. (2009), On the dissolution of star clusters in the Galactic Centre - I. Circular orbits, MNRAS, 399(1), pp. 141–156, 0906.4459.
- Gallego-Cano et al. (2018) Gallego-Cano, E., Schödel, R., Dong, H., Nogueras-Lara, F., Gallego-Calvente, A. T., Amaro-Seoane, P. and Baumgardt, H. (2018), The distribution of stars around the Milky Way’s central black hole. I. Deep star counts, A&A, 609, A26, 1701.03816.
- Genzel et al. (1996) Genzel, R., Thatte, N., Krabbe, A., Kroker, H. and Tacconi-Garman, L. E. (1996), The Dark Mass Concentration in the Central Parsec of the Milky Way, ApJ, 472, p. 153.
- Guo and Mathews (2012) Guo, F. and Mathews, W. G. (2012), The Fermi Bubbles. I. Possible Evidence for Recent AGN Jet Activity in the Galaxy, ApJ, 756(2), 181, 1103.0055.
- Habibi et al. (2019) Habibi, M., Gillessen, S., Pfuhl, O., Eisenhauer, F., Plewa, P. M., von Fellenberg, S., Widmann, F., Ott, T., Gao, F., Waisberg, I., Bauböck, M., Jimenez-Rosales, A., Dexter, J., de Zeeuw, P. T. and Genzel, R. (2019), Spectroscopic Detection of a Cusp of Late-type Stars around the Central Black Hole in the Milky Way, ApJ, 872(1), L15, 1902.07219.
- Heywood et al. (2019) Heywood, I., Camilo, F., Cotton, W. D., Yusef-Zadeh, F., Abbott, T. D., Adam, R. M., Aldera, M. A., Bauermeister, E. F., Booth, R. S., Botha, A. G., Botha, D. H., Brederode, L. R. S., Brits, Z. B., Buchner, S. J., Burger, J. P., Chalmers, J. M., Cheetham, T., de Villiers, D., Dikgale-Mahlakoana, M. A., du Toit, L. J., Esterhuyse, S. W. P., Fanaroff, B. L., Foley, A. R., Fourie, D. J., Gamatham, R. R. G., Goedhart, S., Gounden, S., Hlakola, M. J., Hoek, C. J., Hokwana, A., Horn, D. M., Horrell, J. M. G., Hugo, B., Isaacson, A. R., Jonas, J. L., Jordaan, J. D. B. L., Joubert, A. F., Józsa, G. I. G., Julie, R. P. M., Kapp, F. B., Kenyon, J. S., Kotzé, P. P. A., Kriel, H., Kusel, T. W., Lehmensiek, R., Liebenberg, D., Loots, A., Lord, R. T., Lunsky, B. M., Macfarlane, P. S., Magnus, L. G., Magozore, C. M., Mahgoub, O., Main, J. P. L., Malan, J. A., Malgas, R. D., Manley, J. R., Maree, M. D. J., Merry, B., Millenaar, R., Mnyandu, N., Moeng, I. P. T., Monama, T. E., Mphego, M. C., New, W. S., Ngcebetsha, B., Oozeer, N., Otto, A. J., Passmoor, S. S., Patel, A. A., Peens-Hough, A., Perkins, S. J., Ratcliffe, S. M., Renil, R., Rust, A., Salie, S., Schwardt, L. C., Serylak, M., Siebrits, R., Sirothia, S. K., Smirnov, O. M., Sofeya, L., Swart, P. S., Tasse, C., Taylor, D. T., Theron, I. P., Thorat, K., Tiplady, A. J., Tshongweni, S., van Balla, T. J., van der Byl, A., van der Merwe, C., van Dyk, C. L., Van Rooyen, R., Van Tonder, V., Van Wyk, R., Wallace, B. H., Welz, M. G. and Williams, L. P. (2019), Inflation of 430-parsec bipolar radio bubbles in the Galactic Centre by an energetic event, Nature, 573(7773), pp. 235–237, 1909.05534.
- Hills (1975) Hills, J. G. (1975), Possible power source of Seyfert galaxies and QSOs, Nature, 254(5498), pp. 295–298.
- Ito et al. (2008) Ito, H., Kino, M., Kawakatu, N., Isobe, N. and Yamada, S. (2008), The Estimate of Kinetic Power of Jets in FR II Radio Galaxies: Existence of Invisible Components?, ApJ, 685(2), pp. 828–838, %****␣zaj.tex␣Line␣500␣****0807.1946.
- Kieffer and Bogdanović (2016) Kieffer, T. F. and Bogdanović, T. (2016), Can Star-Disk Collisions Explain the Missing Red Giants Problem in the Galactic Center?, ApJ, 823(2), 155, 1602.03527.
- Kim and Morris (2003) Kim, S. S. and Morris, M. (2003), Dynamical Friction on Star Clusters near the Galactic Center, ApJ, 597(1), pp. 312–322, astro-ph/0307271.
- King (2020) King, A. (2020), GSN 069 - A tidal disruption near miss, MNRAS, 493(1), pp. L120–L123, 2002.00970.
- Kroupa (2001) Kroupa, P. (2001), On the variation of the initial mass function, MNRAS, 322(2), pp. 231–246, astro-ph/0009005.
- Levin and Beloborodov (2003) Levin, Y. and Beloborodov, A. M. (2003), Stellar Disk in the Galactic Center: A Remnant of a Dense Accretion Disk?, ApJ, 590(1), pp. L33–L36, astro-ph/0303436.
- Li et al. (2013) Li, Z., Morris, M. R. and Baganoff, F. K. (2013), Evidence for a Parsec-scale Jet from the Galactic Center Black Hole: Interaction with Local Gas, ApJ, 779(2), 154, 1310.0146.
- Merritt and Szell (2006) Merritt, D. and Szell, A. (2006), Dynamical Cusp Regeneration, ApJ, 648(2), pp. 890–899, astro-ph/0510498.
- Miller and Bregman (2016) Miller, M. J. and Bregman, J. N. (2016), The Interaction of the Fermi Bubbles with the Milky Way’s Hot Gas Halo, ApJ, 829(1), 9, 1607.04906.
- Milosavljević and Loeb (2004) Milosavljević, M. and Loeb, A. (2004), The Link between Warm Molecular Disks in Maser Nuclei and Star Formation near the Black Hole at the Galactic Center, ApJ, 604(1), pp. L45–L48, astro-ph/0401221.
- Morris (1993) Morris, M. (1993), Massive Star Formation near the Galactic Center and the Fate of the Stellar Remnants, ApJ, 408, p. 496.
- Mužić et al. (2010) Mužić, K., Eckart, A., Schödel, R., Buchholz, R., Zamaninasab, M. and Witzel, G. (2010), Comet-shaped sources at the Galactic center. Evidence of a wind from the central 0.2 pc, A&A, 521, A13, 1006.0909.
- Paczyński (1970) Paczyński, B. (1970), Evolution of Single Stars. I. Stellar Evolution from Main Sequence to White Dwarf or Carbon Ignition, Acta Astron., 20, p. 47.
- Peißker et al. (2019) Peißker, F., Zajaček, M., Eckart, A., Sabha, N. B., Shahzamanian, B. and Parsa, M. (2019), New bow-shock source with bipolar morphology in the vicinity of Sgr A*, A&A, 624, A97, 1903.05986.
- Perets et al. (2007) Perets, H. B., Hopman, C. and Alexander, T. (2007), Massive Perturber-driven Interactions between Stars and a Massive Black Hole, ApJ, 656(2), pp. 709–720, astro-ph/0606443.
- Perucho et al. (2017) Perucho, M., Bosch-Ramon, V. and Barkov, M. V. (2017), Impact of red giant/AGB winds on active galactic nucleus jet propagation, A&A, 606, A40, 1706.06301.
- Pfuhl et al. (2011) Pfuhl, O., Fritz, T. K., Zilka, M., Maness, H., Eisenhauer, F., Genzel, R., Gillessen, S., Ott, T., Dodds-Eden, K. and Sternberg, A. (2011), The Star Formation History of the Milky Way’s Nuclear Star Cluster, ApJ, 741(2), 108, 1110.1633.
- Phinney (1989) Phinney, E. S. (1989), Manifestations of a Massive Black Hole in the Galactic Center, in M. Morris, editor, The Center of the Galaxy, volume 136 of IAU Symposium, p. 543.
- Ponti et al. (2019) Ponti, G., Hofmann, F., Churazov, E., Morris, M. R., Haberl, F., Nandra, K., Terrier, R., Clavel, M. and Goldwurm, A. (2019), An X-ray chimney extending hundreds of parsecs above and below the Galactic Centre, Nature, 567(7748), pp. 347–350, 1904.05969.
- Rees (1988) Rees, M. J. (1988), Tidal disruption of stars by black holes of 106-108 solar masses in nearby galaxies, Nature, 333(6173), pp. 523–528.
- Refsdal and Weigert (1971) Refsdal, S. and Weigert, A. (1971), On the Production of White Dwarfs in Binary Systems of Small Mass, A&A, 13, p. 367.
- Reimers (1987) Reimers, D. (1987), What do binaries teach us about mass-loss from late-type stars?, in I. Appenzeller and C. Jordan, editors, Circumstellar Matter, volume 122 of IAU Symposium, pp. 307–318.
- Schawinski et al. (2015) Schawinski, K., Koss, M., Berney, S. and Sartori, L. F. (2015), Active galactic nuclei flicker: an observational estimate of the duration of black hole growth phases of 105 yr, MNRAS, 451(3), pp. 2517–2523, 1505.06733.
- Schödel et al. (2014) Schödel, R., Feldmeier, A., Neumayer, N., Meyer, L. and Yelda, S. (2014), The nuclear cluster of the Milky Way: our primary testbed for the interaction of a dense star cluster with a massive black hole, Classical and Quantum Gravity, 31(24), 244007, 1411.4504.
- Schödel et al. (2009) Schödel, R., Merritt, D. and Eckart, A. (2009), The nuclear star cluster of the Milky Way: proper motions and mass, A&A, 502(1), pp. 91–111, 0902.3892.
- Schödel et al. (2010) Schödel, R., Najarro, F., Muzic, K. and Eckart, A. (2010), Peering through the veil: near-infrared photometry and extinction for the Galactic nuclear star cluster. Accurate near infrared H, Ks, and L’ photometry and the near-infrared extinction-law toward the central parsec of the Galaxy, A&A, 511, A18.
- Schödel et al. (2020) Schödel, R., Nogueras-Lara, F., Gallego-Cano, E., Shahzamanian, B., Gallego-Calvente, A. T. and Gardini, A. (2020), The Milky Way’s nuclear star cluster: Old, metal-rich, and cuspy. Structure and star formation history from deep imaging, A&A, 641, A102.
- Sellgren et al. (1990) Sellgren, K., McGinn, M. T., Becklin, E. E. and Hall, D. N. (1990), Velocity Dispersion and the Stellar Population in the Central 1.2 Parsecs of the Galaxy, ApJ, 359, p. 112.
- Su et al. (2010) Su, M., Slatyer, T. R. and Finkbeiner, D. P. (2010), Giant Gamma-ray Bubbles from Fermi-LAT: Active Galactic Nucleus Activity or Bipolar Galactic Wind?, ApJ, 724(2), pp. 1044–1082, 1005.5480.
- Yusef-Zadeh et al. (2012) Yusef-Zadeh, F., Arendt, R., Bushouse, H., Cotton, W., Haggard, D., Pound, M. W., Roberts, D. A., Royster, M. and Wardle, M. (2012), A 3 pc Scale Jet-driven Outflow from Sgr A*, ApJ, 758(1), L11, 1208.1193.
- Yusef-Zadeh et al. (2020) Yusef-Zadeh, F., Royster, M., Wardle, M., Cotton, W., Kunneriath, D., Heywood, I. and Michail, J. (2020), Evidence for a jet and outflow from Sgr A*: a continuum and spectral line study, MNRAS, 499(3), pp. 3909–3931, 2008.04317.
- Zajaček et al. (2020) Zajaček, M., Araudo, A., Karas, V., Czerny, B. and Eckart, A. (2020), Depletion of Bright Red Giants in the Galactic Center during Its Active Phases, ApJ, 903(2), 140, 2009.14364.