Depletion of bright red giants in the Galactic center during its active phases
Abstract
Observations in the near-infrared domain showed the presence of the flat core of bright late-type stars inside from the Galactic center supermassive black hole (Sgr A*), while young massive OB/Wolf-Rayet stars form a cusp. Several dynamical processes were proposed to explain this apparent paradox of the distribution of the Galactic center stellar populations. Given the mounting evidence about a significantly increased activity of Sgr A* during the past million years, we propose a scenario based on the interaction between the late-type giants and a nuclear jet, whose past existence and energetics can be inferred from the presence of -ray Fermi bubbles and bipolar radio bubbles. Extended, loose envelopes of red giant stars can be ablated by the jet with kinetic luminosity in the range of – within the inner of Sgr A* (S cluster region), which would lead to their infrared luminosity decrease after several thousand jet-star interactions. The ablation of the atmospheres of red giants is complemented by the process of tidal stripping that operates at distances of , and by the direct mechanical interaction of stars with a clumpy disc at , which can explain the flat density profile of bright late-type stars inside the inner half parsec from Sgr A*.
1 Introduction
The Galactic center supermassive black hole (hereafter SMBH) with the mass of is located at the distance of (Boehle et al., 2016; Gillessen et al., 2017; Parsa et al., 2017; Gravity Collaboration et al., 2018) and provides a unique laboratory for studying detailed dynamical processes and the mutual interaction between the nuclear star cluster (NSC) and a central massive black hole (Alexander, 2005; Genzel et al., 2010; Eckart et al., 2017; Ali et al., 2020) as well as with the multiphase gaseous-dusty circumnuclear medium (Morris & Serabyn, 1996; Różańska et al., 2017). The compact radio source Sgr A* associated with the SMBH is embedded in the Milky Way NSC, which is one of the densest stellar systems in the Galaxy (Schödel et al., 2014), and in addition, it is surrounded by an ionized, neutral, and molecular gas and dust (see e.g. Moser et al., 2017, and references therein).
The NSC consists of both late-type (red giants, supergiants and asymptotic giant branch stars) and early-type stars of O and B spectral classes (Krabbe et al., 1991; Do et al., 2009; Buchholz et al., 2009; Gallego-Cano et al., 2018), which implies star-formation during the whole Galactic history, albeit most likely episodic (Pfuhl et al., 2011) with the star-formation peak at 10 Gyr, the minimum at 1-2 Gyr and a recent increase in the last few hundred million years.
In the innermost parsec of the Galactic center, there is a surprising abundance of young massive OB/Wolf-Rayet stars formed in-situ in the last 10 million years (Ghez et al., 2003). These young stars form an unrelaxed cusp-like distribution. On the other hand, former studies of the distribution of late-type stars showed that they exhibit a core-like distribution inside the inner , which has a projected flat or even decreasing profile towards the center (Do et al., 2009; Buchholz et al., 2009). More recent studies provided a precise analysis of the distribution of late-type stars because of increasing their sensitivity towards larger magnitudes, i.e. fainter giants (Gallego-Cano et al., 2018; Habibi et al., 2019). Using photometric number counts and diffuse light analysis, Gallego-Cano et al. (2018) found that fainter late-type stars with magnitudes of exhibit a cusp-like distribution within the sphere of influence of Sgr A* with a 3D power-law exponent of . In comparison, there is an apparent lack of bright red giants with at the projected radii of from Sgr A*. Gallego-Cano et al. (2018) estimate the number of missing giants to 100 for this distance range. The study of Habibi et al. (2019) also finds a cusp-like distribution for late-type stars with within . In agreement with Gallego-Cano et al. (2018), they found a core-like distribution for the brightest giants with , although the number of missing giants appears to be lower than 100 according to their analysis. Although the surface brightness distribution of late-type stars brighter than 15.5 magnitudes appears to be rather flat, already in Fig. 11 of Buchholz et al. (2009) the inner point at (where at the Galactic center) of the distribution of the late-type stars as well as of the distribution of all the stars indicates the presence of a cusp.
In summary, there appears to be an internal mechanism within the NSC that preferentially depleted bright, large red giants on one hand, which has led to their apparent core-like distribution, and at the same time has been less efficient for early-type as well as fainter late-type stars on the other hand. Such a mechanism has altered either the spatial, luminosity, or the temperature distribution of the bright red-giant stars so that they effectively fall beyond the detection limit or they rather mimic younger, “bluer” stars. So far, mainly the following four mechanisms have been discussed to explain the apparent lack of bright red giants,
- •
- •
- •
-
•
mass segregation effects: the dynamical effect of a secondary massive black hole (Baumgardt et al., 2006; Merritt & Szell, 2006; Portegies Zwart et al., 2006; Matsubayashi et al., 2007; Löckmann & Baumgardt, 2008; Gualandris & Merritt, 2012) or of an infalling massive cluster (Kim & Morris, 2003; Ernst et al., 2009; Antonini et al., 2012) or of stellar black holes (Morris, 1993) (altered spatial distribution),
where in the parentheses we include the mechanism responsible for altering the population of late-type stars. The importance of star–star and star–disc interactions was also analyzed generally for active galactic nuclei in terms of the effects on the accretion disk and Broad Line region structure as well as the NSC orbital distribution (Zurek et al., 1994; Armitage et al., 1996; Karas & Šubr, 2001; Vilkoviskij & Czerny, 2002; MacLeod & Lin, 2019; Kieffer & Bogdanović, 2016).
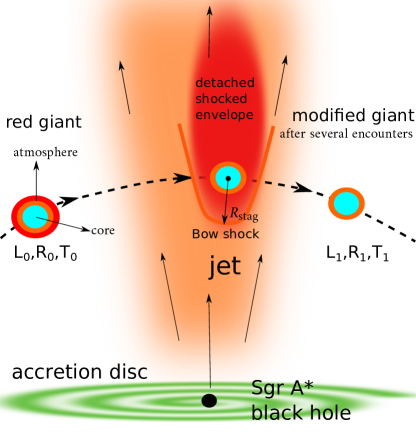
We propose here another mechanism based on the jet-star interactions (Barkov et al., 2012a; Araudo et al., 2013; Araudo & Karas, 2017), which most likely coexisted with the mechanisms proposed above. In particular, the star–accretion disc collisions are expected to be accompanied by star–jet crossings during previous active phases of Sgr A*. Since red-giant stars have typically large, loosely bound tenuous envelopes, dense compact cores, and slow winds with the terminal velocity , they are in particular susceptible to mass removal in encounters with higher-pressure material (MacLeod et al., 2012; Amaro-Seoane & Chen, 2014; Kieffer & Bogdanović, 2016).111The estimate of the terminal wind velocity is given by the escape velocity . Therefore during the red giant–jet interactions, the jet ram pressure will remove the outer layers of the stellar envelope during the passage. We illustrate this idea in Fig. 1.
After several star–jet crossings, the atmosphere is removed similarly as for repetitive star–disc crossings (Amaro-Seoane et al., 2020) and the giant is modified in a way that it follows an evolutionary track in the Hertzsprung-Russell (HR) diagram approximately along the constant absolute magnitude towards higher effective temperatures. We show that this mechanism quite likely operated in the vicinity of Sgr A* during its active Seyfert-like phase in the past few million years (Bland-Hawthorn et al., 2019) when the jet kinetic luminosity could have reached . In principle, even in the quiescent state, a tidal disruption event every years, which can be estimated for the Galactic center (Syer & Ulmer, 1999; Alexander, 2005), can temporarily reactivate the jet of Sgr A* and some of the bright red giants could be depleted during its existence. This makes the red giant–jet interaction in the Galactic center relevant and highly plausible in its recent history and the dynamical consequences can be inferred based on the so-far detected traces of the past active phase of Sgr A* as well as the currently observed stellar density distribution.
Previous jet-star interaction studies were focused on the emergent non-thermal radiation, in particular in the gamma-ray domain, and mass-loading and chemical enrichment of jets by stellar winds (see e.g. Komissarov, 1994; Barkov et al., 2012a; Bosch-Ramon et al., 2012; Araudo et al., 2013; Bednarek & Banasiński, 2015; de la Cita et al., 2016). Here we focus on the effect of the jet on the stellar population. In most of the jetted active galactic nuclei, this is perhaps a secondary problem since stellar populations in the host bulge cannot be resolved out, i.e. one can only analyze the integrated starlight. In contrast, within the Galactic center NSC, one can not only disentangle late- and early-type stars, but it is also possible to study their distribution as well as kinematics of individual stars. Although in the current low-luminosity state there is not firm evidence for the presence of a relativistic jet, there are nowadays several multiwavelength signatures of the past active Seyfert-like state of Sgr A* that occurred a few million years ago (Bland-Hawthorn et al., 2019; Heywood et al., 2019; Ponti et al., 2019). However, even in the current quiescent state of Sgr A*, studies by Yusef-Zadeh et al. (2012) and Li et al. (2013) indicate the existence of a low-surface-brightness pc-scale jet. In addition, the presence of the cometary-shaped infrared-excess bow-shock sources X3, X7 (Mužić et al., 2010) and recently X8 (Peißker et al., 2019) indicates that the star–outflow interaction is ongoing even in a very low state of the Sgr A* activity. The morphology of these sources can be explained by the interaction with a strong accretion wind originating from Sgr A* or with the collective wind of the cluster of young stars.
This paper proposes a new mechanism that could have affected the current population of bright late-type stars, namely their appearance as well as number counts in specific magnitude bins, in the Galactic center. We apply analytical and semi-analytical calculations to assess whether the potential past jet–star interactions could have had an effect on the stellar population in the sphere of influence of Sgr A*. Although the analytical calculations introduce several simplifications, we show that the mechanism could have operated and the estimated number of affected red giants is in accordance with the up-to-date most sensitive studies (Gallego-Cano et al., 2018; Habibi et al., 2019). A more detailed computational treatment including magnetohydrodynamic numerical simulations as well as a stellar evolution will be presented in our future studies.
The paper is structured as follows. In Section 2, we derive the stagnation radius, basic timescales, and the removed envelope mass for red-giant stars interacting with the jet of Sgr A* during its past active phase. In Section 3, we discuss the observational signatures in the near-infrared domain. Subsequently, in Section 4, we estimate the number of red giants that could be affected by the jet interaction and visually depleted from the immediate vicinity of Sgr A*. In Section 6, we discuss additional processes related to the red giant–jet interaction in the Galactic center. Finally, we summarize the main results and conclude with Section 7.
2 Derivation of jet-star stagnation radius and the jet-induced stellar mass-loss
The evidence for the active phase of Sgr A* that is estimated to have occurred ago is based on the X-ray/-ray bubbles with total energy content of (Bland-Hawthorn et al., 2019). The first evidence for the nuclear outburst was the kpc-scale 1.5 keV ROSAT X-ray emission that originated in the Galactic center (Bland-Hawthorn & Cohen, 2003). The X-ray structure coincides well with the more recently discovered Fermi -ray bubbles extending north and south of the Galactic plane at 1-100 GeV (Su et al., 2010). The X-ray/-ray bubbles are energetically consistent with the nuclear AGN-like activity associated with the jet and/or disc-wind outflows with jet power and age (Miller & Bregman, 2016). In comparison, the starburst origin of the Fermi bubbles is inconsistent with the bubble energetics by a factor of (Bland-Hawthorn & Cohen, 2003). On intermediate scales of hundreds of parsecs, the base of the Fermi bubbles coincides with the bipolar radio bubbles (Heywood et al., 2019) as well as with the X-ray chimneys (Ponti et al., 2019).
Using hydrodynamic simulations, Guo & Mathews (2012) reproduce the basic radiative characteristics of the Fermi bubbles with the AGN jet duration of Myr, which corresponds to the jet luminosity . The jet is dominated by the kinetic luminosity , where is the conversion efficiency from the accretion luminosity to the jet kinetic luminosity. The accretion luminosity is , where the Eddington luminosity is
| (1) |
and for most radio sources (Ito et al., 2008). This yields the maximum jet kinetic luminosity for Sgr A* of . We will consider , where the lower limit is given by the putative jet present in the current quiescent state (Yusef-Zadeh et al., 2012), with the inferred kinetic luminosity of , and the upper limit is given by the Eddington luminosity.
We assume a conical jet with a half-opening angle and width , where is the distance to Sgr A*. The jet footpoint for Sgr A* can be estimated to be located at (Junor et al., 1999), where is the Schwarzschild radius. Any red giant or supergiant with radius222The stellar radius is the sum of the core radius and the envelope radius, . and mass is not expected to plunge below since the tidal disruption radius (Hills, 1975; Rees, 1988) is at least a factor of two larger,
| (2) |
and are typical intermediate values for the evolved late-type giants with extended envelopes (Merritt, 2013). For numerical estimates, we consider the range of radii for red giants and supergiants, , as indicated by the Hertzsprung-Russell diagram. These late-type stars have the large range of bolometric luminosities, , and the temperature range of , which corresponds to the spectral classes K and M, respectively. The K-band magnitude range is mag for , and mag for , . More specifically, we focus on the late-type stars of and brighter, which appear to form a core-like density distribution in the central pc. Using the isochrones obtained with the Parsec code (Bressan et al., 2012), these stars have and larger for an age of 5 Gyr. The late-type stars that are completely absent in the S-cluster (inner ) were inferred to have and larger (Habibi et al., 2019). Therefore, numerical estimates are typically scaled to unless otherwise indicated.
We will further focus on the region between the tidal radius of red giants and the outer edge of the S cluster, which approximately corresponds to the Bondi radius of the hot bremsstrahlung plasma (Baganoff et al., 2003; Wang et al., 2013),
| (3) |
which is two-three orders of magnitude larger than the tidal radius of red giants, . More generally speaking, the population of predominantly B-type stars lies within the innermost arcsecond (, S cluster), while the population of young massive OB/Wolf-Rayet stars stretches from up to , a fraction of which forms a warped stellar disc (Genzel et al., 2010).
The stellar wind ram pressure at a distance from the center of the star can be estimated as , where is the mass-loss rate and is the terminal wind velocity. Using typical values for red giants with and (e.g. Reimers, 1987; de la Cita et al., 2016)333For red giants, according to Reimers (1987).
| (4) |
The ram pressure of a relativistic jet with bulk motion Lorentz factor is , where the jet density is and is the jet cross-sectional area. By assuming and the jet kinetic pressure for Sgr A* can be written as
| (5) |
where we have assumed that corresponds to the jet sheath half-opening angle estimated for the current candidate jet of Sgr A* (Li et al., 2013). Note that the innermost arcsecond ( pc) is also the outer radius of fast-moving stars in the S cluster (Genzel et al., 2010; Eckart et al., 2017).
By equating , we obtain the stagnation distance
| (6) |
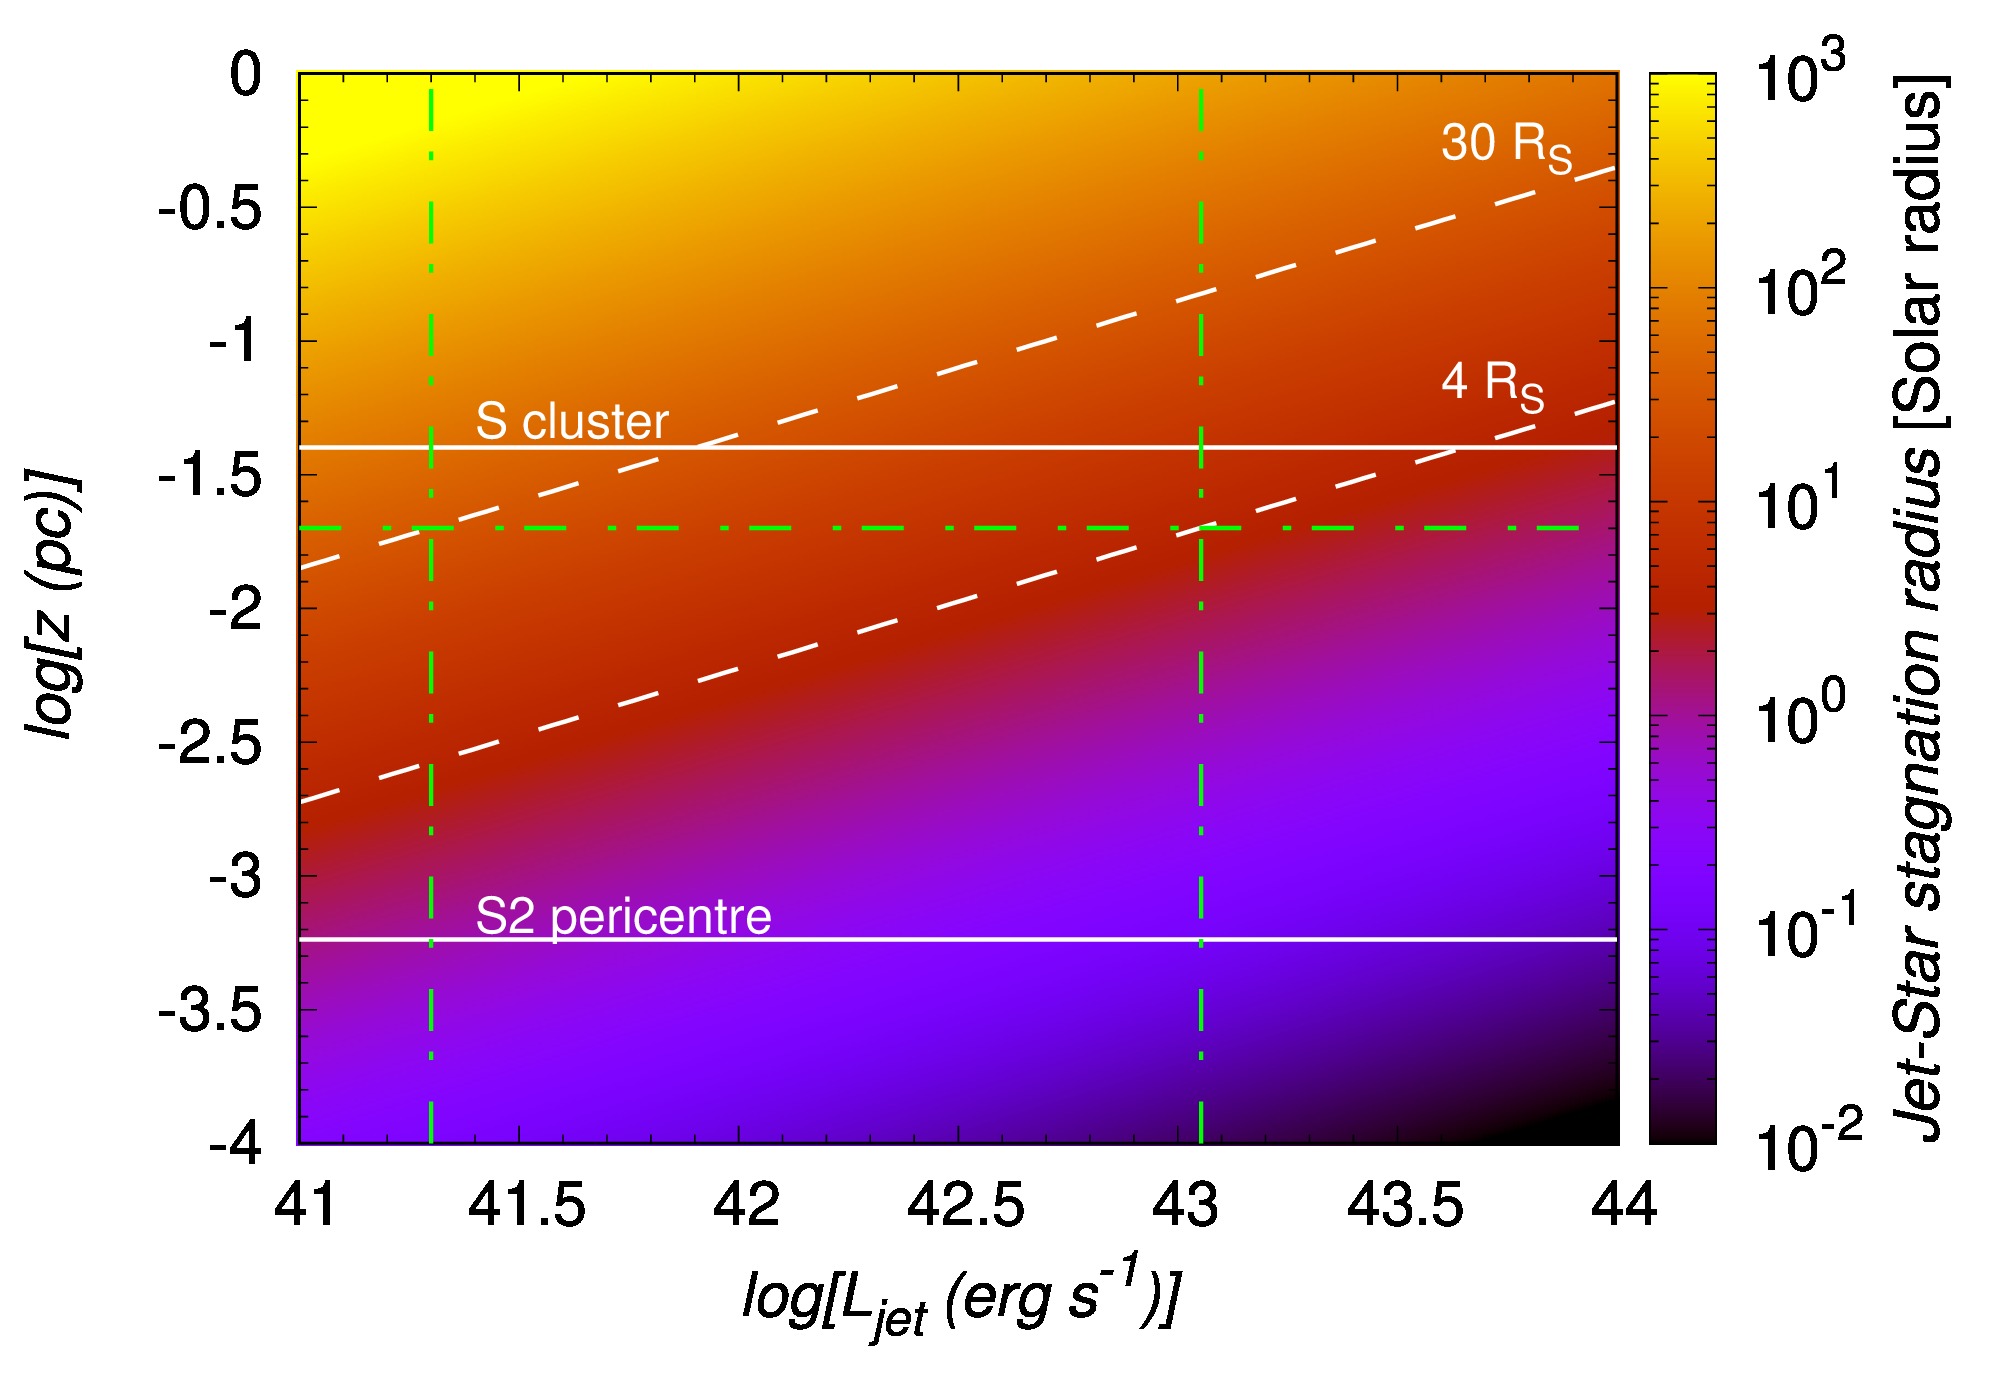
which characterizes by how much the red-giant envelope can be ablated by the jet in one encounter. Note that for late-type giants and supergiants with (see Figure 2). The very tenuous wind of red giants cannot balance the jet ram pressure and therefore the jet plasma impacts on the stellar surface. As a consequence, a fraction of the stellar envelope is removed as estimated by Eq. (6).
Interestingly, giant stars with appear to be missing in the S cluster. Only late-type stars with between and (with absolute bolometric magnitudes between and , respectively, for the effective temperature of 4000 K) were detected by Habibi et al. (2019) (see their figure 2). Stars with within pc have when , as it is indicated in Fig. 2. This is in agreement with the estimated jet power from X- and -ray bubbles (Miller & Bregman, 2016). Therefore, an apparent lack of late-type giant stars with envelopes in the inner of Galactic center could result from the jet-induced ablation of the stellar envelope during the last active phase of Sgr A*, a few million years ago.
2.1 Basic timescales of the jet-star interaction
The red giant, will enter the jet and not mix with its sheath layers on the surface if , where is the Keplerian orbital velocity of the star around Sgr A* and is the sound speed inside the shocked obstacle. This condition can be written as
| (7) |
which means that stellar atmosphere layers of the comparable density or greater than indicated by Eq. (7) will enter the jet and the less dense upper layers will mix with the jet surface layers.
Once inside, the bow shock is formed inside the jet on the very short timescale of . A shock also propagates through the red giant atmosphere on the shock-crossing or dynamical timescale, , whose lower limit is imposed by the condition of penetration, , which leads to . The dynamical, shock-crossing time is at least times longer than the bow-shock formation time close to the footpoint of the jet, but the ratio becomes larger with the distance from Sgr A* as .
The star-crossing time through the jet can be estimated as . Using and the condition , we obtain
| (8) |
which implies that the shock propagates throughout the detached envelope, which is dragged by the jet and mixed with its material. Eventually, after several , the envelope material will reach the velocity of . Note that when , hence the removed envelope material should be dragged by the jet throughout the whole NSC.
The ablated red giant after the first crossing through the jet would first expand adiabatically to the original size on the thermal expansion timescale because of the pressure of the warmer underlying layers as the star adjusts its size to reach a hydrodynamic equilibrium. This expansion timescale is shorter than the orbital timescale
| (9) |
Kieffer & Bogdanović (2016) infer a similar timescale for the envelope expansion using the hydrodynamic simulations of red giant–accretion clump collisions. According to their Fig. 7, the envelope expands to a larger size than the original stellar radius in after the star emerges from the accretion clump, where is a dynamical timescale of the star,
| (10) |
which leads to .
The timescale of the thermal evolution of a star after the jet-star interaction is expressed by the Kelvin-Helmholtz (KH) or thermal timescale,
| (11) |
where we estimated the stellar luminosity using for typical of red giants. For the whole range of stellar radii and stellar luminosities , differs considerably – from yrs for the smallest giants to for the largest ones.
Based on the comparison between the time between jet-star collisions and the KH timescale, one can distinguish cool colliders when , i.e. the star had enough time to radiate away the accumulated collisional heat and it cools down and shrinks before the next collision. For the case when , there is not enough time to radiate away the excess collisional heat and the star is warmer and larger at the time of the subsequent collision - these are so-called warm colliders. In the nuclear star cluster when the jet was active, there were both types of colliders with the approximate division given by , which leads to
| (12) |
The length-scale implies that red giants located inside the inner S cluster were collisionally heated up and bloated, which increased their mass removal during repetitive encounters with the jet. Stars orbiting at larger distances managed to cool down and shrink in size before the next collision, which has subsequently diminished their overall mass loss. However, note that Eq. (12) is a function of stellar parameters , , and , hence differs depending on the red-giant stage and its mass. For the smallest late-type stars with and , , therefore they can be classified as warm colliders throughout the nuclear star cluster. On the other hand, the late-type supergiants with and have , hence they can be classified as cool colliders beyond milliparsec distances.
2.2 Jet-induced envelope removal
The stellar evolution after a jet-star encounter is generally complicated given that the envelopes of red giants become bloated after the first passage through the jet. This is because of the pressure of lower, hotter layers and their subsequent nearly adiabatic expansion, which can make the red giant even larger and brighter (Kieffer & Bogdanović, 2016). Note that the number of encounters , where Myr is the jet lifetime, is typically . In particular,
| (13) |
The number of encounters is also at least two orders of magnitude larger than the one expected from the star–accretion clump interaction investigated by Kieffer & Bogdanović (2016) and Amaro-Seoane et al. (2020). After the first passage, the bloated red giant has an even larger cross-section than before the encounter, which increases the mass removed during subsequent encounters (Armitage et al., 1996; Kieffer & Bogdanović, 2016). The jet–star interaction phase proceeds during the red-giant lifetime, which is (MacLeod et al., 2012). During the red giant phase, there are orbits around Sgr A*, out of which involve the interaction with the jet, assuming there was only one period of increased activity of Sgr A* in the last 100 million years. This ensures that the repetitive jet-red giant interaction leads to a substantial mass-loss and the upper layer of the envelope is eventually removed.
The mass removal in a single passage due to the atmosphere ablation can be estimated through the balance of the jet ram force and the gravitational force acting on the envelope, i.e. , giving (Barkov et al., 2012a)
| (14) |
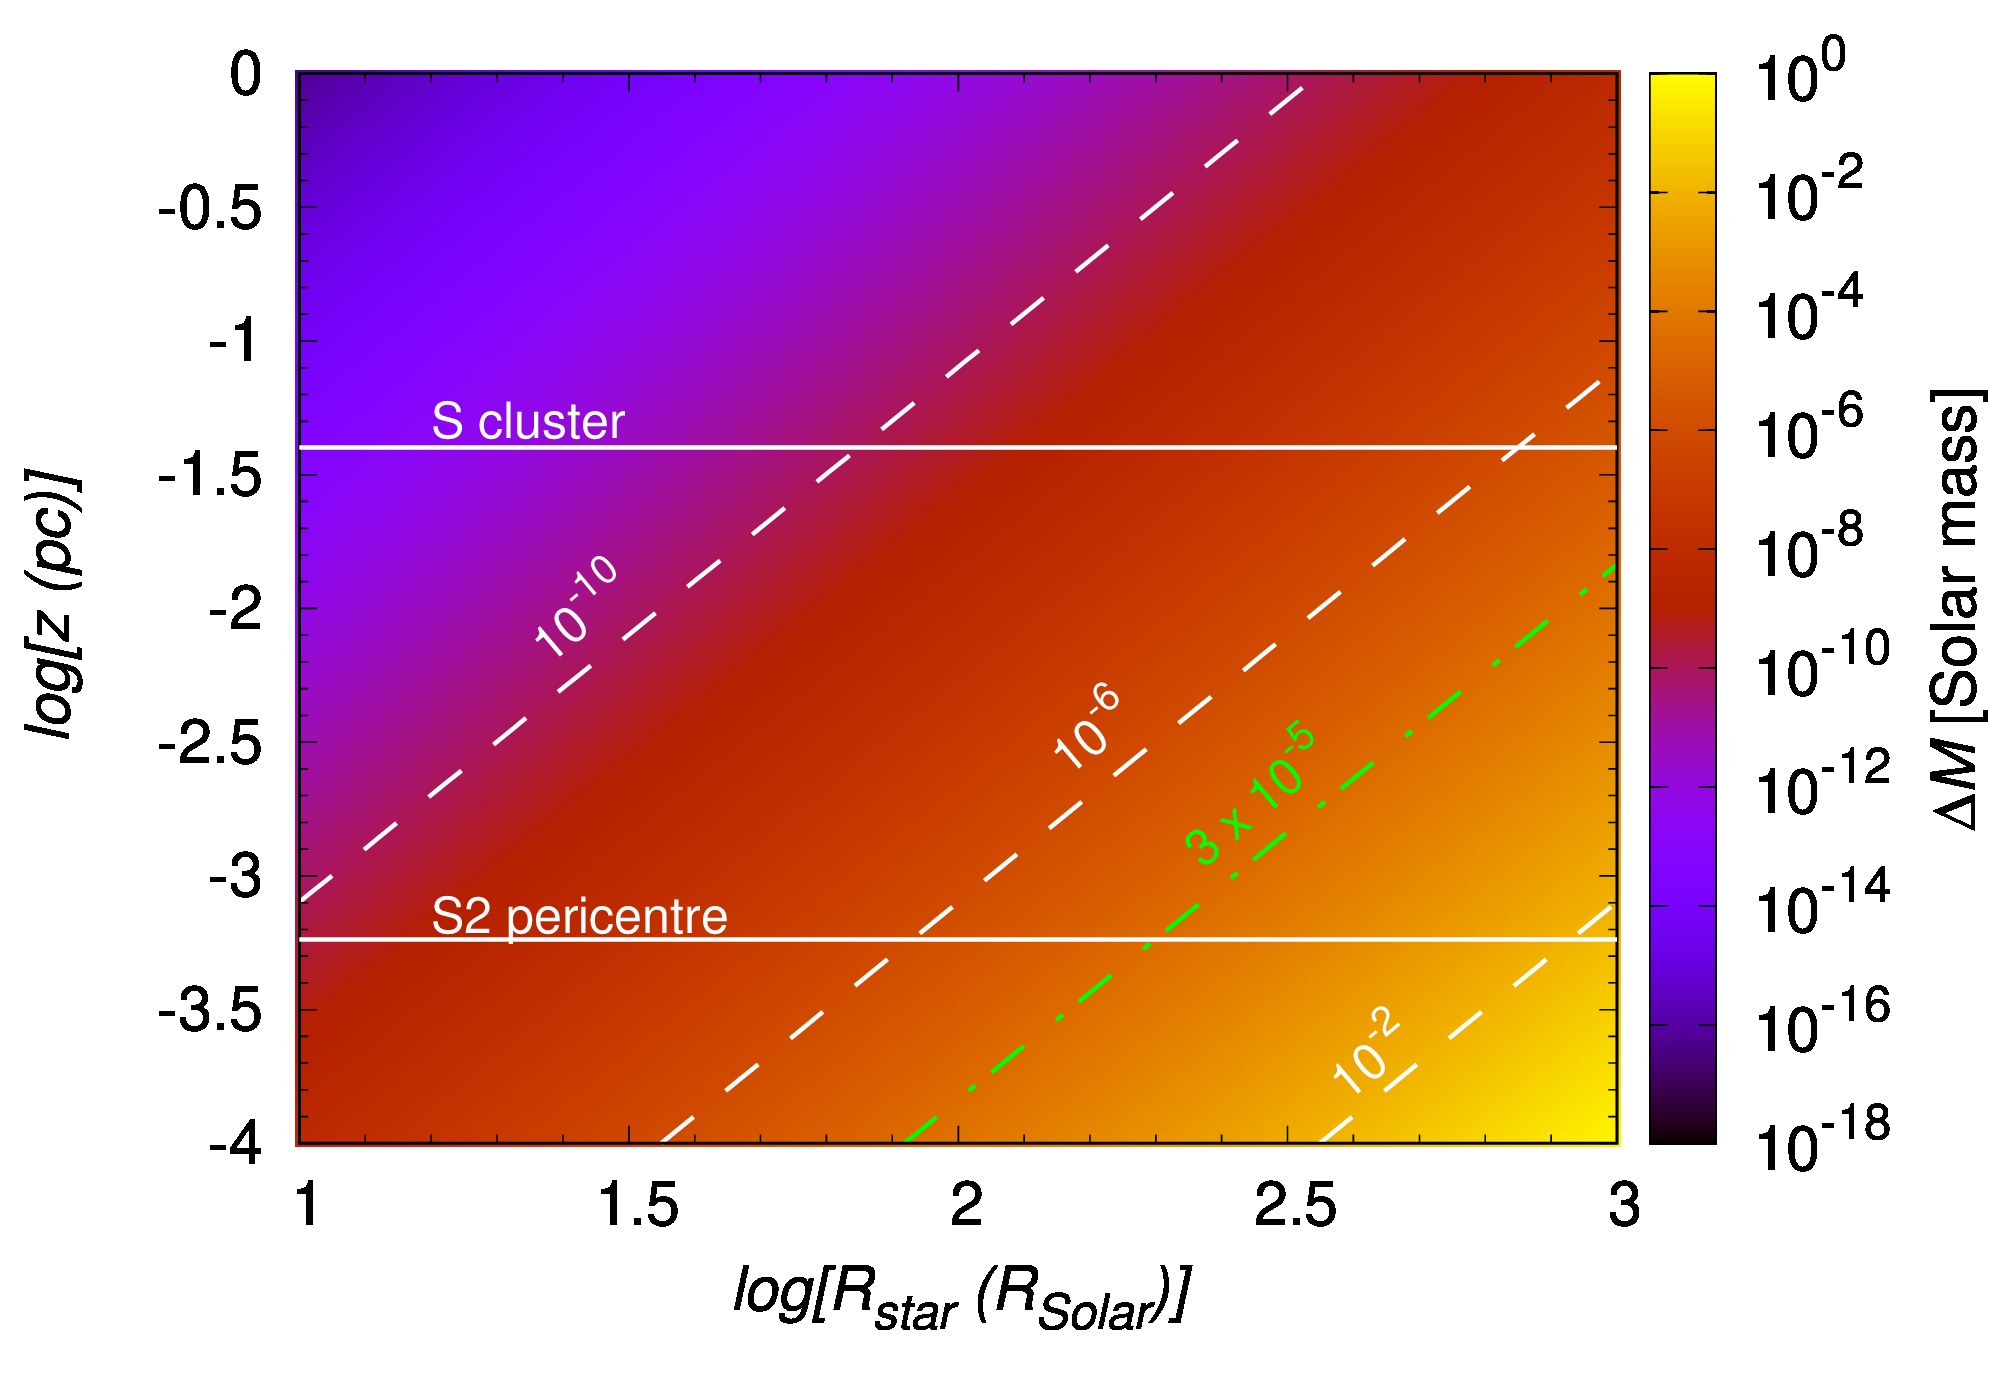
In Fig. 3 we plot . Note that and, therefore, the orbital dynamics is not significantly affected by the single passage through the jet. However, given that , the mass-loss can be about one thousandth to one hundredth of the mass of a star for the largest giants on the asymptotic giant branch with and distances an order of magnitude smaller than (see the yellowish region in Fig. 3). In fact, the value of discussed by Barkov et al. (2012a) for powerful blazars in connection to their very high-energy -ray emission can be reached in the Galactic center for red giants with radii at . Such a large mass-loss with a certain momentum with respect to the star can already have an effect on the orbital dynamics, taking into account repetitive encounters of the red giant with the jet. In other words, the mass removal takes place at the expanse of the kinetic energy of the star, which has implications for the dynamics of the nuclear star cluster, see also Kieffer & Bogdanović (2016) for discussion. In addition, already for jets with a lower power corresponding to the active phase of the Galactic center, jet-red giant interactions can affect the short-term TeV emission in these sources. These effects are beyond the scope of the current paper and will be investigated in our future studies.
The mass removal during a single jet encounter given by Eq. (14) can be considered as an upper limit since we assume that the cross-section of the star is given by its radius during the whole passage of the star through the jet, hence . However, this is only an approximation as realistically, during a few shock-crossing or dynamical timescales the ram pressure of the jet will shape the red giant and its detached envelope into a comet-like structure, see Fig. 1, for which the interaction cross-section is given by rather than by , which gives us a lower limit on the mass removal, . Using Eq. (6), can be expressed in terms of the basic parameters of the star and the jet and it can numerically be expressed by the same units as in Eqs. (14) and (6),
| (15) |
where we adopted as before. In comparison with in Eq. (14), which is proportional to , in Eq. (15) increases as . This implies that holds for , where at , . In other words, only at the mass removal due to the jet activity from the red giant atmosphere is possible, while at distances larger than , the jet ablation is limited to the stellar-wind material, as is the case for the observed comet-shaped sources X3, X7, and X8 (Mužić et al., 2010; Peißker et al., 2019). From Eq. (6), the relation for follows as,
| (16) |
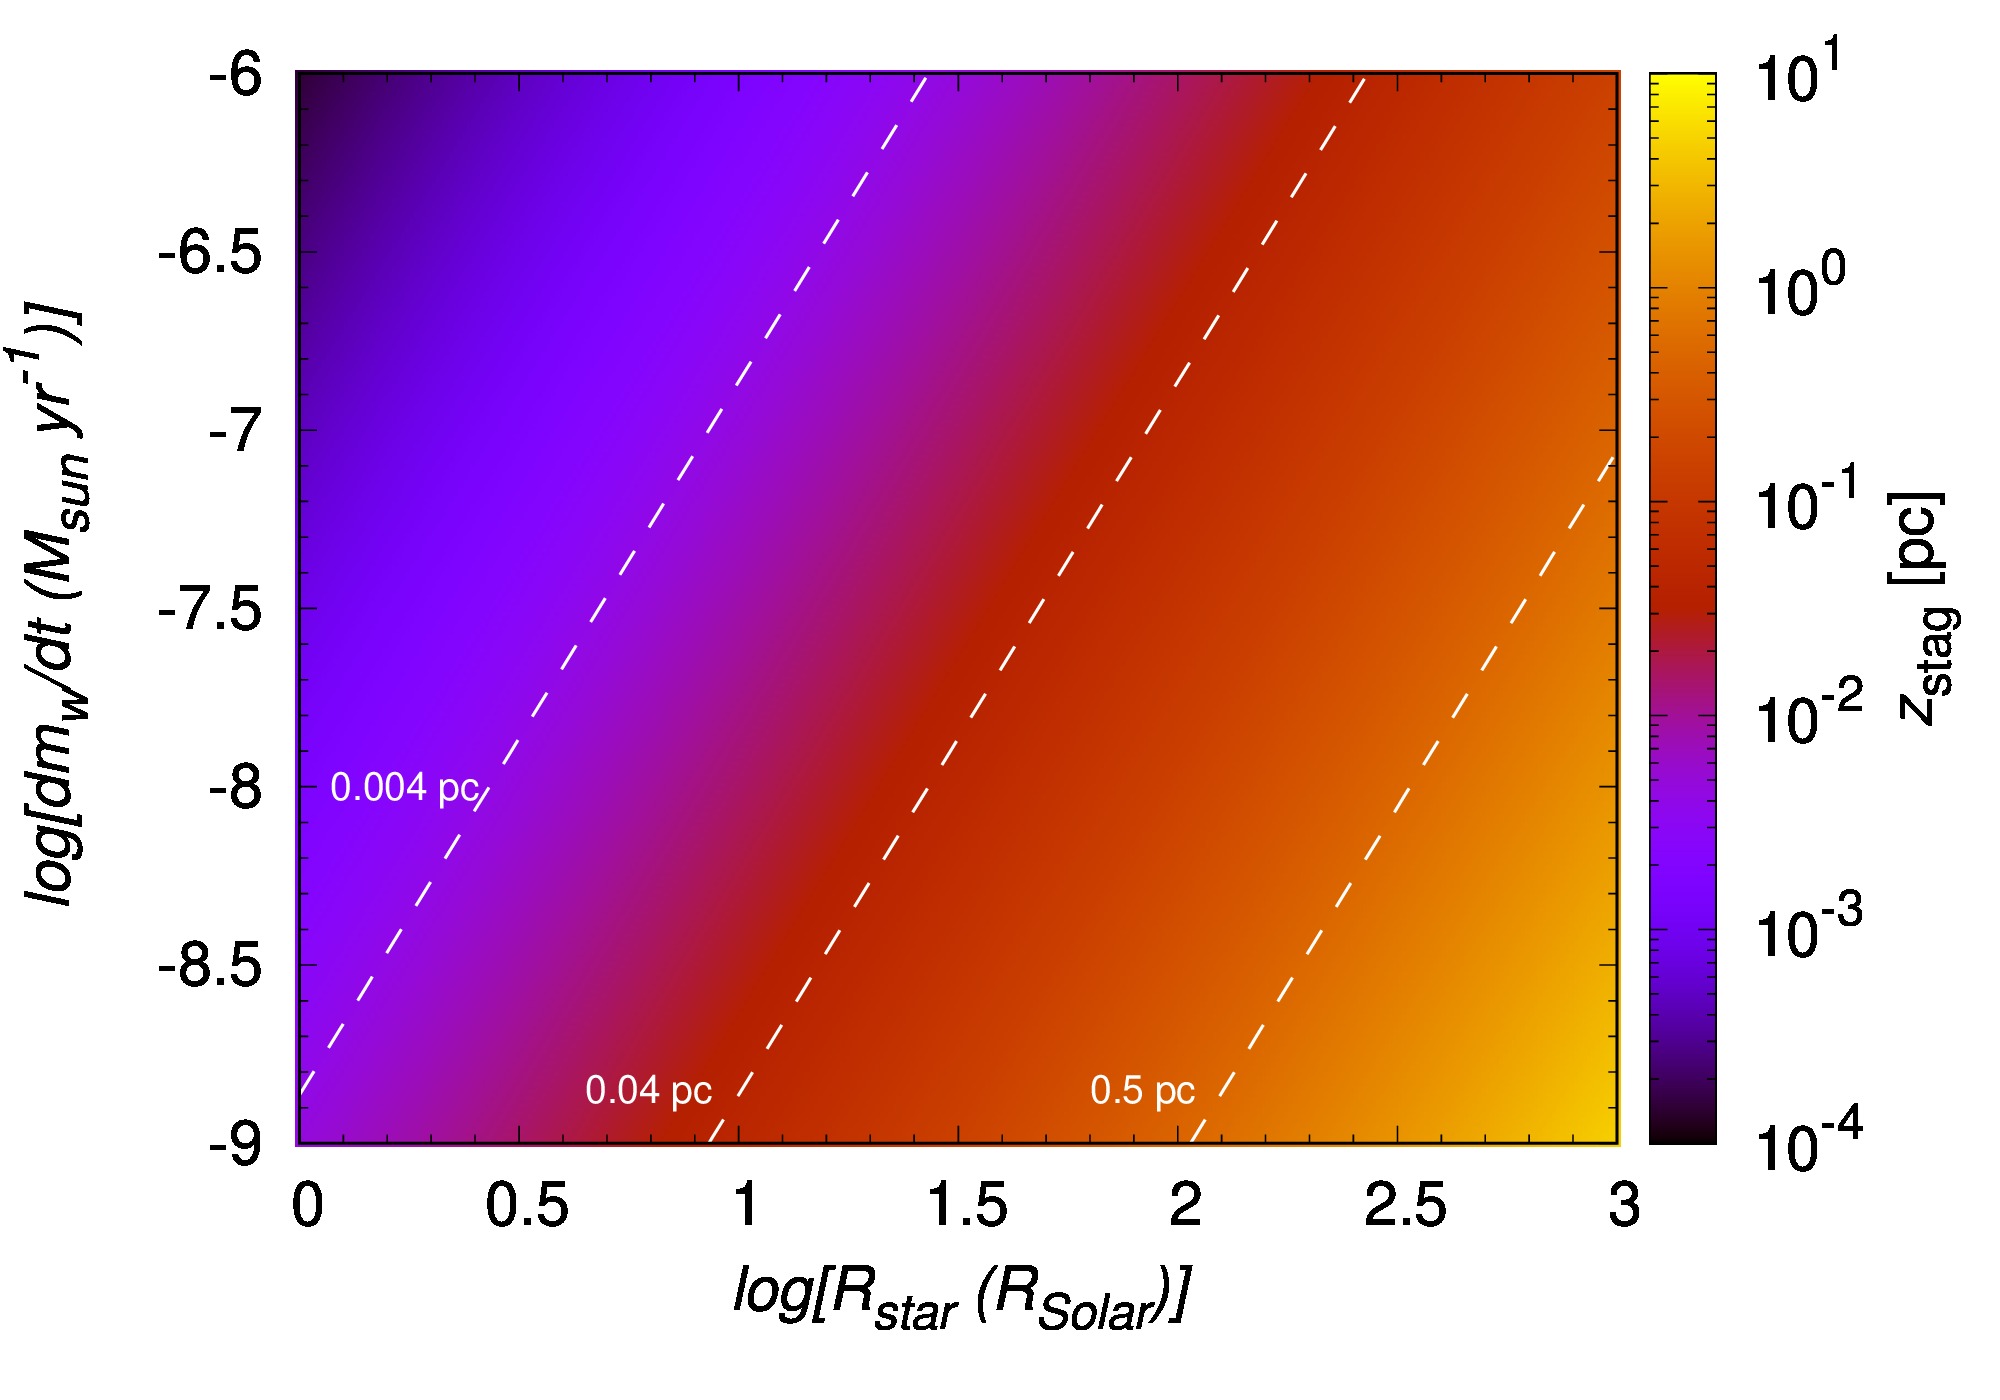
The dependence of on the stellar radius and the mass-loss rate is shown in Fig. 4 (left panel). It is apparent that the volume around the reactivated Sgr A*, where the jet-ablation can occur for a particular red giant, depends considerably on , which spans over three orders of magnitude depending on the evolutionary stage, (Reimers, 1987). In particular, for red giants with , shrinks from to as the mass-loss rate increases from to .
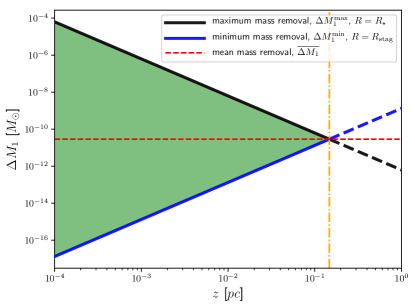
In Fig. 4 (right panel), we show an exemplary case for the mass removal range from the red giant atmosphere (red giant with the parameters of , , and ) due to the single crossing through the jet with the luminosity of and the opening angle of . Towards , the mass removal due to a single encounter approaches the mean value of ,
| (17) |
Because of the estimated several thousands of red giant–jet encounters according to Eq. (13), the cumulative mass loss from the red giant can be derived as , giving
| (18) |
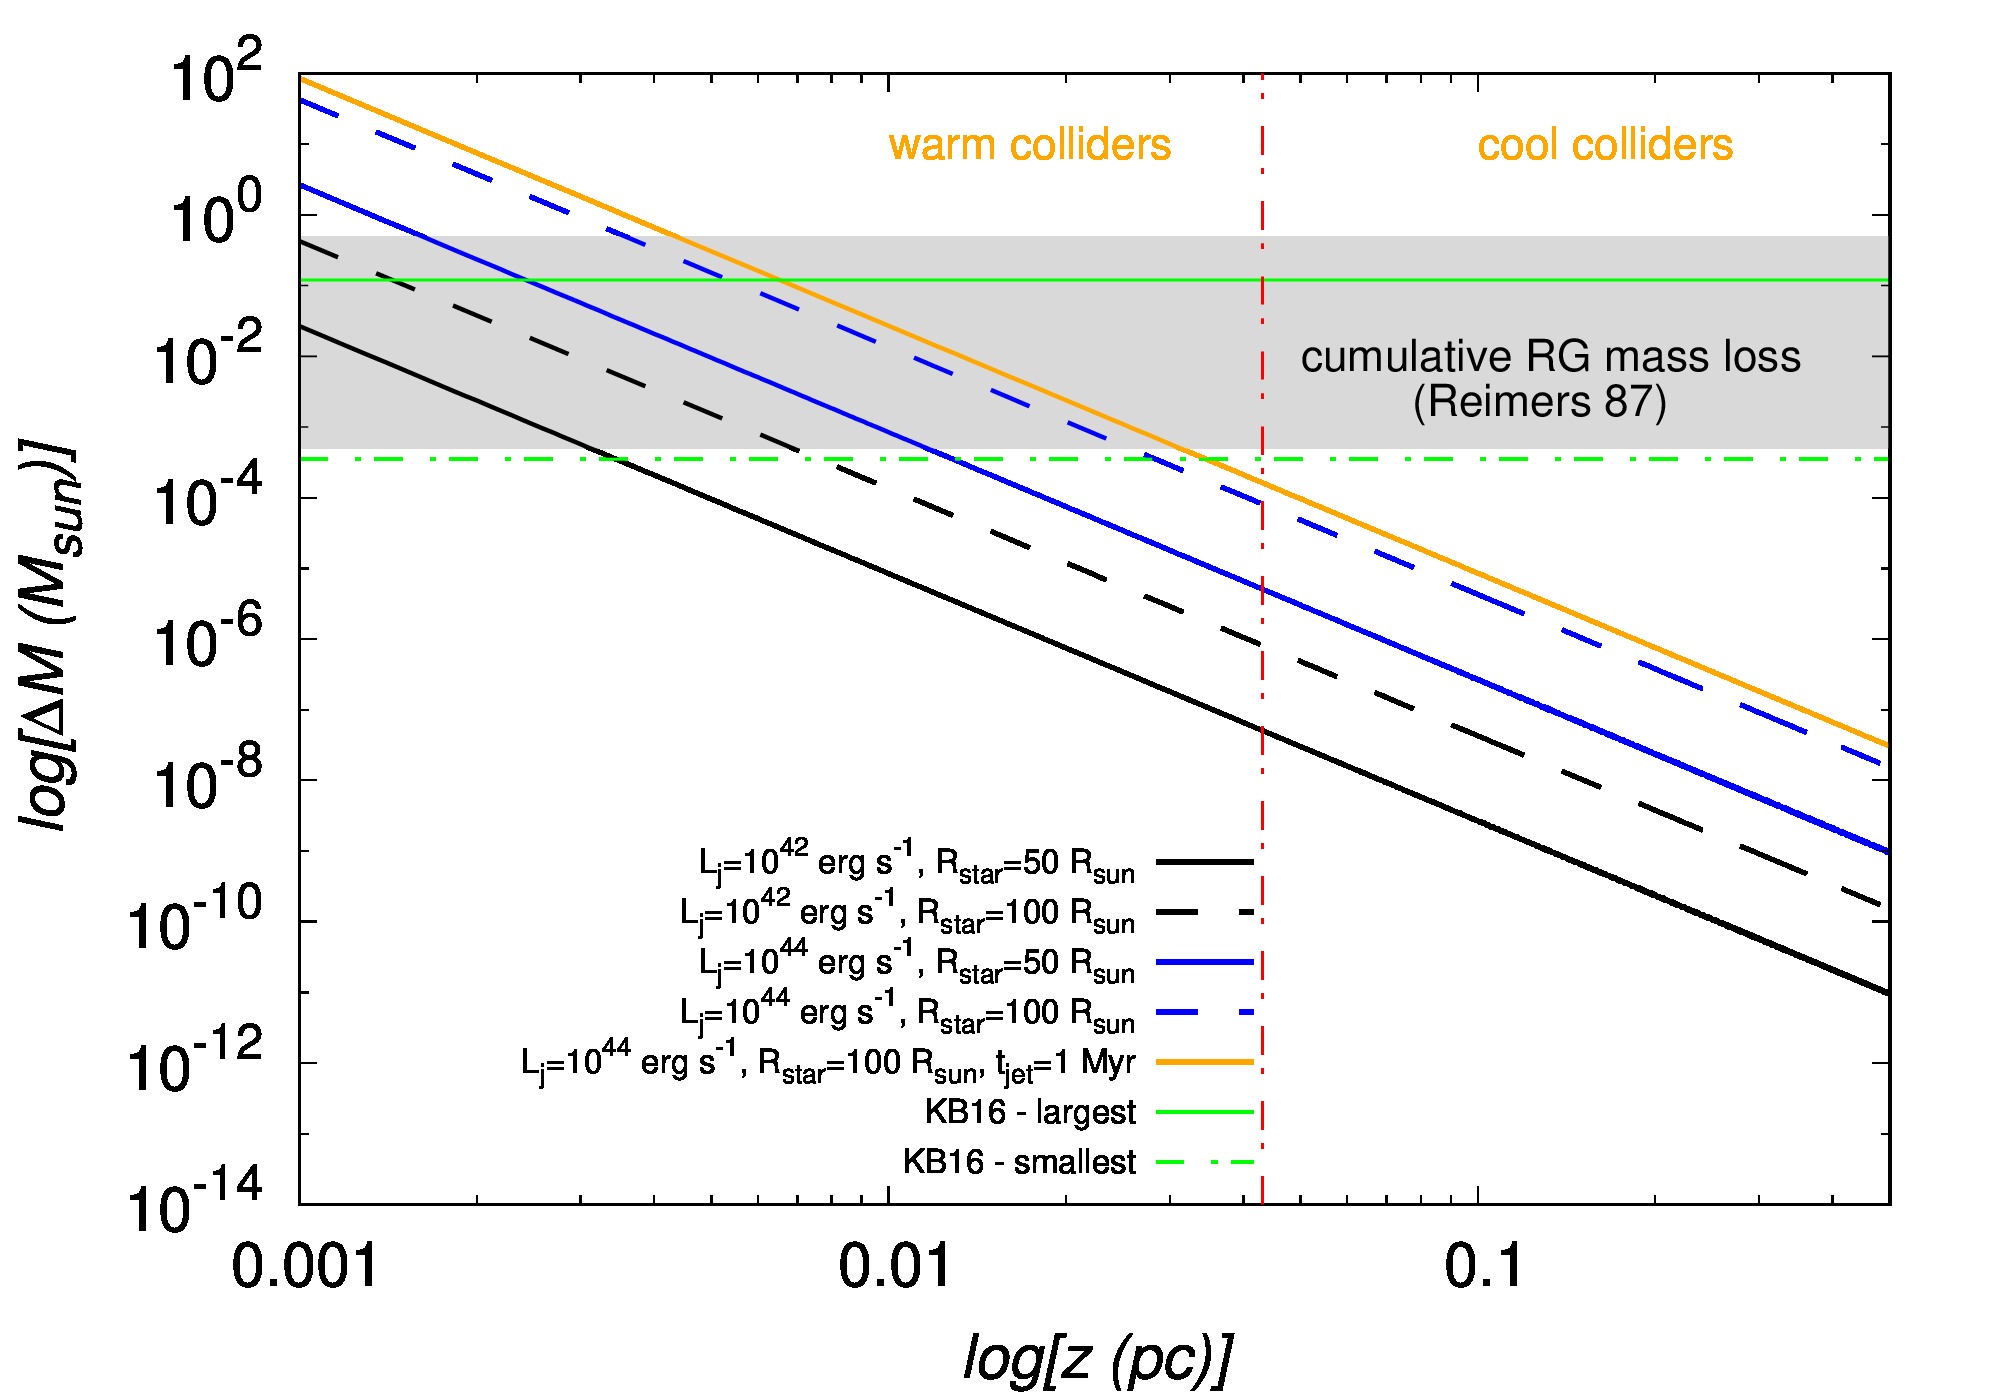
In Fig. 5, we plot for and , and and . Additionally, we plot for the longer jet lifetime of and and , which can be considered as an upper limit of for a red giant orbiting Sgr A*. We find that within the S cluster is comparable to the mass removal inferred from red giant–clump collision simulations by Kieffer & Bogdanović (2016). In Fig. 5, we plot the upper and the lower limits of obtained by Kieffer & Bogdanović (2016). Beyond , for the star–jet interaction is progressively smaller than , which implies that the jet impact on the stellar evolution is the most profound for S cluster red giants. In this region, there also lies the division between the warm and the cool colliders as discussed in Subsection 2.1, with warm colliders present inside , which is also marked in Fig. 5 with a vertical dot-dashed line. Since warm colliders are warmer and bigger, this further enhances the mass removal inside the S cluster. In addition, the mass removal due to the jet interaction is of a comparable order of magnitude as the mass loss expected from cool winds during the time interval of the active jet when (Reimers, 1987), as it is indicated by the shaded rectangle in Fig. 5. This implies that the jet–star interaction perturbs the stellar evolution of passing red giants, in particular in the innermost parts of the nuclear stellar cluster.
Note that, on one hand, is supposed to be a lower limit since after the first passage through the jet, the giant is expected to expand to an even larger radius before the next encounter, which increases the mass removal efficiency (Kieffer & Bogdanović, 2016). On the other hand, resonant relaxation of stellar orbits as well as a jet precession may change the frequency of the jet-star interactions (see Sections 4 and 6.1) and therefore should be considered as an upper limit of the number of encounters. Overall, in Eq. (18) can be applied as an approximation for the total mass removal due to the giant-jet interactions. Hence, the truncation of stellar envelopes of late-type stars by the jet during active phases of Sgr A* appears to be efficient and complementary to other previously proposed processes, mainly tidal disruptions of giants and stellar collisions with other stars and/or the accretion disc.
3 Missing red giants in the near-infrared domain
Red giants are post-main-sequence evolutionary stages of stars with initial mass . These stars exhausted hydrogen supplies in their cores and the hydrogen fusion into helium continues in the shell. As a result, the mass of the helium core gradually increases and this is linked to the increase in the atmosphere radius as well as the luminosity. Stellar evolutionary models of red giants show that their atmosphere radius and the bolometric luminosity depend primarily on the mass of the helium core as (Refsdal & Weigert, 1971; Joss et al., 1987)
| (19) |
where . This also holds for red supergiants with carbon-oxygen cores and burning hydrogen and helium in their shells (Paczyński, 1970). In the red giant stage, the dominant energy source is the p-p process and hence the luminosity is mainly determined by the growth rate of the helium core
| (20) |
Eqs. (19) and (20) imply that the bolometric luminosity is not significantly affected by the jet-red giant interaction, since only the tenuous shell is ablated by the jet and the dense core is left untouched. Then the effective temperature of the ablated giant is
| (21) |
where is the original effective temperature and and are the atmosphere radii before and after the truncation, respectively. Here we implicitly assume that the red giant underwent interactions with the jet during the active phase given by Eq. (13), which eventually leads to the decreased radius of according to Eq. (6). The luminosity in the infrared domain between frequencies and can be expressed using the Rayleigh-Jeans approximation444Strictly speaking, for , the condition applies for wavelengths longer than . as (see Alexander, 2005, for a similar analysis), which using Eq. (21) leads to
| (22) |
For instance, the ablation of a red giant atmosphere from 120 to 30 would result in the increase of effective temperature by a factor of 2 and a decrease by a factor of 8 in the IR luminosity or . The ablation of the envelope from 120 to 4 would result in the decrease by as much as . The difference of 2-5 magnitudes can already affect the count rate of late-type stars in the near-infrared domain in the central arcsecond of the Galactic center.
As an exemplary case, we set up a simplified temporal evolution of a red giant using Eqs. (19) and (20). We perform this calculation to estimate the potential difference in near-infrared magnitudes and the colour change for late-type stars before and after the active jet phase – it does not represent realistic stellar evolution tracks, but can provide insight into the basic trends in the near-infrared magnitude evolution and the effective temperature. We evolve the stellar luminosity and the radius for an increasing core mass , where and the time-step is . The overall evolution from to takes , when neither the effect of stellar winds nor that of rotation is taken into account. The initial and the final core masses were chosen according to the limiting values for lighter stars, , in which case and . These are stars with degenerate helium cores and hydrogen burning shells (Refsdal & Weigert, 1971). The lower core-mass value of 0.1 also approximately corresponds to the Schönberg-Chandrasekhar limit. The total duration is comparable to the time that stars of spend on the giant and the asymptotic giant branches, which is of the order of according to MacLeod et al. (2012).
To assess the observational effects of the star–jet collision in the near-infrared domain, we calculate the effective temperature at each step using . Subsequently, we calculate the monochromatic flux density in K-band (2.2 ) and L’-band (3.8 ) using , where is the spectral brightness given by the Planck function at the given effective temperature. The corresponding magnitudes are calculated using and , from which the color index follows as CI.
For the analysis in this section as well as in Section 5, we calculate intrinsic stellar magnitudes and . The calculated magnitudes and colours can then be compared to extinction-corrected magnitudes and the derived surface-brightness profiles of the nuclear star cluster, i.e. those corrected for the foreground extinction. To compare our results to observed magnitudes and derived surface profiles that are just corrected for the differential extinction but not for the foreground extinction (Buchholz et al., 2009; Habibi et al., 2019; Schödel et al., 2020), it is necessary to increase the magnitudes using the corresponding mean extinction coefficients (see e.g., Schödel et al., 2010), in particular mag and mag.
| Ablation distance [pc] | Ablation time [yr] | [] | [K] | [K] | [mag] | [mag] | |
| 0.001 | |||||||
| 0.01 | |||||||
| 0.1 | |||||||
| normal evolution | - | (final radius) | - | - |
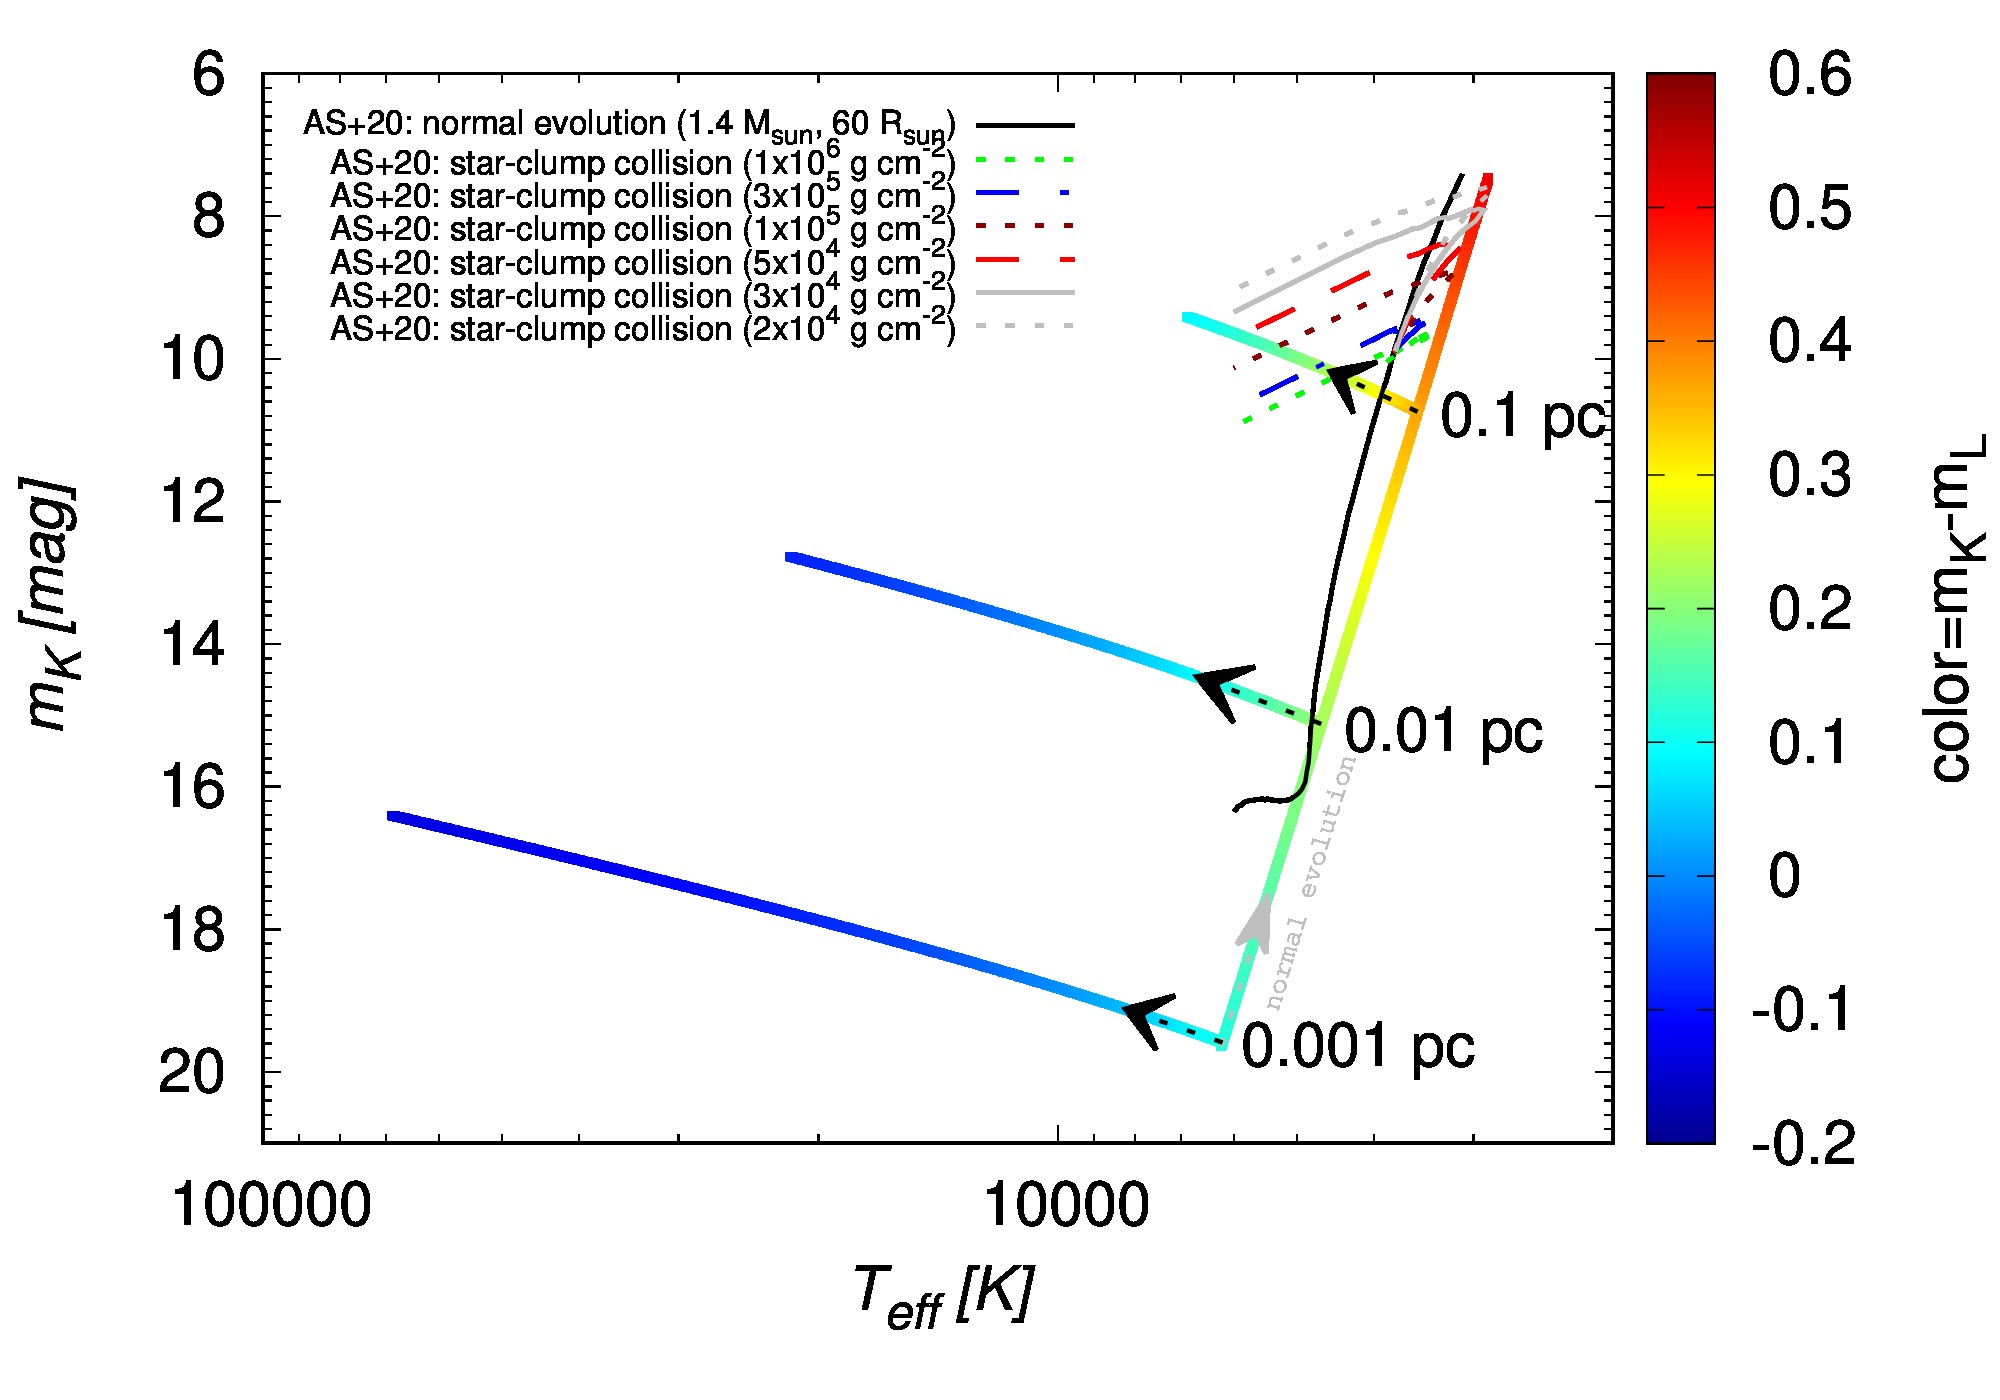
The imprint of the ablation of the stellar atmosphere by a jet, whose kinetic luminosity is fixed to , is modelled by assuming that the radius of an interacting red giant keeps evolving according to Eq. (19) when at a given distance from Sgr A*. After the stellar radius reaches the scale of the stagnation radius at a given distance , we set for the rest of the evolution which can by justified by the fact that the red giant propagates through the jet -times and the envelope is removed after repetitive encounters. The expected number of encounters is , , and for , , and , respectively; see Eq. (13). In Fig. 6 we show three magnitude–effective temperature curves of the ablated red giants that underwent repetitive encounters with the jet at their orbital distances of , , and from Sgr A*, which led to their truncation to a smaller radius close to the corresponding stagnation radius at a given distance. In addition, we compare the magnitude–temperature curves of ablated giants with an unaffected evolution. We list the stellar parameters at the time of the atmosphere truncation when at the corresponding distance as well as the parameters for the final state of ablated giants in Table 1. This is compared to an unaffected final state with the core mass of ; see the bottom row of Table 1. The basic signature of the jet-star interaction is that the star gets progressively warmer (with a bluer, more negative color index) and fainter in the near-infrared -band in comparison with the normal evolution without any atmosphere ablation. This trend is more apparent for red giants that are closer to Sgr A* because of the smaller jet-star stagnation radius and hence a larger fraction of the stellar atmosphere that is removed.
Although we do not calculate stellar evolutionary tracks, only basic trends in terms of near-infrared magnitude and effective temperature, our results are consistent with those of Amaro-Seoane et al. (2020) who calculated evolutionary tracks specifically for late-type stars ablated due to the red giant–accretion clump collisions. They show in their Fig. 2 that the collision affects the stellar evolution of a red giant in a way that after repetitive encounters it follows a track along a nearly constant absolute bolometric magnitude towards higher effective temperatures. The constant absolute bolometric magnitude or bolometric luminosity in combination with an increasing effective temperature results in the drop in the near-infrared luminosity, since . We used their evolutionary tracks calculated using the CESAM code (Morel & Lebreton, 2008) for estimating -band near-infrared magnitudes. These tracks are depicted in Fig. 6 for the case of a normal evolution of a star with and (black solid line) and different collision cases for clumps with surface densities in the range (see the legend). Qualitatively, the perturbed stellar evolutionary tracks follow the temperature trends that we can also observe for giant–jet collisions: ablated giants move towards higher effective temperature. Also, they become fainter in the near-infrared domain in comparison with an unperturbed evolution. The main difference in comparison with the analysis of Amaro-Seoane et al. (2020) is their trend towards larger magnitudes (stars become fainter), while we see a small gradual increase in brightness. This difference is due to our simplying assumption of a constant radius after the series of collisions with the jet, while in reality the radius should evolve, especially after the jet ceases to be active. Since , the near-infrared luminosity grows linearly with increasing temperature for the fixed stellar radius. This motivates further exploration of the effect of star–jet collisions using a modified stellar evolutionary code.
For asymptotic giant branch stars, an extreme transition from a red, cool luminous giant to a hot and faint white dwarf is possible when it is completely stripped off of its envelope. This was studied by King (2020) for tidal stripping close to the SMBH, but cannot be excluded also for asymptotic giant-branch stars and jet collisions for a case when the giant star is at milliparsec separation from Sgr A* and less, in which case the stagnation radius is typically a fraction of the Solar radius. In fact, an active jet can enlarge the volume around the SMBH where asymptotic giant-branch stars are turned into white dwarfs. Considering Eq. (6), we can derive that in order for to be of the order of a white-dwarf radius , the giant needs to orbit the SMBH at so that the jet with can truncate it down to the white-dwarf size. The stellar interior that is not affected by tidal forces is characterized by the Hill radius
| (23) |
from which we see that tidal forces alone will not truncate the giant down to its white-dwarf core since at .
In summary, the jet-star interaction could have affected the appearance of late-type giants in the central arcsecond by making them warmer or bluer in terms of a colour and hence fainter in the near-infrared domain.
4 Fraction of red giants interacting with the jet
We estimate the number of late-type stars, i.e. stars that form a cusp, that could have passed and interacted with the jet during its estimated life-time of (Guo & Mathews, 2012). For the density distribution of late-type stars in the inner , we adopt a cusp-like power-law distribution , with , , and (Gallego-Cano et al., 2018). The expected number of late-type stars within a certain distance is
| (24) |
giving and 25.8 inside 0.3 and 0.04 pc, respectively. The number of stars inside the jet at any time is given by the jet covering factor in a spherical volume . By considering a conical jet and a counter-jet with the total volume , the covering factor is and the number of red giants inside the jet is . Then the average number of red giants that are simultaneously inside the jet is and inside 0.3 pc and 0.04 pc, respectively.
To estimate the number of stars crossing the jet per an orbital timescale, we first calculate the jet-crossing rate per a unit of time. Since we focus on the region , which is well inside the radius of influence of Sgr A*, (Merritt, 2013), we approximate the stellar velocity dispersion by the local Keplerian velocity, ; see e.g. Šubr & Haas (2014). With the jet cross-section , the number of late-type stars entering both the jet and the counter-jet per a unit of time is
| (25) |
The number of red giants crossing the jet per orbital timescale is
| (26) |
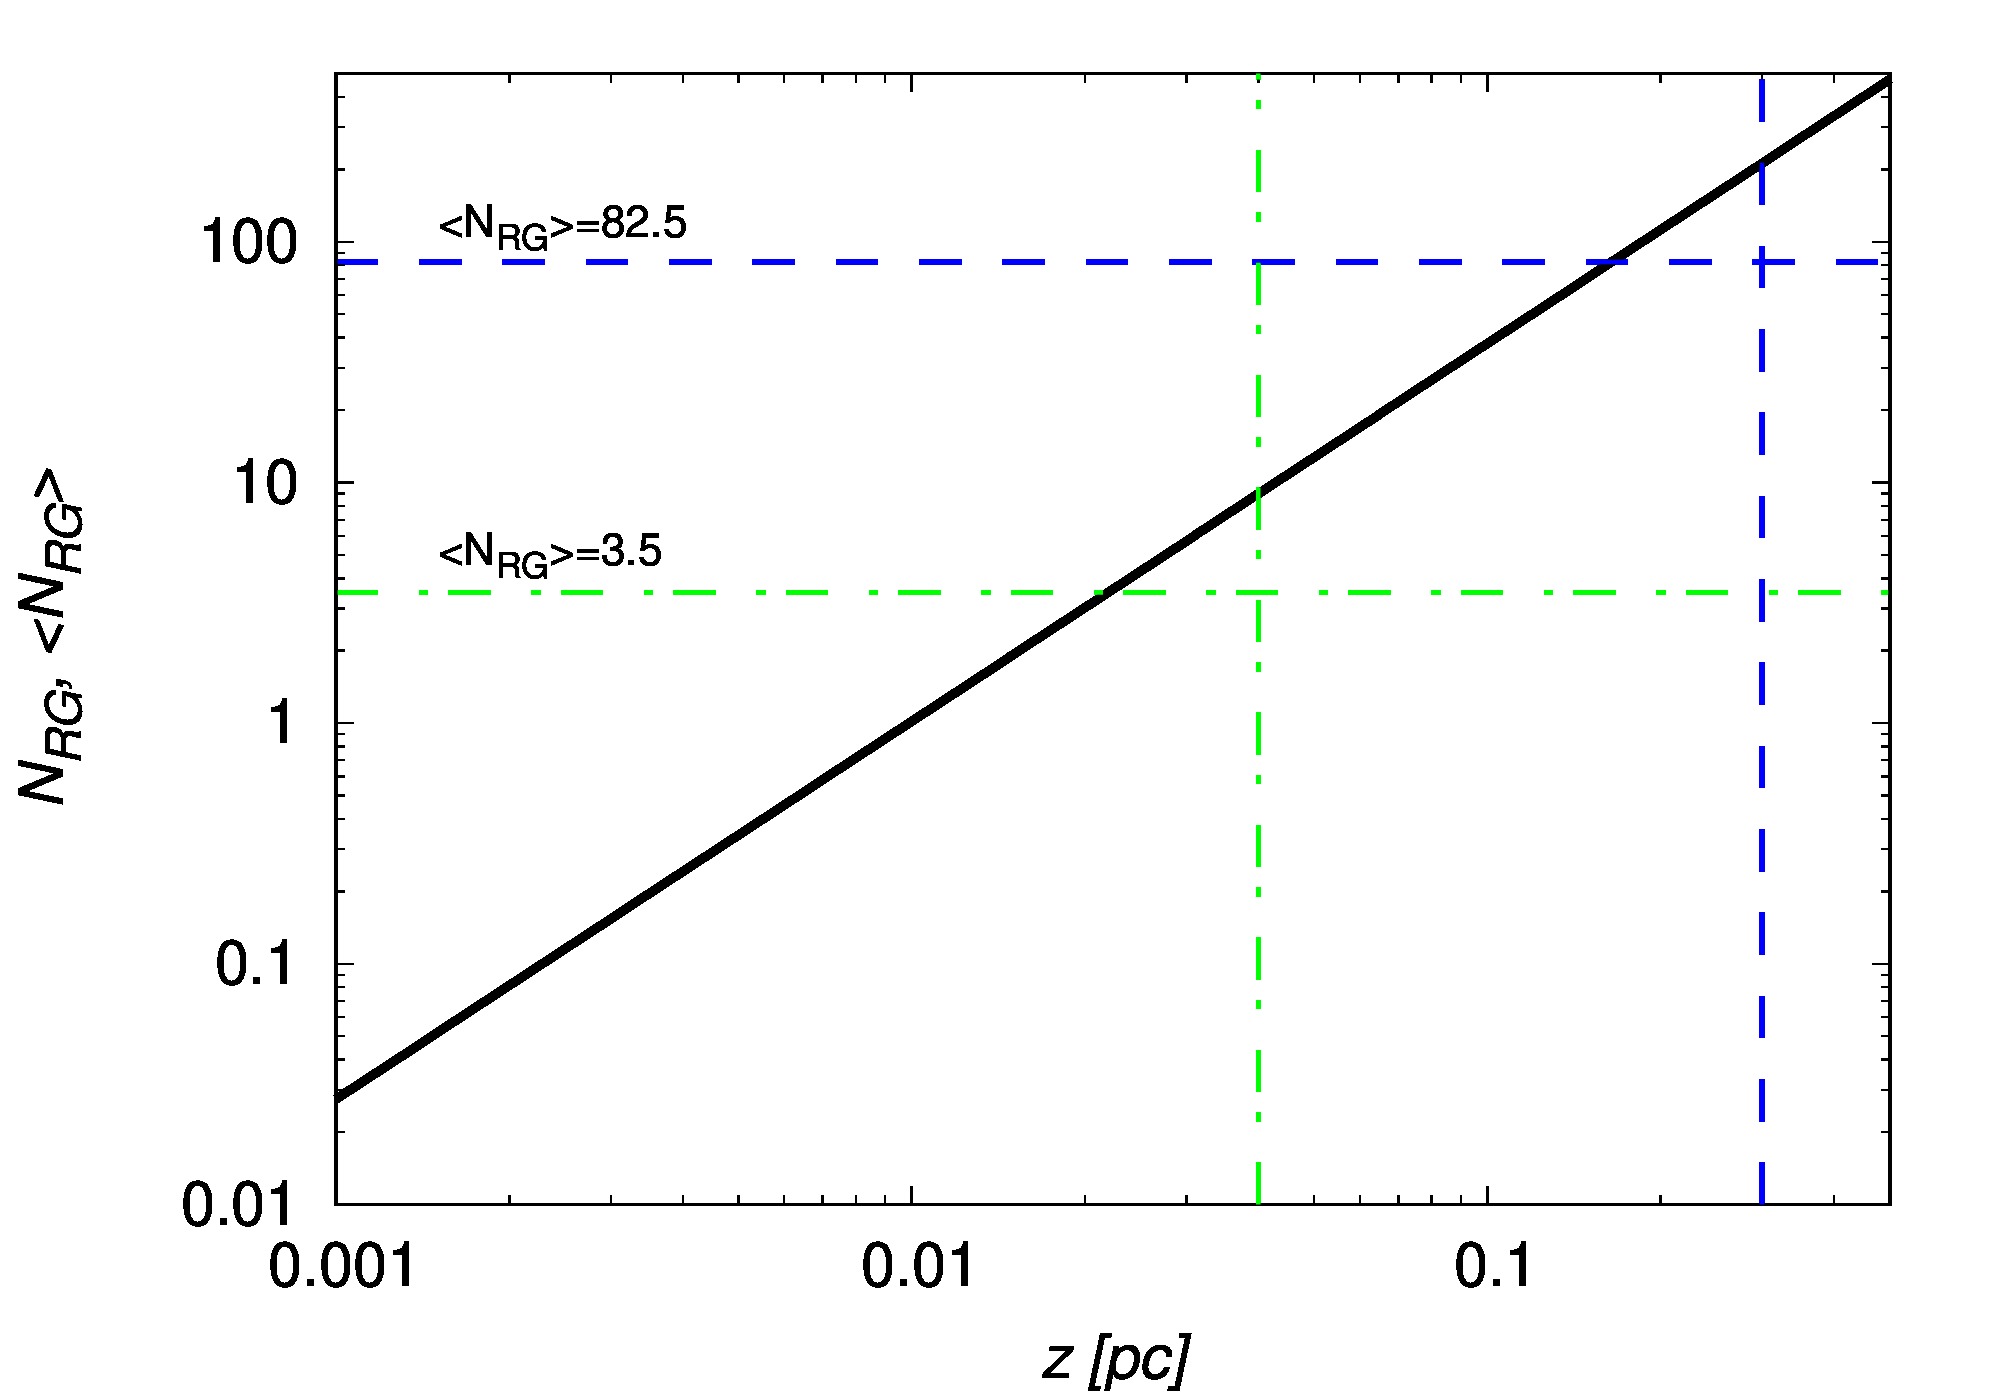
where the orbital period in the sphere of influence of the SMBH follows from the third Keplerian law, . In Fig. 7 we plot . The average number of crossing giants per orbital period in the region with an outer radius is
| (27) |
In particular, and when (S cluster) and , respectively (see Fig. 7).
In this case, represents all late-type stars that cross the jet sheath per orbital period on average. The fraction of giants whose envelopes could have been stripped off by the jet can be estimated by comparing the radii of stars with the corresponding stagnation radius at a certain distance from Sgr A*. The basic condition for the ablation is that at a given from Sgr A*. In particular, for and the jet luminosity of , the minimum stellar parameters for ablation are , , , , mag, where denotes the upper magnitude limit, below which stars are expected to be affected by the jet. Using the K-band luminosity function approximated by the power law, with for late-type stars (Buchholz et al., 2009; Pfuhl et al., 2011) between 12 and 18 mag, we can estimate the fraction of ablated stars as , where is the limiting magnitude, which we set to 18 mag according to Pfuhl et al. (2011). Then for and we get . For the larger distance and , we obtain the minimum parameters of ablated stars as follows, , , , , mag with . The limiting values and the percentage of ablated giants are quite sensitive to the jet luminosity. Increasing to , we get , , , , mag with for and , , , , mag with for . We summarize the relevant values in Table 2. Although the fraction of affected late-type stars is small, it significantly affects brighter stars with smaller magnitudes – stars brighter than 14 mag constitute of the total observed sample and stars brighter than 12 mag constitute only . We explicitly show the change in the projected brightness distribution for brighter stars in Section 5.
| Distance | ||
|---|---|---|
| , , | , , | |
| , , | , , |
The jet-ablation could partially have contributed to the inferred 4-5 missing late-type giants in the region with (Habibi et al., 2019) as well as to the missing late-type giants in the larger region with (Gallego-Cano et al., 2018), especially for higher luminosities of the jet.
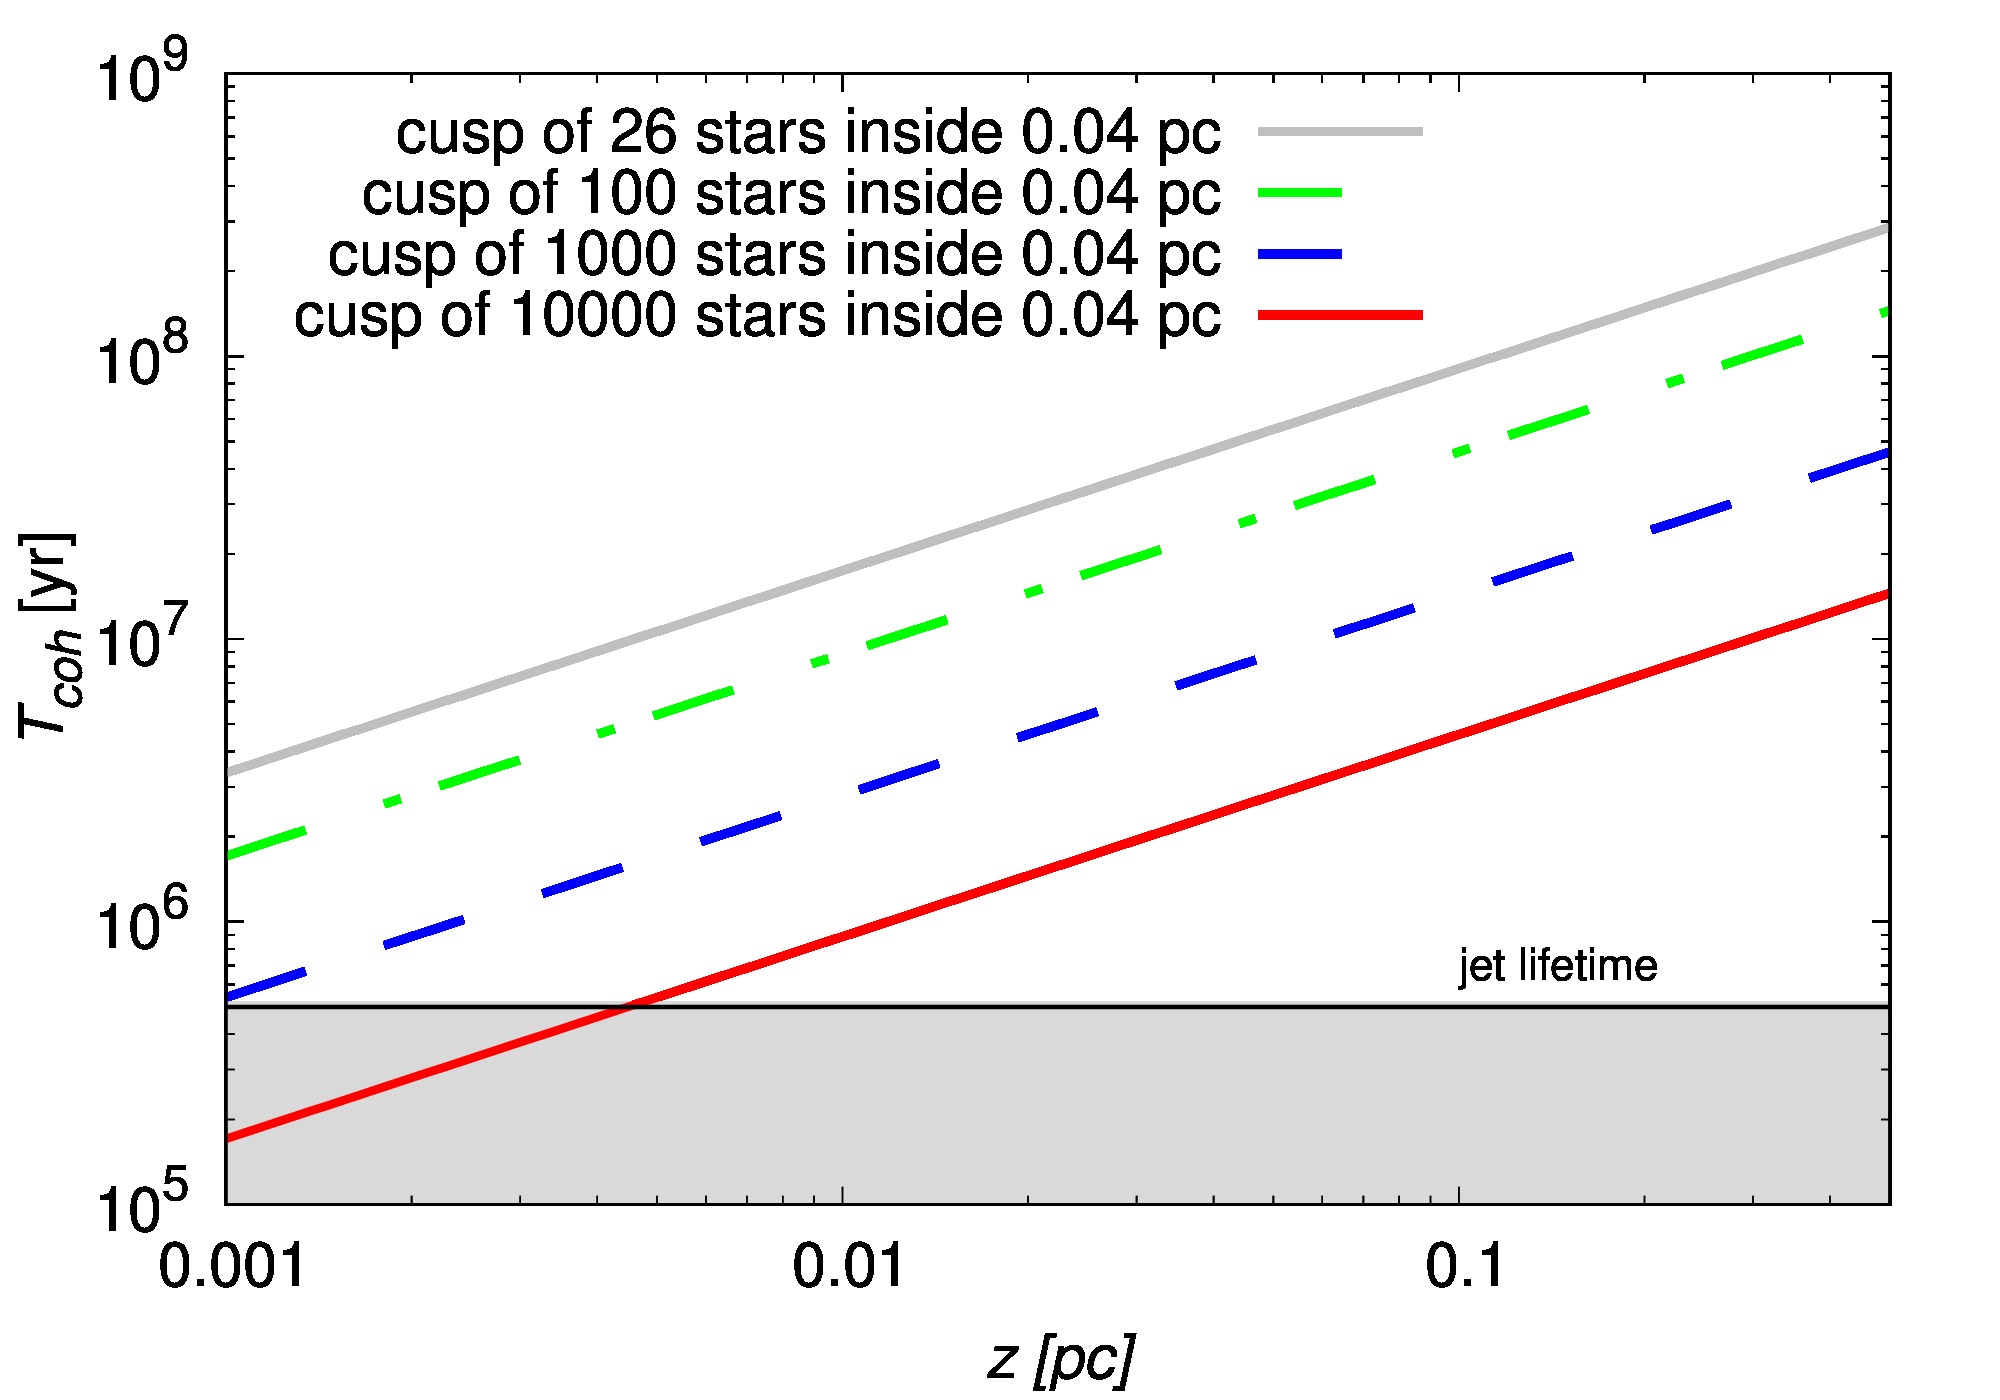
The number of stars that can interact with the jet is increased via dynamical processes in the dense nuclear star cluster. In particular, the vector resonant relaxation (VRR) changes the direction of the orbital angular momentum (Alexander, 2005; Merritt, 2013), and therefore stars that were not passing through the jet can do so on the resonant-relaxation timescale. More precisely, in the sphere of influence of the SMBH, stars move on Keplerian ellipses and the gravitational interactions between stars are correlated. Given the finite number of stars, there is a non-zero torque on a test star. During the time interval , for which and the coherence timescale
| (28) |
is inversely proportional to the square root of the number of enclosed stars, the angular momentum of a test star changes linearly with time.
The inclination of stellar orbits would change by only when and hence essentially all late-type stars could interact with the jet during its lifetime. The estimated number of enclosed stars in the S cluster () is , where the lower limit considers only late-type stars according to the analysis by Habibi et al. (2019) and the upper limit stands for all the stars including compact remnants. The upper limit is supposed to be closer to the actual number of stellar objects since the number of old neutron stars and stellar black holes in the central arcsecond could be of that order of magnitude (Morris, 1993; Deegan & Nayakshin, 2007; Zhu et al., 2018). The total number of massive objects naturally affects the coherence timescale by more than an order of magnitude. In Fig. 8 we plot . We see that when and more, is comparable to the lifetime of the jet in the inner parts of the S cluster. In summary, the coherent resonant relaxation makes the number of affected giants bigger and the estimates per orbital timescale can be considered as a lower limit. Another more hypothetical effect that can enlarge the number of affected giants is the jet precession (see Section 6.1).
The vector resonant relaxation can affect the number of encounters, , see Eq. (13). In case , i.e. for a smaller number of enclosed objects (), is still mainly determined by , see Eq. (13). However, then the mean number of interacting giants is also not significantly enlarged. On the other hand, if , then is reduced approximately by a factor of , which assumes that the angular momentum vector shifts linearly with time during . In that sense, the interaction timescale with the jet is . Considering , the number of crossings is
| (29) |
which is smaller by an order of magnitude in comparison with .
5 Effect of jet-ablation on surface brightness profile of NSC
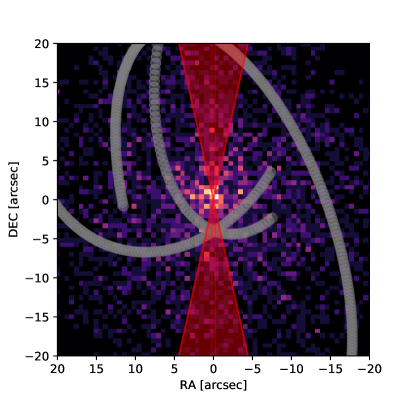
To assess the observational signatures of the jet-ablation of late-type stars, we generate a mock spherical cluster of stars. Their initial spatial distribution follows with , , and (Gallego-Cano et al., 2018). This spatial profile suggests that there are in total late-type stars inside the inner one parsec, which we generate using the Monte Carlo approach to form a mock Nuclear Star Cluster (NSC), see Fig. 9 (left panel) for illustration.
Each star is assigned its mass in the range from to following the Initial Mass Function (IMF) according to Kroupa (2001), i.e.
| (30) |
The Chabrier/Kroupa IMF is a good approximation for the observed mass distribution of the late-type NSC population (Pfuhl et al., 2011).
In the next step, we assigned the core mass to each star of the mock cluster. Here we fix the ratio between the core mass and the stellar mass to , which is in between the value inferred from the Schönberg-Chandrasekhar limit555The Schönberg-Chandrasekhar limit expresses the ratio between the isothermal core mass and the stellar mass, , where and are mean molecular weights for the envelope and the isothermal core, respectively. and the final phases of the stellar evolution, where the white-dwarf core constitutes most of the mass for the Solar-type stars. For more precise simulations, core masses from the stellar evolution of the NSC should be adopted, however, here we are interested in the first-order effects of the jet activity on the surface brightness distributions.
To construct the surface brightness profiles of the late-type population after the active jet phase in different magnitude bins, we followed these steps:
-
1.
We calculated and using Eq. 19.
-
2.
If the jet was set active with a certain luminosity , we compared and for a given distance of the star. If , then we set . In this case we also implicitly assumed that at a given distance, all of the stars, for which , are eventually ablated by the jet, hence the resonant relaxation was assumed to be efficient and hence .
-
3.
We estimated the effective temperature of a star using .
-
4.
From the Planck function we calculated the monochromatic flux in the -band () and the corresponding apparent magnitude (dereddened).
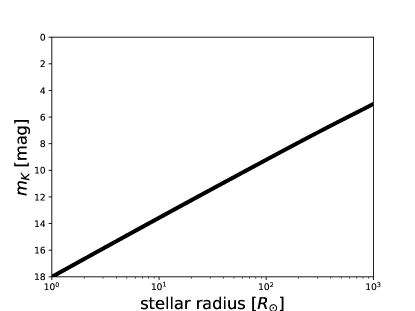
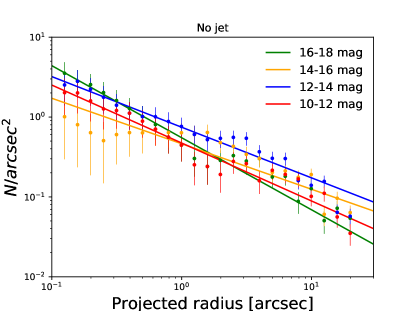
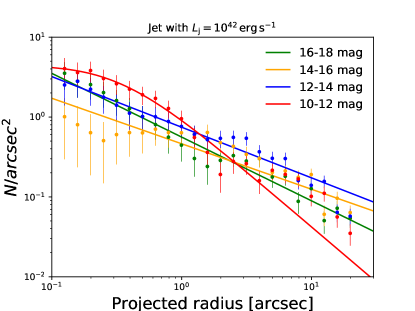
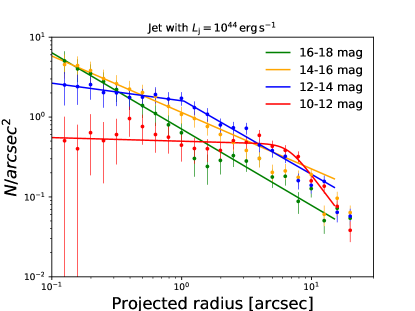
The initial relation between the -band magnitude and the stellar radius is shown in Fig. 9 in the right panel. We calculate the projected stellar density using the concentric annuli with the mean radius and the width of , , where is a number of stars in an annulus. We estimate the uncertainty of the stellar number counts as . Subsequently, we construct the surface stellar profiles in two-magnitude bins starting at mag up to mag, i.e. in total four bins; see Fig. 10. In the top left panel of Fig. 10, we plot the nominal projected distribution without considering the effect of jet. The brightness profile for all four magnitude bins can be approximated by simple power-law functions, , whose slopes are listed in Table 3. Hence, the initial cluster distribution is cusp-like. In the top right panel, we show the case with an active jet with the luminosity of . We see that the profile for the brightest stars in the 10-12 mag bin becomes flat in the inner arcsecond and can be described as a broken power-law function, , where is a break radius, is a slope of the inner part, marks the slope of an outer part, and denotes the sharpness of transition. The larger surface brightness values for this magnitude bin may be interpreted by an extra input of ablated giants with the initial magnitudes mag that after the ablation fall into bins with a larger magnitude. Finally, we increase the jet luminosity to , which makes the flattening of the brightest giants even more profound. The stars in the 12-14 mag bin also exhibit a flatter profile inside the inner arcsecond for this case, which shows the significance of the jet luminosity in affecting the observed surface profile of the NSC. We list the power-law slopes for both a simple and a broken power-law function and the break radii, where available, for all the magnitude bins and the three jet-activity cases in Table 3.
Fig. 10 demonstrates a potential signature of the jet activity on the surface profile of the NSC. It is important to study differential profiles, i.e. the distribution in different magnitude bins, since the lower-luminosity jet starts affecting the profile of bright stars (smaller magnitudes), while with an increasing jet luminosity, the fainter stars become affected as well, starting at smaller projected radii (). Our Monte-Carlo simulation suggests that the active jet phase with likely affected the late-type stars with mag that exhibit the flat profile inside the inner arcsecond. The fainter stars of mag can still keep a cusp-like profile after the jet ceased its enhanced activity.
For better quantitative comparisons with observations, it is necessary to include the stars of different ages and hence different core masses. This is rather complex as there were recurrent star-formation episodes in the NSC, with of the stellar mass being formed 5 Gyr ago, the minimum in the star-formation rate close to 1 Gyr, and the renewed star-formation in the last 100-200 million years, although with the ten-times lower star-formation rate than at earlier episodes (Pfuhl et al., 2011). These findings were confirmed by Schödel et al. (2020), who estimate that 80 of stars formed 10 Gyr ago or earlier, then about 15 formed 3 Gyr ago, and the remaining fraction in the last 100 Myr. Furthermore, the dynamical effects such as the mass segregation and the relaxation processes could also have played a role in shaping the final observed profile of the NSC, and in addition we might expect other bright-giant depletion processes (Alexander, 2005). Despite these difficulties in comparing theoretical and observed profiles, the basic trend shown in Fig. 10, in particular for (bottom panel), is consistent with the observational findings of Schödel et al. (2020), who found cusp-like profiles for all magnitude bins apart from mag bin (including foreground field extinction), which shows a flat/decreasing profile in their analysis. In our panels in Fig. 10, this corresponds to the dereddened bins 10-12 and 12-14 mag, whose profiles become affected for starting from the projected radii below one arcsecond. However, Schödel et al. (2020) also note that precise surface profiles for late-type stars are difficult to construct due to the contamination at all magnitude bins by an unrelaxed population of young stars. Habibi et al. (2019) report a cusp-like profile for late-type stars of mag (including foreground extinction), which approximately corresponds to our bin of 14-16 mag (yellow points) that maintains the cusp-like profile even for the largest jet luminosity (bottom panel). In conclusion, the expected trend of preferential depletion of bright late-type stars by the jet is confirmed.
| Magnitude bin | No jet | Jet | Jet |
|---|---|---|---|
| 18-16 mag | single: | single: | single: |
| 16-14 mag | single: | single: | single: |
| 14-12 mag | single: | single: | broken: , , |
| 12-10 mag | single: | broken: , , | broken: , , |
6 Discussion
We investigated the effects of a jet during an active phase of Sgr A* in the last million years on the appearance of late-type giant stars with atmosphere radii more than 30. We found that especially in the innermost arcsecond of the Galactic center (the S-cluster), the upper layers of the stellar envelope could be removed by the jet ram pressure. Hence, the jet-red giant interactions during the active phase of Sgr A* could have contributed to the depletion of bright late-type stars. In other words, the atmosphere ablation by the jet would alter the red giant appearance in a way that would make them look bluer and fainter in the near-infrared bands (mainly K’ and L bands), in which stars in the Galactic center region are generally monitored. In the following, we outline several additional effects that could be associated with the jet/RG interaction.
6.1 Enlarging the number of affected stars by the jet precession
Jet precession is a phenomenon that accompanies the launching of jets during the evolution of galaxies and stellar binaries. It is caused by perturbations due to the misalignment of the accretion flow and the black hole spin, so-called Lense-Thirring precession, or by a secondary black hole. The jet precession was proposed to explain a long-term flux variability in radio galaxies, e.g. OJ 287 (Britzen et al., 2018), 3C84 (Britzen et al., 2019a), 3C279 (Abraham & Carrara, 1998), the neutrino emission from TXS 0506+056 (Britzen et al., 2019b), as well as in X-ray binaries (Monceau-Baroux et al., 2015; Miller-Jones et al., 2019).
For the Galactic center, the Lense-Thirring precession of the hot thick accretion flow was analyzed by Dexter & Fragile (2013) in relation to the near-infrared and mm variability of Sgr A*. This effect would also translate to the precession of the jet under the assumption it is coupled to the disc via the launching mechanism (Blandford–Payne mechanism; see Blandford & Payne, 1982). The jet precession is also suggested by wide UV ionization cones with the opening angle of (Bland-Hawthorn et al., 2019), which is larger by a factor of a few expected for the jet opening angle of (Li et al., 2013).
We estimate the factor by which the volume of the affected red giants is enlarged. We adopt the jet precession half-opening angle of based on the scale of UV ionization cones (Bland-Hawthorn et al., 2019). During the precession motion, the jet circumscribes a cone with the radius . The factor by which the volume at given distance enlarges is given by
| (31) |
when and . The number of affected late-type stars would then increase by the same factor to and within and , respectively, which is comparable to the number of missing bright red giants at these scales – 100 at (Gallego-Cano et al., 2018) and 4 at (Habibi et al., 2019). The factor derived in Eq. (31) should be treated as an upper limit on the volume enlargement since it assumes that the precession period is comparable to or less than the jet lifetime, but it could also be longer. On the other hand, larger volume means that the stars are affected correspondingly less (over a shorter period of time) by the jet action, which is spread in different directions with the precession duty cycle.
6.2 High-energy particle acceleration and jet mass-loading due to jet/star interactions
The detection of the Fermi bubbles in the GeV domain indicates the presence of relativistic particles emitting gamma-rays. Guo & Mathews (2012) considered that particles can be accelerated in the jet launching region or in the jet termination shocks. Note however that the coexistence of the jet with the dense NSC in the Galactic center makes jet/star interactions very likely. The NSC is composed of both early- and late-type stars. In the former case, the powerful wind of OB and Wolf-Rayet stars makes the stagnation distance and therefore a double bow-shock structure is formed (Araudo et al., 2013). In the latter case, the slow winds of low-mass stars cannot create a big bow shock around the stars, but a shock in the jet will be formed anyway. In both cases, particles can be accelerated through the Fermi I acceleration mechanism in the bow shocks (Bell, 1978). Even when the interaction with massive stars is a better scenario to accelerate particles up to highest energies (given that the size of the acceleration region is ), acceleration of particles up to GeV-energies is not difficult to achieve.
Barkov et al. (2010, 2012b) consider the interaction of AGN jets with red giant stars to explain the TeV emission in radiogalaxies and blazars. The mass stripped from the red giant forms clouds moving in the jet direction, see also our Fig. 1. Particles are accelerated in the bow shock around the cloud formed by the pressure exerted by the jet from below. Another shock propagates into the cloud and as a consequence, it will heat up and expand. After a certain time, there will be a population of relativistic particles in the jet as well as a chemical enrichment by stellar envelopes (Perucho et al., 2017). These effects were previously not taken into account in the jet models of the Fermi bubbles.
6.3 Chemically peculiar stars as remnant cores of ablated red giants
The past ablation of red giants by the jet would contribute to the apparent lack of late-type stars in the central region of the Galactic center. Another potential imprint of the past jet-red giant interaction would be the presence of chemically peculiar, high metallicity stars in the NSC. This can be predicted from the fact that as the jet ram pressure removes upper hydrogen- and helium-rich parts of the stellar atmosphere, the lower metal-rich parts as well as the denser core are exposed. In fact, two late-type stars at from Sgr A* were reported as having a super-solar metallicity (Do et al., 2018) with an anomalous abundance of scandium, vanadium, and yttrium. A detailed modelling of the stellar evolution in combination with the treatment of the jet-star interaction is needed to confirm or exclude the previous interaction with the jet for these and similar candidate stars with super-solar metallicities.
6.4 A collimated jet or a broad-angle disc wind?
In the current analysis, we took into account mainly highly collimated nuclear outflow – jet – with the small half-opening angle close to . The analysis of the UV ionization cones by Bland-Hawthorn et al. (2019) indicates a half-opening angle of , which could be a signature of the jet precession as we discussed in Sec. 6.1 or alternatively disc winds with a larger opening angle. In case the jet would be absent and the disc wind would be present with the larger half opening angle, the expected stagnation radius would be proportionally larger since . Assuming the same kinetic luminosity and the outflow velocity close to (ultrafast outflows), the ratio of the stagnation radii is , which yields for using Eq. (6). The ablation effect would still take place but only for the largest red giants with at the outer radius of the S cluster. The stagnation radius of would be reached at the distance of for the same stellar parameters as we assumed in Eq. (6) and a larger outflow half-opening angle of .
6.5 Recurrent Seyfert-like activity and TDEs
The X-ray/-ray Fermi bubbles were created during the increased Seyfert-like activity about Myr ago (Bland-Hawthorn et al., 2019) with total duration of Myr (Guo & Mathews, 2012). Currently, it is unclear whether this increased activity is related to the star-formation event that led to the formation of massive OB/Wolf-Rayet stars a few million years ago, a fraction of which forms a stellar disc that is a remnant of a former massive gaseous disk (Levin & Beloborodov, 2003). In case the correlation between the episodic star-formation and the accretion activity exists, the Seyfert-like phase could occur every 100 million years based on the currently observed stellar populations in the Galactic center region (Pfuhl et al., 2011). In the context of this work, this could provide a mechanism for the recurrent depletion of large red giants by the increased jet activity. However, the most relevant episode in terms of currently observed stellar populations is the most recent episode a few million years ago. There is an evidence for even more recent activity years ago, which is inferred from the X-ray reflections or propagating brightening of molecular clouds in the Central Molecular Zone (Sunyaev et al., 1993; Sunyaev & Churazov, 1998). However, these repetitive events occur stochastically based on the presence of infalling clumps and lead to the increase by only several orders of magnitude and last for several years depending on the exact viscous timescale (Czerny et al., 2013).
Another possibility of a recurrent launching of the jet is a tidal disruption event (TDE), which can occur in the Galactic center every – years depending on the stellar type (Syer & Ulmer, 1999; Alexander, 2005; Komossa, 2015). For completeness, we note that the jet is not always formed during the TDE (Komossa, 2015). However, for a few months to years, the TDE can trigger a jet activity similar to the Seyfert sources (Hills, 1975). Due to the short duration of the TDE between several months to years given by the steep dependency of the luminosity on time, , the average number of interacting stars would be given by the estimates calculated in Section 4. In general, the number of ablated red giants in the S cluster would be of the order of unity. The jet precession driven by the Lense-Thirring effect (Lodato & Pringle, 2006) could enlarge this number depending on the precession period and (see Section 6.1).
6.6 Comparison with other mechanisms – the region of efficiency
The jet-induced alternation of the population of late-type stars is not necessarily an alternative to other proposed mechanism, listed in the introductory Section 1. In reality, it could have co-existed simultaneously during the past few million years with other previously proposed mechanisms, in particular the tidal disruption of red-giant envelopes as well as direct star-disc interactions. This follows from the fact that these mechanisms have different length-scales of their efficiency, as we further outline in the paragraphs below.
First, the tidal disruption of red-giant envelopes takes place on the smallest scales – less than one milliparsec from Sgr A* – as given by the tidal radius, ,
| (32) |
The resonant relaxation process (discussed in Section 4), in particular the scalar resonant relaxation, can cause an increase in orbital eccentricities and thus effectively induce the tidal disruption of giants as their orbital distance decreases below close to the pericenter of their orbits. This could have contributed to the dearth of brighter red giants in the inner (Madigan et al., 2011), which is a larger scale than given by but still smaller than the total extent of of the red giant hole.
Then, the jet-induced mass removal is clearly the most efficient in the S-cluster region, , according to the cumulative mass removal distance profile in Fig. 5. Another way to constrain the region of the maximum efficiency is to use the relation in Eq. 6 for the stagnation radius, from which we derive the distance . It follows that for the maximum jet luminosity of and the stagnation radius range of , we obtain the distance range . Hence, within the S cluster, , would be effectively below , which corresponds to stars for a typical age of 5 Gyr. Therefore, the jet luminosities close to the Eddington limit for Sgr A* are required to truncate the atmospheres of late-type stars of . For the moderate jet luminosity of , the distance range decreases by an order of magnitude to , hence only the brighter giants with () would be effectively truncated within the S cluster, while the smaller and fainter giants with would remain largely unaffected by the jet.
Finally, the star–clumpy disc collisions are the most efficient for the disc surface densities typical of self-gravitating clumps (Kieffer & Bogdanović, 2016; Amaro-Seoane et al., 2020), which can form at larger distance scales where the condition for gravitational instability is met as given by the Toomre instability criterion (Milosavljević & Loeb, 2004). In the Galactic center, this region likely corresponds to , where the disk population of young massive stars is observed and they are believed to have formed in-situ in a massive gaseous disc (Levin & Beloborodov, 2003).
Hence, we speculate that the dearth of bright red giants for is due to the combination of the three processes – tidal stripping, jet-induced atmosphere ablation, and star-disc interactions – that operated the most efficiently at complementary length-scales up to
6.7 Observational signatures and falsifiability
The jet-ablation mechanism likely operated in the central S cluster region () for stars of large atmosphere radii of , and especially for supergiants of even at larger distances up to . However, since the enhanced jet activity and the resulting atmosphere ablation took place a few million years ago, any direct observational trace of the jet-star interaction is difficult to find. Here we list tentative observational signatures of the jet-ablation on the pre-existing cusp of late-type stars. Some of them have more possible interpretations due to other mechanisms operating simultaneously in the complex nuclear star cluster around Sgr A*. The signatures proposed here can serve as a guideline towards confirming the jet activity and in particular the jet-star interaction in the central parsec. On the other hand, if other explanations become more likely, these can also serve as suitable falsifiability criteria for the jet-ablation theory. The signatures can be outlined as follows:
-
(i)
Flattening of the density distribution for brighter late-type stars. This is a classical signature of the preferential bright late-type star depletion, which has more interpretations due to mechanisms, which likely operated on different scales; see Subsection 6.6. Therefore, this signature should be treated with caution. However, we have shown in Section 5 that the jet active for a sufficiently long time can have an impact on the surface-brightness profile of the Nuclear Star Cluster when it reaches the kinetic luminosity at least ; see also Section 5 and Fig. 10. In particular, brighter giants with mag could exhibit a flat profile due to the jet activity inside the inner arcsecond (). Such a trend has also been recently reported by the high-sensitivity photometric analysis of Schödel et al. (2020).
-
(ii)
Detection of high metallicity stars. The jet-ablation of red giant and supergiant shells could reveal metal-rich deeper layers. A jet-ablation mechanism can be considered as one of the explanations for the occurrence of stars with anomalous metal concentrations in their atmospheres, as was found by Do et al. (2018), see also Subsection 6.3.
-
(iii)
Cluster of remnant white dwarfs at millipasec scales. In relation to point (ii), an extreme case of jet-ablation could lead to the exposure of degenerate cores for asymptotic giant-branch (AGB) stars. This is analogous to the ablation by tidal stripping (King, 2020), however, the jet-ablation has a larger length-scale for Sgr A*. As we derived in Section 3, the AGB stars could be jet-ablated down to the white-dwarf cores for for . The tidal stripping to the size of is only possible essentially below the event horizon. There has not been a direct observation of white dwarfs at such small distances from Sgr A*, however, the hard X-ray flux peaking at Sgr A* was hypothesized to originate in the cluster of accreting white dwarfs (Perez et al., 2015).
-
(iv)
Cusp of remnant blue OB stars. As we have shown in Section 3, the late-type stars could be turned to blue stars of spectral type OB by the jet-ablation mechanism. In Table 1, we show that the effective temperature could be of a few , and with the stagnation radius of , the K-band magnitude was estimated to reach mag, which is comparable to S2 star ( mag, Habibi et al., 2017). In this sense, we hypothesize that the fraction of S stars could be produced via the jet-ablation of older stars, however, the production rate within the S-cluster was of the order of unity, as we showed in Section 4. Hence, the majority of B-type S stars was most likely formed in-situ in the circumnuclear gaseous material (Mapelli & Gualandris, 2016) and the current location and the kinematic structure of the S cluster are a result of different dynamical processes, most likely the Kozai-Lidov mechanism and the resonant relaxation (Ali et al., 2020).
-
(v)
Presence of bow-shock and comet-shaped sources. The presence of bow-shock sources X3 and X7 (Mužić et al., 2010) as well as X8 (Peißker et al., 2019) in the mini-cavity implies the interaction of these sources with a nuclear outflow in the current state of activity of Sgr A*. The present nuclear outflow could be a signature of a low surface-brightness jet (Yusef-Zadeh et al., 2020), which was much more luminous a few million years ago. The infrared-excess sources X3, X7, and X8 thus directly reveal the interaction of a nuclear outflow/jet with stars at the scale of .
-
(vi)
Non-spherical distribution of stars. In the broader context, the activity of the Seyfert-like jet at the scales of could be imprinted in the non-spherical stellar structures, e.g. by affecting the distribution of denser star-forming material and its temperature via the jet feedback. Recently, Ali et al. (2020) revealed an x-shape structure of the S-cluster formed by two, nearly perpendicular stellar disks. Since S stars formed a few million years ago, their formation could be linked to the phase of higher accretion and the enhanced jet activity. Also, the x-structure implies that the resonant relaxation process (see Section 4), in particular the vector resonant relaxation, is not as fast, otherwise the kinematic structure of the S cluster would be rather isotropic. However, the potential relation between the jet activity and the stellar kinematics needs to be verified via the detailed hydrodynamical/N-body or smooth-particle-hydrodynamics simulations.
-
(vii)
Non-spherical distribution of ionization tracers around Sgr A*. In a similar way as we discussed in point (vi) in terms of the non-spherical stellar distribution, the jet interaction with the surrounding gas could also be revealed via the non-isotropic distribution of ionization tracers. In particular, the shock-tracer line [FeIII] seems to be preferentially located in the direction of the mini-cavity (Peißker et al., 2020), which suggests either the current or the past interaction of the gas with the high-velocity outflow/jet (Yusef-Zadeh et al., 2020). On the scales larger than one parsec, the non-isotropic distribution is manifested by bipolar radio lobes (Heywood et al., 2019) and X-ray (Ponti et al., 2019) and -ray bubbles (Su et al., 2010; Ackermann et al., 2014). Recently, the analysis of the tilted, partially ionized disk in the inner Galaktic latitudes has shown that its optical line ratios are characteristic of low-ionization nuclear emission regions (LINERs; Krishnarao et al., 2020). The bipolar ionization structure is energetically in favor of the Seyfer-like jet activity rather than the star-formation event (Bland-Hawthorn et al., 2019).
In summary, the jet-activity signs listed in points (i)–(vii) indicated the past enhanced activity of the jet and its interaction with the surrounding circumnuclear medium, including the nuclear star cluster. Although each of the above-mentioned points can have alternative explanations, the absence of all of these signatures would suggest that the jet did not operate in the past and our hypotheses would then be strongly disfavored. Future detailed observations by the Extremely Large Telescope (ELT) in combination with detailed numerical simulations of the jet-star interactions close to Sgr A* will help to reveal the signatures of the current and the past jet–star interactions.
7 Summary and conclusions
We presented a novel scenario to explain the lack of bright red giants in the inner regions of the Galactic center in the sphere of influence of the currently quiescent, but previously active radio source Sgr A*. Taking this increased activity into account, we focused on the effect of the jet on late-type stars at . By adopting the scenario of the recent active period of Sgr A⋆, we considered the interaction of red giants with a jet of a typical active Seyfert-like nucleus with the expected kinetic luminosity . Given that red giants have a very slow wind, the jet can significantly ablate the stellar envelope down to at least within the S cluster () after repetitive encounters. Specifically, at , the stagnation radius is for . Hence, the higher luminosity end that corresponds to the less frequent events that formed the Fermi bubbles can ablate the stellar atmospheres of late-type giants by a factor of more than the more frequent, less energetic outbursts of Sgr A*.
This truncation is accompanied by the removal of a large fraction of matter, reaching as much as for red giants with radii at distances smaller than pc for a single encounter. After at least thousand of red giant–jet encounters, we expect the cumulative mass loss of at least at the orbital distance of . This is comparable to the values inferred from red giant–accretion clump simulations. The proposed mechanism can thus help to explain the presence of late-type stars with the maximum atmosphere radius of within the S cluster as inferred from the near-infrared observations.
The reduction in the mass and radius of the red giant atmosphere after repetitive jet-star crossings will produce an estimated decrease in the near-infrared K-band magnitude by , , and magnitudes with respect to the normal evolution at , , and from Sgr A*, respectively. Simultaneously, the color index would decrease to negative values, i.e., the stars should appear bluer with a higher effective temperature. The mean expected number of red giant-jet crossings per orbital period is within pc, and within pc, respectively. For the jet kinetic luminosity of , of currently detectable late-type stars located at (S cluster) with radii larger than and K-band magnitudes smaller than mag could be affected by the jet ablation. The estimated numbers of interacting giants can be considered as lower limits since various dynamical effects, such as the coherent resonant relaxation within the nuclear star cluster as well as a potential jet precession would enlarge the number of affected giants.
Constructed surface-brightness profiles of the mock Nuclear Star Cluster affected by the jet with the luminosity of show that profiles of mainly brighter late-type stars with mag (dereddened, mag with the foreground extinction included) are flattened by the jet inside the inner arcsecond (). Fainter stars keep the initially assumed cusp-like projected profile.
In summary, the interaction of red giants with the jet of Sgr A* during its enhanced activity could contribute to the observed lack of bright red giants and hence affect their surface-brightness profile in the central parts of the nuclear star cluster. More likely, this mechanism operated in parallel with other previously proposed mechanisms, such as the star–disc interactions, star–star collisions, and tidal disruption events that have different spatial scales of efficiency. Detailed numerical computations of red giant–jet interactions in combination with a modified stellar evolution will help to verify our analytical estimates.
References
- Abraham & Carrara (1998) Abraham, Z., & Carrara, E. A. 1998, ApJ, 496, 172, doi: 10.1086/305387
- Ackermann et al. (2014) Ackermann, M., Albert, A., Atwood, W. B., et al. 2014, ApJ, 793, 64, doi: 10.1088/0004-637X/793/1/64
- Alexander (2005) Alexander, T. 2005, Phys. Rep., 419, 65, doi: 10.1016/j.physrep.2005.08.002
- Ali et al. (2020) Ali, B., Paul, D., Eckart, A., et al. 2020, ApJ, 896, 100, doi: 10.3847/1538-4357/ab93ae
- Amaro-Seoane & Chen (2014) Amaro-Seoane, P., & Chen, X. 2014, ApJ, 781, L18, doi: 10.1088/2041-8205/781/1/L18
- Amaro-Seoane et al. (2020) Amaro-Seoane, P., Chen, X., Schödel, R., & Casanellas, J. 2020, MNRAS, 492, 250, doi: 10.1093/mnras/stz3507
- Antonini et al. (2012) Antonini, F., Capuzzo-Dolcetta, R., Mastrobuono-Battisti, A., & Merritt, D. 2012, ApJ, 750, 111, doi: 10.1088/0004-637X/750/2/111
- Araudo et al. (2013) Araudo, A. T., Bosch-Ramon, V., & Romero, G. E. 2013, MNRAS, 436, 3626, doi: 10.1093/mnras/stt1840
- Araudo & Karas (2017) Araudo, A. T., & Karas, V. 2017, in RAGtime 17-19: Workshops on Black Holes and Neutron Stars, 1–6
- Armitage et al. (1996) Armitage, P. J., Zurek, W. H., & Davies, M. B. 1996, ApJ, 470, 237, doi: 10.1086/177864
- Baganoff et al. (2003) Baganoff, F. K., Maeda, Y., Morris, M., et al. 2003, ApJ, 591, 891, doi: 10.1086/375145
- Bailey & Davies (1999) Bailey, V. C., & Davies, M. B. 1999, MNRAS, 308, 257, doi: 10.1046/j.1365-8711.1999.02740.x
- Barkov et al. (2012a) Barkov, M. V., Aharonian, F. A., Bogovalov, S. V., Kelner, S. R., & Khangulyan, D. 2012a, ApJ, 749, 119, doi: 10.1088/0004-637X/749/2/119
- Barkov et al. (2010) Barkov, M. V., Aharonian, F. A., & Bosch-Ramon, V. 2010, ApJ, 724, 1517, doi: 10.1088/0004-637X/724/2/1517
- Barkov et al. (2012b) Barkov, M. V., Bosch-Ramon, V., & Aharonian, F. A. 2012b, ApJ, 755, 170, doi: 10.1088/0004-637X/755/2/170
- Baumgardt et al. (2006) Baumgardt, H., Gualandris, A., & Portegies Zwart, S. 2006, MNRAS, 372, 174, doi: 10.1111/j.1365-2966.2006.10818.x
- Bednarek & Banasiński (2015) Bednarek, W., & Banasiński, P. 2015, ApJ, 807, 168, doi: 10.1088/0004-637X/807/2/168
- Bell (1978) Bell, A. R. 1978, MNRAS, 182, 147, doi: 10.1093/mnras/182.2.147
- Bland-Hawthorn & Cohen (2003) Bland-Hawthorn, J., & Cohen, M. 2003, ApJ, 582, 246, doi: 10.1086/344573
- Bland-Hawthorn et al. (2019) Bland-Hawthorn, J., Maloney, P. R., Sutherland, R., et al. 2019, ApJ, 886, 45, doi: 10.3847/1538-4357/ab44c8
- Blandford & Payne (1982) Blandford, R. D., & Payne, D. G. 1982, MNRAS, 199, 883, doi: 10.1093/mnras/199.4.883
- Boehle et al. (2016) Boehle, A., Ghez, A. M., Schödel, R., et al. 2016, ApJ, 830, 17, doi: 10.3847/0004-637X/830/1/17
- Bogdanović et al. (2014) Bogdanović, T., Cheng, R. M., & Amaro-Seoane, P. 2014, ApJ, 788, 99, doi: 10.1088/0004-637X/788/2/99
- Bosch-Ramon et al. (2012) Bosch-Ramon, V., Perucho, M., & Barkov, M. V. 2012, A&A, 539, A69, doi: 10.1051/0004-6361/201118622
- Bressan et al. (2012) Bressan, A., Marigo, P., Girardi, L., et al. 2012, MNRAS, 427, 127, doi: 10.1111/j.1365-2966.2012.21948.x
- Britzen et al. (2019a) Britzen, S., Fendt, C., Zajaček, M., et al. 2019a, Galaxies, 7, 72, doi: 10.3390/galaxies7030072
- Britzen et al. (2018) Britzen, S., Fendt, C., Witzel, G., et al. 2018, MNRAS, 478, 3199, doi: 10.1093/mnras/sty1026
- Britzen et al. (2019b) Britzen, S., Fendt, C., Böttcher, M., et al. 2019b, A&A, 630, A103, doi: 10.1051/0004-6361/201935422
- Buchholz et al. (2009) Buchholz, R. M., Schödel, R., & Eckart, A. 2009, A&A, 499, 483, doi: 10.1051/0004-6361/200811497
- Czerny et al. (2013) Czerny, B., Kunneriath, D., Karas, V., & Das, T. K. 2013, A&A, 555, A97, doi: 10.1051/0004-6361/201118124
- Dale et al. (2009) Dale, J. E., Davies, M. B., Church, R. P., & Freitag, M. 2009, MNRAS, 393, 1016, doi: 10.1111/j.1365-2966.2008.14254.x
- Davies & King (2005) Davies, M. B., & King, A. 2005, ApJ, 624, L25, doi: 10.1086/430308
- de la Cita et al. (2016) de la Cita, V. M., Bosch-Ramon, V., Paredes-Fortuny, X., Khangulyan, D., & Perucho, M. 2016, A&A, 591, A15, doi: 10.1051/0004-6361/201527084
- Deegan & Nayakshin (2007) Deegan, P., & Nayakshin, S. 2007, MNRAS, 377, 897, doi: 10.1111/j.1365-2966.2007.11659.x
- Dexter & Fragile (2013) Dexter, J., & Fragile, P. C. 2013, MNRAS, 432, 2252, doi: 10.1093/mnras/stt583
- Do et al. (2009) Do, T., Ghez, A. M., Morris, M. R., et al. 2009, ApJ, 703, 1323, doi: 10.1088/0004-637X/703/2/1323
- Do et al. (2018) Do, T., Kerzendorf, W., Konopacky, Q., et al. 2018, ApJ, 855, L5, doi: 10.3847/2041-8213/aaaec3
- Eckart et al. (2017) Eckart, A., Hüttemann, A., Kiefer, C., et al. 2017, Foundations of Physics, 47, 553, doi: 10.1007/s10701-017-0079-2
- Ernst et al. (2009) Ernst, A., Just, A., & Spurzem, R. 2009, MNRAS, 399, 141, doi: 10.1111/j.1365-2966.2009.15305.x
- Gallego-Cano et al. (2018) Gallego-Cano, E., Schödel, R., Dong, H., et al. 2018, A&A, 609, A26, doi: 10.1051/0004-6361/201730451
- Genzel et al. (2010) Genzel, R., Eisenhauer, F., & Gillessen, S. 2010, Reviews of Modern Physics, 82, 3121, doi: 10.1103/RevModPhys.82.3121
- Genzel et al. (1996) Genzel, R., Thatte, N., Krabbe, A., Kroker, H., & Tacconi-Garman, L. E. 1996, ApJ, 472, 153, doi: 10.1086/178051
- Ghez et al. (2003) Ghez, A. M., Duchêne, G., Matthews, K., et al. 2003, ApJ, 586, L127, doi: 10.1086/374804
- Gillessen et al. (2017) Gillessen, S., Plewa, P. M., Eisenhauer, F., et al. 2017, ApJ, 837, 30, doi: 10.3847/1538-4357/aa5c41
- Gravity Collaboration et al. (2018) Gravity Collaboration, Abuter, R., Amorim, A., et al. 2018, A&A, 615, L15, doi: 10.1051/0004-6361/201833718
- Gualandris & Merritt (2012) Gualandris, A., & Merritt, D. 2012, ApJ, 744, 74, doi: 10.1088/0004-637X/744/1/74
- Guo & Mathews (2012) Guo, F., & Mathews, W. G. 2012, ApJ, 756, 181, doi: 10.1088/0004-637X/756/2/181
- Habibi et al. (2017) Habibi, M., Gillessen, S., Martins, F., et al. 2017, ApJ, 847, 120, doi: 10.3847/1538-4357/aa876f
- Habibi et al. (2019) Habibi, M., Gillessen, S., Pfuhl, O., et al. 2019, ApJ, 872, L15, doi: 10.3847/2041-8213/ab03cf
- Heywood et al. (2019) Heywood, I., Camilo, F., Cotton, W. D., et al. 2019, Nature, 573, 235, doi: 10.1038/s41586-019-1532-5
- Hills (1975) Hills, J. G. 1975, Nature, 254, 295, doi: 10.1038/254295a0
- Ito et al. (2008) Ito, H., Kino, M., Kawakatu, N., Isobe, N., & Yamada, S. 2008, ApJ, 685, 828, doi: 10.1086/591036
- Joss et al. (1987) Joss, P. C., Rappaport, S., & Lewis, W. 1987, ApJ, 319, 180, doi: 10.1086/165443
- Junor et al. (1999) Junor, W., Biretta, J. A., & Livio, M. 1999, Nature, 401, 891, doi: 10.1038/44780
- Karas & Šubr (2001) Karas, V., & Šubr, L. 2001, A&A, 376, 686, doi: 10.1051/0004-6361:20011009
- Kieffer & Bogdanović (2016) Kieffer, T. F., & Bogdanović, T. 2016, ApJ, 823, 155, doi: 10.3847/0004-637X/823/2/155
- Kim & Morris (2003) Kim, S. S., & Morris, M. 2003, ApJ, 597, 312, doi: 10.1086/378347
- King (2020) King, A. 2020, MNRAS, 493, L120, doi: 10.1093/mnrasl/slaa020
- Komissarov (1994) Komissarov, S. S. 1994, MNRAS, 269, 394, doi: 10.1093/mnras/269.2.394
- Komossa (2015) Komossa, S. 2015, Journal of High Energy Astrophysics, 7, 148, doi: 10.1016/j.jheap.2015.04.006
- Krabbe et al. (1991) Krabbe, A., Genzel, R., Drapatz, S., & Rotaciuc, V. 1991, ApJ, 382, L19, doi: 10.1086/186204
- Krishnarao et al. (2020) Krishnarao, D., Benjamin, R. A., & Haffner, L. M. 2020, Science Advances, 6, 9711, doi: 10.1126/sciadv.aay9711
- Kroupa (2001) Kroupa, P. 2001, MNRAS, 322, 231, doi: 10.1046/j.1365-8711.2001.04022.x
- Levin & Beloborodov (2003) Levin, Y., & Beloborodov, A. M. 2003, ApJ, 590, L33, doi: 10.1086/376675
- Li et al. (2013) Li, Z., Morris, M. R., & Baganoff, F. K. 2013, ApJ, 779, 154, doi: 10.1088/0004-637X/779/2/154
- Löckmann & Baumgardt (2008) Löckmann, U., & Baumgardt, H. 2008, MNRAS, 384, 323, doi: 10.1111/j.1365-2966.2007.12699.x
- Lodato & Pringle (2006) Lodato, G., & Pringle, J. E. 2006, MNRAS, 368, 1196, doi: 10.1111/j.1365-2966.2006.10194.x
- MacLeod et al. (2012) MacLeod, M., Guillochon, J., & Ramirez-Ruiz, E. 2012, ApJ, 757, 134, doi: 10.1088/0004-637X/757/2/134
- MacLeod & Lin (2019) MacLeod, M., & Lin, D. N. C. 2019, arXiv e-prints, arXiv:1909.09645. https://arxiv.org/abs/1909.09645
- Madigan et al. (2011) Madigan, A.-M., Hopman, C., & Levin, Y. 2011, ApJ, 738, 99, doi: 10.1088/0004-637X/738/1/99
- Mapelli & Gualandris (2016) Mapelli, M., & Gualandris, A. 2016, Star Formation and Dynamics in the Galactic Centre, ed. F. Haardt, V. Gorini, U. Moschella, A. Treves, & M. Colpi, Vol. 905, 205, doi: 10.1007/978-3-319-19416-5_6
- Matsubayashi et al. (2007) Matsubayashi, T., Makino, J., & Ebisuzaki, T. 2007, ApJ, 656, 879, doi: 10.1086/510344
- Merritt (2013) Merritt, D. 2013, Dynamics and Evolution of Galactic Nuclei (Princeton: Princeton University Press)
- Merritt & Szell (2006) Merritt, D., & Szell, A. 2006, ApJ, 648, 890, doi: 10.1086/506010
- Miller & Bregman (2016) Miller, M. J., & Bregman, J. N. 2016, ApJ, 829, 9, doi: 10.3847/0004-637X/829/1/9
- Miller-Jones et al. (2019) Miller-Jones, J. C. A., Tetarenko, A. J., Sivakoff, G. R., et al. 2019, Nature, 569, 374, doi: 10.1038/s41586-019-1152-0
- Milosavljević & Loeb (2004) Milosavljević, M., & Loeb, A. 2004, ApJ, 604, L45, doi: 10.1086/383467
- Monceau-Baroux et al. (2015) Monceau-Baroux, R., Porth, O., Meliani, Z., & Keppens, R. 2015, A&A, 574, A143, doi: 10.1051/0004-6361/201425015
- Morel & Lebreton (2008) Morel, P., & Lebreton, Y. 2008, Ap&SS, 316, 61, doi: 10.1007/s10509-007-9663-9
- Morris (1993) Morris, M. 1993, ApJ, 408, 496, doi: 10.1086/172607
- Morris & Serabyn (1996) Morris, M., & Serabyn, E. 1996, ARA&A, 34, 645, doi: 10.1146/annurev.astro.34.1.645
- Moser et al. (2017) Moser, L., Sánchez-Monge, Á., Eckart, A., et al. 2017, A&A, 603, A68, doi: 10.1051/0004-6361/201628385
- Mužić et al. (2010) Mužić, K., Eckart, A., Schödel, R., et al. 2010, A&A, 521, A13, doi: 10.1051/0004-6361/200913087
- Paczyński (1970) Paczyński, B. 1970, Acta Astron., 20, 47
- Parsa et al. (2017) Parsa, M., Eckart, A., Shahzamanian, B., et al. 2017, ApJ, 845, 22, doi: 10.3847/1538-4357/aa7bf0
- Peißker et al. (2020) Peißker, F., Hosseini, S. E., Zajaček, M., et al. 2020, A&A, 634, A35, doi: 10.1051/0004-6361/201935953
- Peißker et al. (2019) Peißker, F., Zajaček, M., Eckart, A., et al. 2019, A&A, 624, A97, doi: 10.1051/0004-6361/201834947
- Perez et al. (2015) Perez, K., Hailey, C. J., Bauer, F. E., et al. 2015, Nature, 520, 646, doi: 10.1038/nature14353
- Perucho et al. (2017) Perucho, M., Bosch-Ramon, V., & Barkov, M. V. 2017, A&A, 606, A40, doi: 10.1051/0004-6361/201630117
- Pfuhl et al. (2011) Pfuhl, O., Fritz, T. K., Zilka, M., et al. 2011, ApJ, 741, 108, doi: 10.1088/0004-637X/741/2/108
- Phinney (1989) Phinney, E. S. 1989, in IAU Symposium, Vol. 136, The Center of the Galaxy, ed. M. Morris, 543
- Ponti et al. (2019) Ponti, G., Hofmann, F., Churazov, E., et al. 2019, Nature, 567, 347, doi: 10.1038/s41586-019-1009-6
- Portegies Zwart et al. (2006) Portegies Zwart, S. F., Baumgardt, H., McMillan, S. L. W., et al. 2006, ApJ, 641, 319, doi: 10.1086/500361
- Rees (1988) Rees, M. J. 1988, Nature, 333, 523, doi: 10.1038/333523a0
- Refsdal & Weigert (1971) Refsdal, S., & Weigert, A. 1971, A&A, 13, 367
- Reimers (1987) Reimers, D. 1987, in IAU Symposium, Vol. 122, Circumstellar Matter, ed. I. Appenzeller & C. Jordan, 307–318
- Różańska et al. (2017) Różańska, A., Kunneriath, D., Czerny, B., Adhikari, T. P., & Karas, V. 2017, MNRAS, 464, 2090, doi: 10.1093/mnras/stw2460
- Schödel et al. (2014) Schödel, R., Feldmeier, A., Neumayer, N., Meyer, L., & Yelda, S. 2014, Classical and Quantum Gravity, 31, 244007, doi: 10.1088/0264-9381/31/24/244007
- Schödel et al. (2010) Schödel, R., Najarro, F., Muzic, K., & Eckart, A. 2010, A&A, 511, A18, doi: 10.1051/0004-6361/200913183
- Schödel et al. (2020) Schödel, R., Nogueras-Lara, F., Gallego-Cano, E., et al. 2020, arXiv e-prints, arXiv:2007.15950. https://arxiv.org/abs/2007.15950
- Su et al. (2010) Su, M., Slatyer, T. R., & Finkbeiner, D. P. 2010, ApJ, 724, 1044, doi: 10.1088/0004-637X/724/2/1044
- Sunyaev & Churazov (1998) Sunyaev, R., & Churazov, E. 1998, MNRAS, 297, 1279, doi: 10.1046/j.1365-8711.1998.01684.x
- Sunyaev et al. (1993) Sunyaev, R. A., Markevitch, M., & Pavlinsky, M. 1993, ApJ, 407, 606, doi: 10.1086/172542
- Syer & Ulmer (1999) Syer, D., & Ulmer, A. 1999, MNRAS, 306, 35, doi: 10.1046/j.1365-8711.1999.02445.x
- Vilkoviskij & Czerny (2002) Vilkoviskij, E. Y., & Czerny, B. 2002, A&A, 387, 804, doi: 10.1051/0004-6361:20020255
- Šubr & Haas (2014) Šubr, L., & Haas, J. 2014, ApJ, 786, 121, doi: 10.1088/0004-637X/786/2/121
- Wang et al. (2013) Wang, Q. D., Nowak, M. A., Markoff, S. B., et al. 2013, Science, 341, 981, doi: 10.1126/science.1240755
- Yusef-Zadeh et al. (2020) Yusef-Zadeh, F., Royster, M., Wardle, M., et al. 2020, arXiv e-prints, arXiv:2008.04317. https://arxiv.org/abs/2008.04317
- Yusef-Zadeh et al. (2012) Yusef-Zadeh, F., Arendt, R., Bushouse, H., et al. 2012, ApJ, 758, L11, doi: 10.1088/2041-8205/758/1/L11
- Zhao et al. (2009) Zhao, J.-H., Morris, M. R., Goss, W. M., & An, T. 2009, ApJ, 699, 186, doi: 10.1088/0004-637X/699/1/186
- Zhu et al. (2018) Zhu, Z., Li, Z., & Morris, M. R. 2018, ApJS, 235, 26, doi: 10.3847/1538-4365/aab14f
- Zurek et al. (1994) Zurek, W. H., Siemiginowska, A., & Colgate, S. A. 1994, ApJ, 434, 46, doi: 10.1086/174703