The Galactic Centre Chimney
Abstract
Evidence has increasingly mounted in recent decades that outflows of matter and energy from the central parsecs of our Galaxy have shaped the observed structure of the Milky Way on a variety of larger scales1. On scales of pc, the Galactic centre (GC) has bipolar lobes that can be seen in both X-rays and radio2,3, indicating broadly collimated outflows from the centre, directed perpendicular to the Galactic plane. On far larger scales approaching the size of the Galaxy itself, gamma-ray observations have identified the so-called ”Fermi Bubble” (FB) features4, implying that our Galactic centre has, or has recently had, a period of active energy release leading to a production of relativistic particles that now populate huge cavities on both sides of the Galactic plane. The X-ray maps from the ROSAT all-sky survey show that the edges of these cavities close to the Galactic plane are bright in X-rays. At intermediate scales ( pc), radio astronomers have found the Galactic Centre Lobe (GCL), an apparent bubble of emission seen only at positive Galactic latitudes5,6, but again indicative of energy injection from near the Galactic centre. Here we report the discovery of prominent X-ray structures on these intermediate (hundred-parsec) scales above and below the plane, which appear to connect the Galactic centre region to the Fermi bubbles. We propose that these newly-discovered structures, which we term the Galactic Centre Chimneys, constitute a channel through which energy and mass, injected by a quasi-continuous train of episodic events at the Galactic centre, are transported from the central parsecs to the base of the Fermi bubbles5.
Max-Planck-Institut für Extraterrestrische Physik, Giessenbachstrasse 1, D-85748 Garching, Germany
INAF-Osservatorio Astronomico di Brera, Via E. Bianchi 46, I-23807 Merate (LC), Italy
Max-Planck-Institut für Astrophysik, Karl-Schwarzschild-Str. 1, D-85748, Garching, Germany
Space Research Institute (IKI), Profsoyuznaya 84/32, Moscow 117997, Russia
Department of Physics and Astronomy, University of California, Los Angeles, CA 90095-1547, USA
Unité mixte de recherche Astroparticule et Cosmologie, 10 rue Alice Domon et Léonie Duquet, F-75205 Paris, France
Univ. Grenoble Alpes, CNRS, IPAG, F-38000 Grenoble, France
Service d’Astrophysique (SAp), IRFU/DSM/CEA-Saclay, F-91191 Gif-sur-Yvette Cedex, France
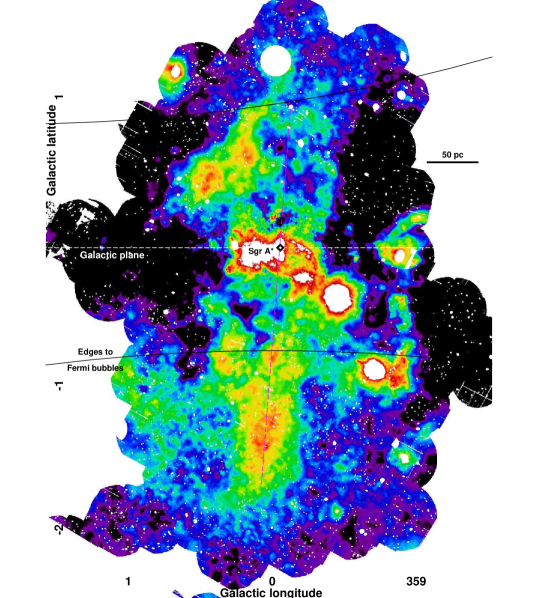
Figure 1 shows an X-ray map of the central parsec of the Milky Way, providing us with an unprecedented view of the Galactic corona, which we obtained via observations with the XMM-Newton satellite between 2016 and 2018, in addition to archival data7. Strong, low-energy photo-absorption that hinders the mapping of the large-scale diffuse emission in the GC region with ROSAT is alleviated in this image by using the wider energy band of XMM-Newton (see Methods). The Galactic supermassive black hole, Sgr A⋆, and its surrounding central cluster of massive stars8, are located at the centre, as are the pc bipolar lobes, visible as a barely resolved small white region perpendicular to the plane. The striking new features in this image are the elongated and slightly edge-brightened structures ( or pc across) to the North and South of Sgr A⋆. We refer to these quasi linear features, which appear to connect the GC to the Galactic bulge, as the northern and southern Galactic Centre Chimneys. The northern Chimney is roughly co-spatial with the GCL. Both Chimneys share comparable X-ray brightness and colour. This suggests that they have a common origin that is most likely connected with the Galactic centre, and a common emission mechanism. Despite their similarities, the northern and southern Chimneys are not strictly symmetric about the Galactic plane, which can plausibly be attributed to “Galactic weather”, i.e., the differences in the rich interstellar medium (ISM) structures above and below the plane that interact/interfere with the GC outflows of mass and energy that have presumably hewed the Chimneys.
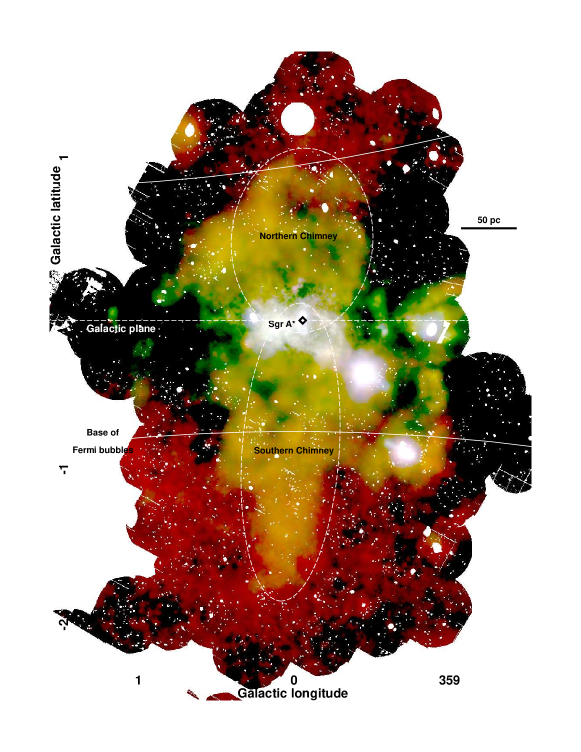
Parallel to the plane, the breadth of the newly discovered features is limited to pc (), while in the latitudinal direction, the Chimneys span more than a degree above and below the plane, where they merge with much more extended warm plasma emission seen by ROSAT and tentatively identified as the X-ray counterparts of the Fermi bubbles (see Fig. 5; 4,9). Towards the plane, the Chimneys can be traced down to . Morphologically, they appear to originate from a region within pc of Sgr A⋆, with the pc bipolar lobes nested at the centre.
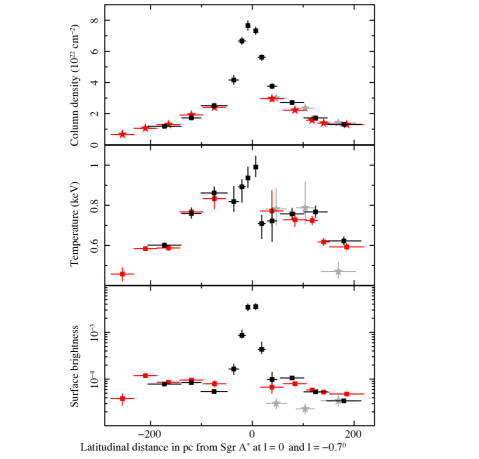
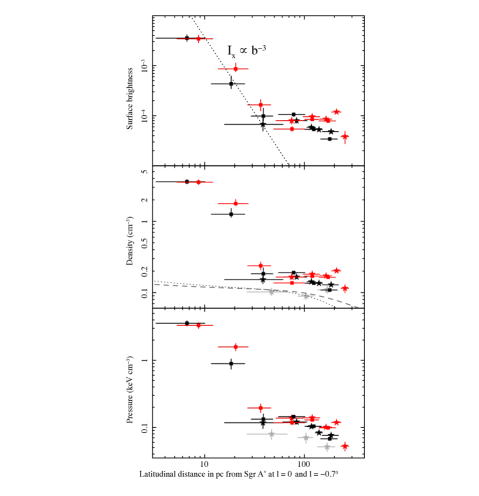
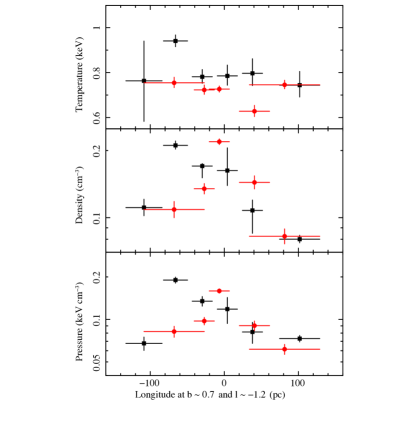
These pc bipolar lobes are traced down to parsec scale by plasma with temperature keV. Their X-ray surface brightness declines rapidly with latitude to between a few to pc, indicating a strong pressure gradient (see Fig. 2, 310,7). Such a pressure gradient cannot be compensated by the gravitational potential of the central region; therefore the gas in the bipolar lobes must be outflowing (Fig. 3). Under the assumption of freely expanding conical or paraboloidal outflow11, the temperature should drop rapidly with latitude due to adiabatic expansion, converting it into a fast and cold gas stream. Such scenarios are often invoked for the extra-planar outflows in star-forming galaxies12,13,14, where the observed X-rays are merely tracers of a much more powerful energy- and mass-loaded outflow.
Alternatively, the observed X-rays could be coming from the shock-heated gas that surrounds the lobes, reminiscent of AGN-inflated bubbles in galaxy clusters. In this scenario, the temperature of the gas would characterise the expansion velocity of the lobes.
To obtain a conservative limit on the power of the pc structure, we assume that the X-ray gas is volume filling and the outflow velocity is comparable to the sound speed, , set by the gas temperature. The thermal energy of the pc lobes is then and the power of the outflow averaged over the sound-crossing time of the lobes, , is . These are relatively modest requirements in terms of the time-averaged energetics that could be satisfied by accretion-powered events from the Galactic centre black hole, which may arise e.g., from tidal disruption of stars, releasing every few 15,16 and/or by supernovae explosions in the central star cluster17. If the X-ray emitting gas has a very low filling factor, then the actual energetics of the pc outflow could be much larger than the values quoted above.
At latitudes larger than pc, the X-ray emission from the pc bipolar lobes blends into the more extended emission of the newly discovered Chimneys. Within the northern Chimney, the plasma temperature remains roughly constant at keV over its entire extent ( pc; Fig. 2). This and the shell-like morphology of the northern Chimney are easily understood if this mild outflow encounters a cap partly obstructing its further latitudinal expansion6. The density within the Chimneys gently decreases with latitude from at pc to at pc. The thermal energy in the Chimneys, derived from the X-ray data as is done above for the pc lobes, is erg. Using again the sound crossing time of the 160 pc structure ( yr) as an estimate for the energy replenishment time, one gets the power . Although this is a factor of 5 higher than the estimated power for the pc lobes, it is still consistent with the supernovae or tidal disruption scenarios. Note that for the plasma in the Chimneys, the Galactic gravitational potential may not be negligible; therefore the keV plasma might be close to hydrostatic equilibrium (Fig. 2), rather than outflowing at the sound speed. In this scenario, the Chimneys testify the channel excavated by the powerful outflows associated with a series of past episodic events and connecting the GC with the halo. The past outflows might have been even more collimated than its relics (the Chimneys) appear today. The long cooling time ( yr) and the shallow density gradient in the vertical direction do not contradict this scenario. However, the edge-brightened morphology of the Chimneys rather favours the dark (e.g., cold or low density) flow scenario, when X-rays at the edges are due to the flow interaction with the denser ISM.
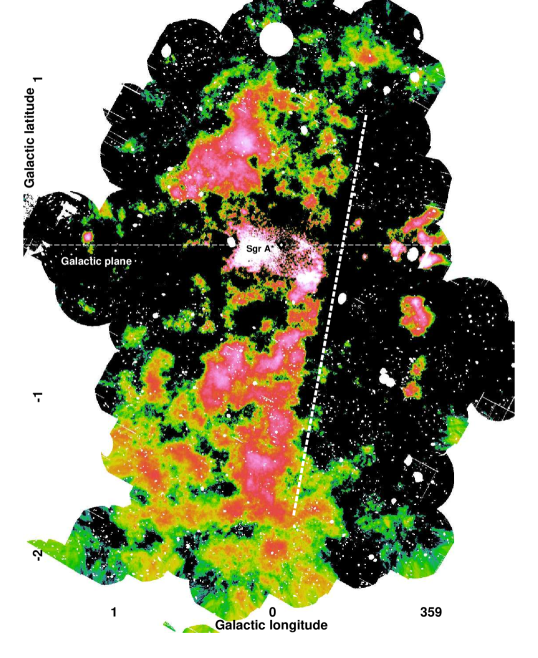
The Chimneys appear to be well confined in the longitudinal direction, except for a “protrusion” on the eastern side of the northern Chimney (see Methods), and they have sharp edges along much of their vertical extent (Fig. 6). Given the estimated pressure of the X-ray emitting gas in the Chimneys () it seems plausible that either dense ISM phases or magnetic pressure ( would be required) can provide the necessary confinement. For example, radio surveys of the central few degrees indicate a rather strong magnetic field18,19,20, rising vertically from the central molecular zone. The almost cylindrical shape of the Chimneys and their widths of at , raises the possibility that they are formed by a distributed energy injection process in the plane, evidence that would favour a star-formation powered scenario. This is corroborated by the observations that the majority of the evolved massive stars of the central molecular zone are concentrated at the feet of the Chimneys21,22. It is worth noting that for a flow through a channel with a constant cross section, the pressure experiences a modest drop [factor of ] along the cylindrical part of the channel (due to the acceleration of the gas and the Galactic gravitational potential), but can drop dramatically once the channel flares. The observed temperature of the gas in the Chimneys, if viewed as a proxy for a typical energy-per-particle value for injected energy and mass, also appears to be within a factor of few from what is usually assumed in star-formation driven scenarios23.
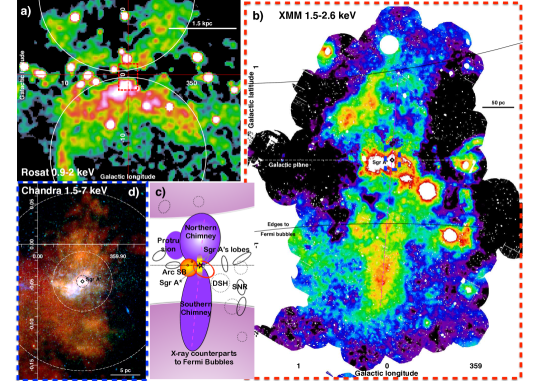
In the direction perpendicular to the Galactic plane, the Chimneys extend beyond one degree, where they appear to merge with the FB, as suggested by the extrapolation of the boundaries of the extended structures seen in ROSAT images to small latitudes (Fig. 5, 724). We tentatively associate the transition from the Chimneys to the FB with a modest drop of temperature, which in the northern Chimney occurs 160 pc above the plane. In the surface brightness distribution, the transition is also relatively inconspicuous.
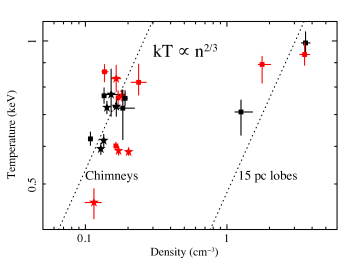
With these new data, two questions arise. One is whether the inner pc bipolar lobes and the larger 160 pc Chimneys are parts of the same outflow that starts very close to Sgr A⋆. While this cannot be entirely excluded due to the likely intermittency of the energy release, the X-ray data do not directly support the idea that the Chimneys are a continuation of the inner lobes. For instance, the density-temperature relations shown in Fig. 3 indicate that the entropies associated with these two flows are markedly different, as shown by the data following two separate adiabatic relations (). Rather, the inner lobes appear to be embedded into the volume occupied by the larger Chimneys. At the same time, the hypothesis that both structures are powered by the same physical mechanism cannot be excluded. One plausible candidate for such a universal mechanism is the energy released by supernovae. In this scenario, it is the strongly uneven distribution of massive stars over the GC region (one concentration close to Sgr A⋆ and another one distributed over ) that leads to the nested appearance of two outflows, rather than to a single one.
The hypothesis in this paper is that the Chimneys could be the channel that transports the energy from the active GC region to the FB. Their morphology does suggest so. The various estimates of the power needed to create and sustain the FB differ by several orders of magnitude, from few to , depending on the assumed source of energy and its intermittency4,25,26. The lower end of these estimates is within an order of magnitude of the Chimney energetic, which is plausibly a lower limit. The “low-power” models are predominantly associated with quasi-continuous star formation wind scenarios25,27,28 and the observed morphology of the Chimney is reminiscent of these wind models, albeit with some modifications, e.g., related with the shape of the “nozzle” that confines the flow over pc. In the supernovae-powered scenario described above, the role of Sgr A⋆ (and the pc bipolar lobes) is subdominant, assuming that the distribution of massive stars is a good proxy for the energy release. However, extremely energetic events associated with accretion episodes onto Sgr A⋆, like tidal disruption events and instances of Seyfert-like activity, remain a viable scenario too29,30. In this case, the channel created by the Chimneys could alleviate the propagation of matter and energy from Sgr A⋆ to the rarefied and low pressure regions above the disc (see, e.g., 27).
Irrespective of their primary source, the GC Chimneys reveal the exchange of energy, plasma and metals between galactic disks and their bulges and they provide preferential channels to connect galactic centres to their halos. Understanding the outflows produced by the low level of accretion onto Sgr A⋆ and star-formation at low rates is of central importance to learning about processes surrounding low luminosity active galactic nuclei and quiescent galaxies.
References
- [1] Ponti, G., Morris, M. R., Terrier, R., & Goldwurm, A. Traces of Past Activity in the Galactic Centre. Cosmic Rays in Star-Forming Environments, 34, 331 (2013)
- [2] Morris, M., Baganoff, F., Muno, M., et al. Deep X-Ray Imaging of the Central 20 Parsecs of the Galaxy with Chandra. Astronomische Nachrichten Supplement, 324, 167 (2003)
- [3] Zhao, J.-H., Morris, M. R., & Goss, W. M. A New Perspective of the Radio Bright Zone at The Galactic Center: Feedback from Nuclear Activities. ApJ, 817, 171 (2016)
- [4] Su, M., Slatyer, T. R., & Finkbeiner, D. P. Giant Gamma-ray Bubbles from Fermi-LAT: Active Galactic Nucleus Activity or Bipolar Galactic Wind? ApJ, 724, 1044 (2010)
- [5] Sofue, Y., & Handa, T. A radio lobe over the galactic centre. Nature, 310, 568 (1984)
- [6] Law, C. J. A Multiwavelength View of a Mass Outflow from the Galactic Center. ApJ, 708, 474 (2010)
- [7] Ponti, G., Morris, M. R., Terrier, R., et al. The XMM-Newton view of the central degrees of the Milky Way. MNRAS, 453, 172 (2015)
- [8] Genzel, R., Eisenhauer, F., & Gillessen, S. The Galactic Centre massive black hole and nuclear star cluster. Reviews of Modern Physics, 82, 3121 (2010)
- [9] Kataoka, J., Tahara, M., Totani, T., et al. Suzaku Observations of the Diffuse X-Ray Emission across the Fermi Bubbles’ Edges. ApJ, 779, 57 (2013)
- [10] Heard, V., & Warwick, R. S. XMM-Newton observations of the Galactic Centre Region - I. The distribution of low-luminosity X-ray sources. MNRAS, 434, 1339 (2013)
- [11] Chevalier, R. A., & Clegg, A. W. Wind from a starburst galaxy nucleus. Nature, 317, 44 (1985)
- [12] Heckman, T. M., Armus, L., & Miley, G. K. On the nature and implications of starburst-driven galactic superwinds. ApJS, 74, 833 (1990)
- [13] Suchkov, A. A., Balsara, D. S., Heckman, T. M., & Leitherer, C. Dynamics and X-ray emission of a galactic superwind interacting with disk and halo gas. ApJ, 430, 511 (1994)
- [14] Krumholz, M. R., Kruijssen, J. M. D., & Crocker, R. M. A dynamical model for gas flows, star formation and nuclear winds in galactic centres. MNRAS, 466, 1213 (2017)
- [15] Rees, M. J. Tidal disruption of stars by black holes of 10 to the 6th-10 to the 8th solar masses in nearby galaxies. Nature, 333, 523 (1988)
- [16] Generozov, A., Stone, N. C., Metzger, B. D., & Ostriker, J. P. Circumnuclear media of quiescent supermassive black holes. MNRAS, 478, 4030 (2018)
- [17] Lu, J. R., Do, T., Ghez, A. M., et al. Stellar Populations in the Central 0.5 pc of the Galaxy. II. The Initial Mass Function. ApJ, 764, 155 (2013)
- [18] Morris, M. The Galactic Center Magnetosphere. Journal of Physics Conference Series, 54, 1 (2006)
- [19] Crocker, R. M., Jones, D. I., Melia, F., Ott, J., & Protheroe, R. J. A lower limit of 50 microgauss for the magnetic field near the Galactic Centre. Nature, 463, 65 (2010)
- [20] Eatough, R. P., Falcke, H., Karuppusamy, R., et al. A strong magnetic field around the supermassive black hole at the centre of the Galaxy. Nature, 501, 391 (2013)
- [21] Mauerhan, J. C., Muno, M. P., Morris, M. R., Stolovy, S. R., & Cotera, A. Near-infrared Counterparts to Chandra X-ray Sources Toward the Galactic Center. II. Discovery of Wolf-Rayet Stars and O Supergiants. ApJ, 710, 706 (2010)
- [22] Dong, H., Wang, Q. D., & Morris, M. R. A multiwavelength study of evolved massive stars in the Galactic Centre. MNRAS, 425, 884 (2012)
- [23] Strickland, D. K., & Stevens, I. R. Starburst-driven galactic winds - I. Energetics and intrinsic X-ray emission. MNRAS, 314, 511 (2000)
- [24] Bland-Hawthorn, J., & Cohen, M. The Large-Scale Bipolar Wind in the Galactic Center. ApJ, 582, 246 (2003)
- [25] Crocker, R. M., & Aharonian, F. Fermi Bubbles: Giant, Multibillion-Year-Old Reservoirs of Galactic Center Cosmic Rays. Physical Review Letters, 106, 101102 (2011)
- [26] Kataoka, J., Sofue, Y., Inoue, Y., et al. X-Ray and Gamma-Ray Observations of the Fermi Bubbles and NPS/Loop I Structures. Galaxies, 6, 27 (2018)
- [27] Lacki, B. C. The Fermi bubbles as starburst wind termination shocks. MNRAS, 444, L39 (2014)
- [28] Sofue, Y. The 200-pc molecular cylinder in the Galactic Centre. MNRAS, 470, 1982 (2017)
- [29] Bland-Hawthorn, J., Maloney, P. R., Sutherland, R. S., & Madsen, G. J. Fossil Imprint of a Powerful Flare at the Galactic Center along the Magellanic Stream. ApJ, 778, 58 (2013)
- [30] Roberts, S. R., Jiang, Y.-F., Wang, Q. D., & Ostriker, J. P. Towards self-consistent modelling of the Sgr A* accretion flow: linking theory and observation. MNRAS, 466, 1477 (2017)
.1 Data reduction and analysis
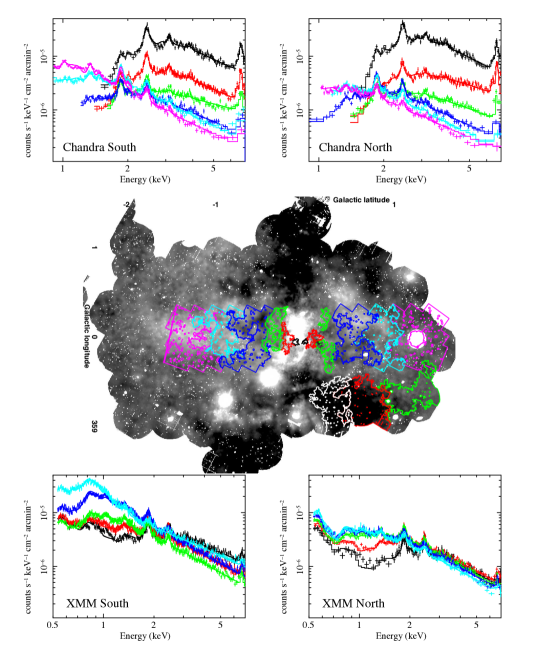
The basis of our results are smoothed X-ray images in different energy bands and spectra of the diffuse X-ray emission of the innermost Galactic corona. The X-ray maps are based on two recent XMM-Newton large observing programs comprising 46 observations of 25 ks exposure (see Fig. 4), in addition to all the available archival data (mainly concentrating on the scan of the central molecular zone7). All new observations are performed with the European Photon Imaging Camera (EPIC) PN31 and MOS CCDs32, in full-frame CCD readout mode with the medium optical filters applied. The XMM-Newton data reduction was performed using the Science Analysis System (SAS) version 16.1.0. For more details on the analysis pipeline see 33,7. Data products were downloaded from the respective archives, we screened times of high background and removed point sources. Detector background files were created and subtracted using the task evqpb, summing up filter-wheel-closed (FWC) files with 10 times the exposure of each observation.
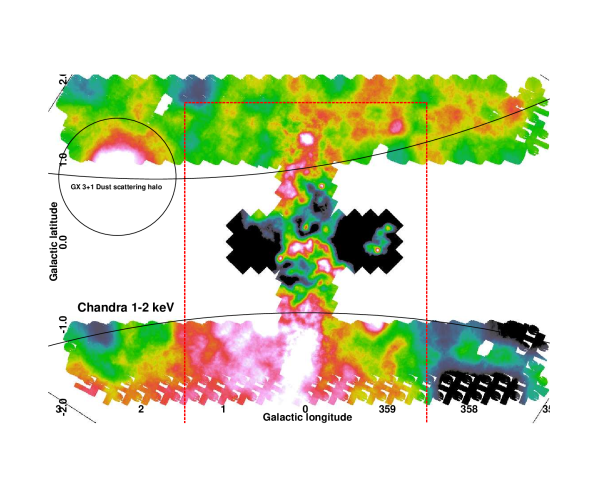
We also used archival observations with the Chandra Advanced CCD Imaging Spectrometer34 imaging (-I) CCD array (about 0.1 to 10 keV energy range). The Chandra ACIS-I observations were reprocessed using the Chandra Interactive Analysis of Observations software package35 version 4.5 and the Chandra Calibration Database version 4.5.9. For a detailed description of the data reduction pipeline see 36. We estimated the background in each Chandra observation via the CIAO tool acis_bkgrnd_lookup, which delivers a suitable blank-sky background file, provided by the Chandra X-ray centre37. The Chandra data have an exposure of about 50 ks in the central scan, 15 ks in the vertical extensions, and 2 ks in the large areas at higher latitude (see Fig. 7).
The combination of Chandra and XMM-Newton data provides the highest spatial () and spectral resolution ( full width half maximum, FWHM) available in soft X-rays.
For the XMM-Newton data we performed source detection on each individual observation and all detected point sources have been masked out. Readout streaks were included in background images. For Chandra data, we performed source detection on all datasets, simultaneously in multiple energy bands. A second point source detection was run on the merged images and, after carefully screening the detection list, the point sources were masked out from the image (in some cases additional regions were masked to screen dust-scattering halos and readout streaks of very bright sources). We then computed the background subtracted, exposure-corrected and adaptively smoothed images, resulting into smoothed flux images of diffuse emission (foreground, unresolved point sources, and intrinsic GC hot plasma emission).
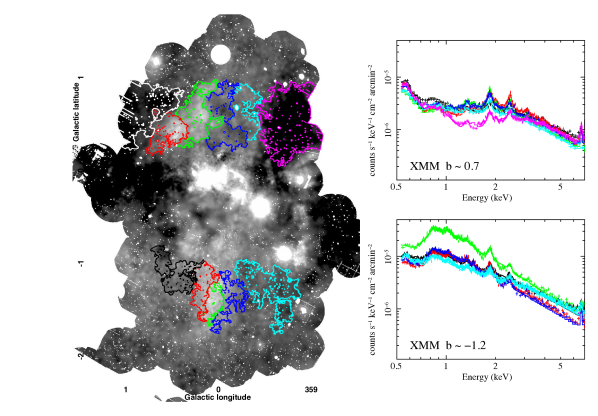
The flux images were then binned into regions of equal signal-to-noise (S/N) ratio 50 ( counts per bin) for Chandra and S/N 100 ( counts per bin) for XMM-Newton. The difference was chosen due to more stable background in Chandra compared to XMM-Newton. The contour binning technique contbin40 was used for this task. For each observation overlapping with one of the bins, spectra and response files were created and all contributions were added with proper weighting to obtain one spectrum for each spatial bin. These small scale bins were then added up to obtain higher S/N spectra for regions of interest (see Figs. 9 and 10). Each of the regions shown in Figs. 9 and 10 consists of 5-7 merged initial bins. The spectra in the 0.5-7 keV energy range were then fitted with emission models using XSPEC41 version 12.9.1n. The best fit parameters were used to derive the profiles shown in Figs. 2, 3, and 8.
We identified the following XSPEC model as best general description of the data (unless stated otherwise for tests), Tbabs (apec+pow+gauss+gauss)+Tbabs apec where the first foreground absorption (Tbabs model) is the absorption towards the GC, the first apec model is the intrinsic plasma at the GC, the pow and the two gauss models describe the powerlaw and two narrow Gaussian lines at 6.4 and 6.7 keV caused by unresolved point sources around the GC and non-thermal emission1 (the photon index of the power law was fixed to ). The second apec model with lower foreground absorption () and a temperature of about 0.2 keV describes a ”foreground” emission (i.e., between the observer and the GC, e.g., such as the contribution from the local bubble) that was observationally chosen to fit the data. Throughout this work we used the apec model for collisionally-ionised diffuse gas, which is based on the ATOMDB code v3.0.742. Uncertainties are quoted on the level unless stated otherwise. Abundances are according to Solar abundances as from 43. The distance to the GC was assumed to be 8 kpc44.
The profiles shown in Figs. 2, 3, and 8 are derived from the best fit values of the apec model to the intrinsic plasma component at the GC. The free fit parameters are the plasma temperature () and the model normalization (). The surface brightness profiles are given as . Density () and pressure () were derived assuming full ionization with 10 per cent helium and 90 per cent hydrogen (i.e. ),
| (1) |
| (2) |
where is the distance to the source in cm and V is the assumed volume in . The volume was calculated as the extraction surface area times the assumed depth. For the lobes we assumed a constant depth of . For the remaining diffuse emission, we assumed a uniform depth of , as suggested by the size of the Chimneys. A caveat of this approach is that the density beyond the Chimneys, at the foot of the Fermi-Bubbles, might be overestimated by a large factor, because that emission probably comes from a much larger volume. Indeed, if we assume a depth of 1.5 kpc for the high latitude emission, the expected particle density would drop to .
Comparing the surface brightness of the Fermi-bubble X-ray counterparts in ROSAT images with the high latitude emission observed with XMM-Newton, we found good agreement. The photon count rate in a ROSAT 1-2 keV (assuming effective area) mosaic image (Fig. 5) and in the XMM-Newton image () of the same band are consistent at (1-2 keV).
.2 Other sources powering Sgr A’s bipolar lobes
In the main article we suggested that Sgr A’s bipolar lobes are primarily powered by supernovae explosions and tidal disruption events. However, this does not exclude that other processes might provide a contribution in powering such features.
For example, can the current activity of Sgr A⋆ inflate the pc Sgr A’s bipolar lobes30? Studies of clusters of galaxies demonstrate that supermassive black holes accreting at low Eddington rates do generate outflows that inflate bubbles into the intra-cluster medium and have kinetic luminosities orders of magnitude larger than the instantaneous radiative power of these BH45,46. For Sgr A⋆ the quiescent radiative luminosity , when expressed in Eddington units, is even lower than for the black holes in galaxy clusters, firmly placing this object deep into a very low-luminosity regime47. It is plausible that in this regime the outflow power can exceed the radiative luminosity by a large factor, opening a possibility that Sgr A⋆ could provide the mechanical luminosity, needed to power the pc Sgr A bipolar lobes, even without invoking additional tidal disruption-like major outbursts.
.3 Uncertainty related with the unknown filling factor and abundances
The X-ray morphologies of all structures seen in ROSAT, XMM-Newton and Chandra images are very complicated with signs of edge-brightening. It is plausible that the X-ray-emitting gas is not volume filling, but represents patches of denser gas interacting with an outflow, as suggested by many simulations that involve rapid expansion and adiabatic cooling of matter in the outflow11. We nevertheless assume in the main paper the volume filling factor , to derive the gas density in the observed structures and estimate their total energy content. For , the recovered density scales as . Assuming that the energy density is uniform over the structure (in the longitudinal direction), the estimated total energy will be also lower than the true one by a factor and therefore should be treated as a lower limit.
Throughout the paper, we assume Solar abundances of the X-ray emitting plasma. This assumption is performed in order to avoid spurious degeneracies between the fitted parameters. We note that the X-ray emitting plasma in the plane, within the central molecular zone, has Solar or slightly super-Solar metallicities10,7,48. The metallicity is expected to drop with latitude. Indeed, the halo metallicity is expected to be significantly lower than Solar, with metallicities of the X-ray emitting plasma of the order of Solar, inside the FB9,26. To quantify the consequences of this assumption, we fitted one of the XMM-Newton spectra of the northern Chimney changing the assumed metallicity from to Solar. We observed that the best fit temperature and emissivity changed by and %, respectively.
References
- [31] Strüder, L., Briel, U., Dennerl, K., et al. The European Photon Imaging Camera on XMM-Newton: The pn-CCD camera. A&A, 365, L18 (2001)
- [32] Turner, M. J. L., Abbey, A., Arnaud, M., et al. The European Photon Imaging Camera on XMM-Newton: The MOS cameras : The MOS cameras. A&A, 365, L27 (2001)
- [33] Haberl, F., Sturm, R., Ballet, J., et al. The XMM-Newton survey of the Small Magellanic Cloud. A&A, 545, A128 (2012)
- [34] Garmire, G. P., Bautz, M. W., Ford, P. G., Nousek, J. A., & Ricker, G. R., Jr. Advanced CCD imaging spectrometer (ACIS) instrument on the Chandra X-ray Observatory. Proc. SPIE, 4851, 28 (2003)
- [35] Fruscione, A., McDowell, J. C., Allen, G. E., et al. CIAO: Chandra’s data analysis system. Proc. SPIE, 6270, 62701V (2006)
- [36] Hofmann, F., Sanders, J. S., Nandra, K., Clerc, N., & Gaspari, M. Thermodynamic perturbations in the X-ray halo of 33 clusters of galaxies observed with Chandra ACIS. A&A, 585, A130 (2016)
- [37] Markevitch, M., Bautz, M. W., Biller, B., et al. Chandra Spectra of the Soft X-Ray Diffuse Background. ApJ, 583, 70 (2003)
- [38] Sanders, J. S. Contour binning: a new technique for spatially resolved X-ray spectroscopy applied to Cassiopeia A. MNRAS, 371, 829 (2006)
- [39] Arnaud, K. A. XSPEC: The First Ten Years. Astronomical Data Analysis Software and Systems V, 101, 17 (1996)
- [40] Foster, A. R., Ji, L., Smith, R. K., & Brickhouse, N. S. Updated Atomic Data and Calculations for X-Ray Spectroscopy. ApJ, 756, 128 (2012)
- [41] Anders, E., & Grevesse, N. Abundances of the elements - Meteoritic and solar. GeCoA, 53, 197 (1989)
- [42] Eisenhauer, F., Schödel, R., Genzel, R., et al. A Geometric Determination of the Distance to the Galactic Center. ApJ, 597, L121 (2003)
- [43] Churazov, E., Forman, W., Jones, C., & Böhringer, H. Asymmetric, arc minute scale structures around NGC 1275. A&A, 356, 788 (2000)
- [44] Fabian, A. C. Observational Evidence of Active Galactic Nuclei Feedback. ARA&A, 50, 455 (2012)
- [45] Yuan, F., & Narayan, R. Hot Accretion Flows Around Black Holes. ARA&A, 52, 529 (2014)
- [46] Koyama, K. Diffuse X-ray sky in the Galactic center. PASJ, 70, R1 (2018)
This work is dedicated to Alice Maria Ponti. GP acknowledges Andrea Merloni for discussion and the Max-Planck-Institut für Astronomie Heidelberg for hospitality. This research has made use both of data obtained with XMM-Newton, an ESA science mission with instruments and contributions directly funded by ESA Member States and NASA and with the Chandra Data Archive and software provided by the Chandra X-ray Center (CXC). G. Ponti and F. Hofmann acknowledge financial support from the Bundesministerium für Wirtschaft und Technologie/Deutsches Zentrum für Luft- und Raumfahrt (BMWI/DLR, FKZ 50 OR 1604, FKZ 50 OR 1715 and FKZ 50 OR 1812) and the Max Planck Society. AG and RT acknowledge support from CNES.
The authors declare that they have no competing financial interests.
The datasets analysed during the current study and the software to perform the analysis are available in the XMM-Newton, Chandra and ROSAT repository: http://nxsa.esac.esa.int, https://www.cosmos.esa.int, http://cxc.harvard.edu and http://www.xray.mpe.mpg.de/rosat/archive.
Correspondence and requests for materials should be addressed to
G. Ponti (ponti@mpe.mpg.de).