The link between the Hidden Broad Line Region and the accretion rate in Seyfert 2 galaxies
Abstract
In the past few years more and more pieces of evidence have been presented for a revision of the widely accepted Unified Model of Active Galactic Nuclei. A model based solely on orientation cannot explain all the observed phenomenology. In the following, we will present evidence that accretion rate is also a key parameter for the presence of Hidden Broad Line Regions in Seyfert 2 galaxies. Our sample consists of 21 sources with polarized Hidden Broad Lines and 18 sources without Hidden Broad Lines. We use stellar velocity dispersions from several studies on the Caii and Mg b triplets in Seyfert 2 galaxies, to estimate the mass of the central black holes via the - relation. The ratio between the bolometric luminosity, derived from the intrinsic (i.e. unabsorbed) X-ray luminosity, and the Eddington luminosity is a measure of the rate at which matter accretes onto the central supermassive black hole. A separation between Compton-thin HBLR and non-HBLR sources is clear, both in accretion rate () and in luminosity (). When, properly luminosity-corrected, Compton-thick sources are included, the separation between HBLR and non-HBLR is less sharp but no HBLR source falls below the Eddington ratio threshold. We speculate that non-HBLR Compton-thick sources with accretion rate higher than the threshold, do possess a BLR, but something, probably related to their heavy absorption, is preventing us from observing it even in polarized light.
Our results for Compton-thin sources support theoretical expectations. In a model presented by Nicastro (2000), the presence of broad emission lines is intrinsically connected with disk instabilities occuring in proximity of a transition radius, which is a function of the accretion rate, becoming smaller than the innermost stable orbit for very low accretion rates and therefore luminosities.
1 Introduction
The widely accepted unification model for active galactic nuclei (AGNs) invokes the same paradigm for Seyfert 2 and Seyfert 1 galaxies (Antonucci 1993). The two different types of galaxies are believed to be intrinsically the same but differ, observationally, due only to orientation: Seyfert 1 galaxies are observed at large accretion disk-line of sight angles (face-on) while Seyfert 2 galaxies are seen edge-on through large column densities of obscuring material in the accretion disk plane, which prevent the direct view of the nuclear regions of these sources. This scenario came into existence after the discovery of polarized broad permitted emission lines in one of the brightest Seyfert 2 galaxies, NGC 1068 (Antonucci and Miller 1985; Miller and Antonucci 1983), suggesting a geometry in which: (a) BLRs are confined in a relatively small region ( light-days) surrounding the central source, (b) their direct view (in Seyfert 2s) is obscured by a flat distribution of distant material coplanar with the disk-plane, and (c) their line emission is Compton-scattered into the line of sight direction off a population of hot electrons extending at large radii above and below the accretion disk.
In the past few years, exceptions to orientation-based unification models have been found, suggesting the possibilty that not all Seyfert 2 galaxies host a Seyfert 1 nucleus. Indeed, spectropolarimetric surveys find that only about the 50 of the brightest Seyfert 2 galaxies show hidden broad-line regions (HBLR) in their optical-polarimetric spectra (Tran 2001, 2003). Several authors have suggested that the presence of BLRs in Seyfert 2s can be linked to the luminosity of the active nucleus, and may disappear at low luminosities (Lumsden and Alexander 2001; Tran 2001; Gu and Huang 2002; Martocchia and Matt 2002; Tran 2003; Laor 2003; Elitzur and Ho 2009) or low accretion rates (Nicastro 2000; Nicastro et al. 2003; Czerny et al. 2004) . In both cases, the presence of the BLR is not an inescapable feature of all Seyfert galaxies, as postulated by the unification model, but it is tightly linked to a physical parameter of the AGN, either the luminosity or the accretion rate. However, recent works, casted doubts on these conclusions (e.g. Bian and Gu 2007). In these works large, but inhomogeneous, samples were used to identify a physical parameter responsible for the existence or absence of HBLR in AGNs, but no clear indication for the existence of such a parameter was found. We think that this is largely due to the use of the [OIII] luminosities as a proxy of the nuclear activity of the AGN, and the difficulty in correcting this for extinction in obscured objects. It has been shown by several author, by comparing AGN luminosities derived from [OIII] and [OIV] emission line luminosities, that the observed [OIII] luminosities often suffer significant attenuation in typical Seyfert 2 galaxies (e.g. Haas et al. 2005; Meléndez et al. 2008; Diamond-Stanic et al. 2009; Goulding & Alexander 2009; Baum et al. 2010; Kraemer et al. 2011) and that the efforts to use standard extinction correction for [OIII] are not always reliable (e.g. Goulding & Alexander 2009; LaMassa et al. 2010).
[OIV] emission line luminosities might therefore be more reliable than [OIII] luminosities, as tracers of the intrinsic nuclear emission. However, they are still an indirect proxy of the nuclear continuum emission. In this paper, instead, we use the observed X-ray (2-10 keV) continuum emission as a direct probe of the AGN activity. We selected a sample of type 2 AGN with good quality spectropolarimetric and X-ray observations, for which we can give a good estimate of the mass of the central supermassive black hole (BH). 111Our work is based on a previous study discussed in Nicastro et al. (2003), but here we use a wider sample and more robust estimates of the BH masses. By doing so, we find evidence suggesting that accretion rate is the main parameter that sets the existence of HBLRs in Seyfert 2 galaxies.
2 The Sample
Our starting sample is mostly based on the spectropolarimetric surveys performed by Tran (1995, 2001, 2003) on the Seyfert 2 galaxies included in the CfA (Huchra and Burg 1992) and 12 m (Rush et al. 1993) samples. Additionally, we included objects from other, high-quality, spectropolarimetric studies (Tran et al. 1992; Young et al. 1996; Moran et al. 2000; Lumsden and Alexander 2001). From this sample, consisting of 90 candidates, we selected only sources with available mass (Section 2.1) and bolometric luminosity (Section 2.2) estimates, and so for which their accretion rate can be evaluated. For each source, we evaluate their accretion rate in units of Eddington, as the ratio (hereafter ), where
| (1) |
Hidden Broad Line Region Seyfert 2s
Object name
Obs. ID
C-Thin
(km s-1)
log
log
log
log
log
log
References
(a)
(b)
(c)
(d)
(e)
(f)
(g)
(h)
(i)
(l)
(m)
(n)
CIRCINUS
PN- 0111240101
X
6.42
42.62
43.76
-0.75
40.92
40.58
1, 13
IC 3639
XIS-702011010
X
6.90
150
42.64
43.80
-1.20
41.89
40.66
1,8
IC 5063
XIS-704010010
✓
7.74
42.83
44.03
-1.81
41.56
41.40
2,8
IRAS01475-0740
PN-0200431101
X
7.05
43.52
44.90
-0.25
41.76
40.74
1,8
MCG -2-8-39
PN-0301150201
✓
7.32
42.57
43.70
-1.72
41.16
41.07
1,8
Mrk 3
XIS-100040010
X
8.51
44.44
46.10
-0.51
43.27
41.97
1, 10
Mrk 348
PN-0067540201
✓
7.19
43.41
44.77
-0.52
41.96
40.95
2,8
Mrk 1210
PN-0002940701
✓
6.57
43.02
44.24
-0.43
42.37
-
1,9
NGC 513
PN-0301150401
✓
7.63
42.72
43.93
-1.80
41.14
40.74
2,8
NGC 591
PN-0200431001
X
7.04
43.02
44.27
-0.87
41.97
-
2,10
NGC 788
XIS-703032010
✓
7.51
43.15
44.43
-1.18
40.73
40.97
2,10
NGC 1068
PN-0111200201
X
7.59
43.02
44.27
-1.42
42.38
41.81
1,8
NGC 2273
XIS-702003010
X
7.46
42.73
43.90
-1.65
41.13
40.07
2, 10
NGC 3081
XIS-70301301
✓
7.13
42.50
43.61
-1.62
41.43
41.09
1,10
NGC 4388
XIS-800017010
✓
119
7.22
42.90
44.12
-1.20
41.85
41.58
3,8
NGC 4507
XIS-702048010
✓
7.65
43.11
44.39
-1.36
42.19
41.02
1,10
NGC 5252
PN-0152940101
✓
8.04
43.04
44.30
-1.84
42.05
-
2,11
NGC 5506
PN-0554170101
✓
180
7.95
43.05
44.30
-1.75
41.45
41.28
4,8
NGC 7212
PN-0200430201
X
7.51
43.77
45.22
-0.38
42.73
-
1,13
NGC 7674
PN-0200660101
X
7.56
43.96
45.47
-0.18
42.57
41.97
2,8
NGC 7682
PN-0301150501
X
7.28
43.02
44.27
-1.11
41.76
41.01
2,8
Non Hidden Broad Line Region Seyfert 2s
Object name
Obs. ID
C-Thin
(km s-1)
log
log
log
log
log
log
References
(a)
(b)
(c)
(d)
(e)
(f)
(g)
(h)
(i)
(l)
(m)
(n)
M51
PN-0303420101
X
6.57
41.54
42.51
-2.17
40.03
39.01
2,8
Mrk 573
AS-7745
X
7.60
43.10
44.37
-1.33
42.39
41.71
1,8
Mrk 1066
PN-0201770201
X
7.22
42.92
44.15
-1.17
42.27
-
2,10
NGC 1320
PN-0405240201
X
7.29
42.69
43.86
-1.54
41.08
40.67
2,8
NGC 1358
PN-0301650201
X
7.99
43.05
44.31
-1.79
41.36
40.56
2,10
NGC 1386
XIS-702002010
X
7.42
41.62
42.59
-2.92
41.09
40.25
1,8
NGC 1667
XIS-701006010
X
173
7.88
42.56
43.70
-2.28
42.03
40.51
3,8
NGC 3079
XIS-803039020
X
7.63
42.02
43.05
-2.68
40.48
39.53
6,8
NCG 3281
XIS-703033010
✓
7.91
42.65
43.81
-2.20
41.30
41.58
1,10
NGC 3982
PN-0204651201
X
6.55
41.15
42.06
-2.59
40.33
39.10
5,8
NGC 5135
XIS-702005010
X
7.29
43.10
44.37
-1.02
42.21
41.48
1,8
NGC 5283
AS-4846
✓
7.60
41.54
42.49
-3.21
40.88
-
2,8
NGC 5347
XIS-703011010
X
6.97
42.39
43.49
-1.58
41.22
40.01
3,8
NGC 5728
XIS-701079010
X
209
8.21
43.29
44.61
-1.69
42.83
41.36
7,11
NGC 7582
PN-0112310201
✓
7.13
41.90
42.91
-2.32
41.63
41.11
1,8
NGC 7130
XIS-703012010
X
7.59
43.10
44.37
-1.32
42.55
40.94
1,12
NGC 7172
PN-0202860101
✓
7.74
42.73
43.90
-1.93
40.84
40.82
1,8
UGC 6100
PN-0301151101
X
7.69
42.84
44.05
-1.75
42.18
-
2,8
2.1 The BH mass sub-selection
In this work, BH masses are homogenuously derived for the entire sample, by using uniquely the - relation (Tremaine et al. 2002):
| (2) |
Stellar velocity dispersions () were mainly taken from Nelson and Whittle (1995) and Garcia-Rissmann et al. (2005). These estimates are all based on direct meaurements of Caii (8498 , 8542 and 8662 ) and Mgi (5167 , 5172 and 5183 , hereinafter Mg b) triplet absorption, imprinted by the interstellar medium of Seyfert 2 galaxies. For sources with more than one measurement, we used that with smaller error bars. Uncertainties on the BH mass estimates based on the - relation, come from the statistical errors on the measurements (listed in Table 1) as well as from the spread in the - relation itself, estimated in 0.44 dex (Gültekin et al. 2009). This spread is generally much larger than the statistical error on . We therefore assumed an uncertainty of 0.44 dex for all our BH mass estimates. Stellar velocity dispersions and their associated uncertainties, as well as BH masses, are listed in Table 1 (columns (d) and (e), respectively).
The selection reduced the original spectropolarimetric sample to 46 sources with direct measurements.
2.2 The X-Ray Sub-Selection and the Final Sample
To estimate the bolometric luminosity of the sources of our sample, we use the 2-10 keV luminosity, which is a direct tracer of the primary emission, and apply a bolometric correction. We searched the XMM-Newton, Chandra, Suzaku (the front-illuminated CCDs have the largest area at high energies), and Swift archives for observations of the sources of our sample of 46 objects with accurate BH-mass estimate. When multiple observations of a single target were available, we selected that with the highest S/N ratio in the 2-10 keV band. For all sources of our final sample, a minimum of 150 counts in the 2-10 keV band was required, to derive reliable estimates of the column density and, therefore, intrinsic X-ray luminosity. These criteria reduced the final sample to a total of 39 sources: 21 with polarized hidden Broad Emission Lines (HBLRs) and 18 sources without (non-HBLRs). These are listed in Table 1, together with the selected X-ray observations.
3 Data Analysis
3.1 X-ray Data Reduction and Analysis
Suzaku X-ray Imaging Spectrometer (XIS) data were processed with the latest calibration files available at the time of the analysis (2011-02-10 release), by using FTOOLS 16 and SUZAKU software Version 2.3, and adopting standard filtering procedures. Response matrices and ancillary response files were generated using XISRMFGEN and XISSIMARFGEN. The 0.5-10 keV spectra extracted from the front-illuminated XIS0 and XIS3 have been co-added via the ftool addascaspec.
We used only XMM-Newton observations performed with the EPIC-Pn camera (Strüder et al. 2001) operated in large window and medium filter modes. Source data ’cleaning’ (exclusion of flaring particle background intervals) and spectra extraction, were performed with SAS 10.0.0 (Gabriel et al. 2004) via an iterative process which leads to a maximization of the Signal-to-Noise Ratio (SNR), similarly to that described in Piconcelli et al. (2004). For each source, background spectra were extracted from source-free circular regions of the source field.
Finally, Chandra data were reduced with the Chandra Interactive Analysis of Observations (CIAO; Fruscione et al. 2006) 4.3 and the Chandra Calibration Data Base (CALDB) 4.4.1 software, by adopting standard procedures.
All the spectra with a high S/N ratio were binned in order to over-sample the instrumental resolution by at least a factor of 3 and to have no less than 30 counts in each background-subtracted spectral channel. This allows the applicability of the statistics. The adopted cosmological parameters are km s-1 Mpc-1, and . Errors are quoted at a confidence level of 90% for one interesting parameter (), if not otherwise stated. The spectral analysis was performed with the package xspec 12.7.0 (Arnaud 1996).
For all sources of our sample, we fit their 2-10 keV spectra with a general baseline model, consisting of a power law continnuum atennuated by the line of sight column of Galactic absorbtpion plus intrinsic absorption at the source redshift, plus three additional emission components: (a) a photoionized plasma emitter, to model the soft excess often detected in Seyfert 2s at E keV, (b) a cold Compton Reflector, scattering the primary nuclear photons off the inner walls of cold circum-nuclear material and along the line of sight, and (c) positive gaussian profiles, to model fluorescence emission lines of high-Z elements such as Fe at 6.4 keV, as required by the data. The model can be parameterized as:
| (3) |
where is the photoelectric cross-section (abundances as in Anders and Grevesse 1989), is the line-of-sight Galactic column density (Dickey and Lockman 1990); is the photoionized plasma emission (see Bianchi et al. 2010, for details on the adopted cloudy model); is the neutral absorbing column density at the redshift of the source; B is the normalization of the primary powerlaw with slope ; is the Compton-reflection component (modelled in Xspec with pexrav (Magdziarz and Zdziarski 1995)); and are the required Gaussian profiles.
Our adopted models do not aim at obtaining the ‘best fit’ for each source, but only a reliable estimate of the observed 2-10 keV luminosity (Table 1, column (g)). A more detailed description of the results of the fits, in particular for the photoionization cloudy component, is deferred to a future work.
3.2 Nuclear 2-10 keV Luminosity for Compton-Thick Sources
Compton-Thick sources are defined as sources for which the intrinsic column of absorbing gas, , is greater than
cm-2, so preventing us from directly observing the primary powerlaw below 10 keV.
The 2-10 keV spectra of Compton-thick sources are therefore generally adequately modeled by a pure-reflection component (i.e. reflection-dominated Seyfert 2s), which can only provide a measurement of the reflected, and not the nuclear, luminosity.
Several tracers can be used to estimate the bolometric luminosity of Compton-thick objects, e.g. [Oiii] (Lamastra et al. 2009) and [Oiv] (Rigby et al. 2009) . For homogeneity with the Compton-thin sources of our sample, here we use the observed X-ray luminosity, by applying the following procedure.
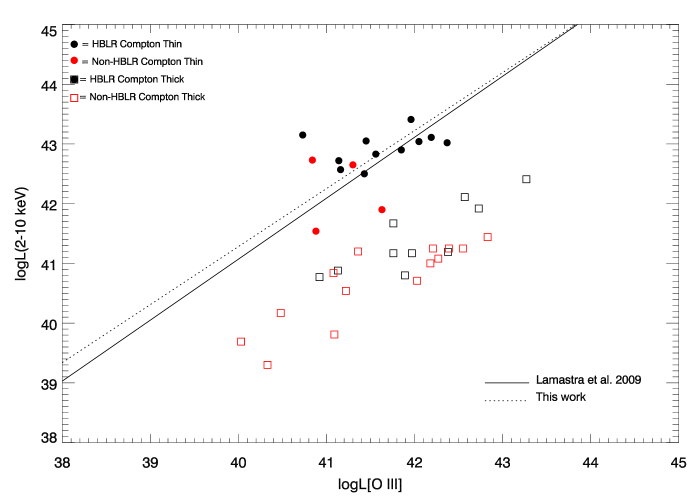
We compare the extinction-corrected [Oiii] luminosities of the sources of our sample (Table 1, column (l)), taken from Wu et al. (2011) and Bian and Gu (2007), with their observed 2-10 keV reflection-dominated luminosities. Both works correct the observed for extinction, by applying the relation in Bassani et al. (1999) :
| (4) |
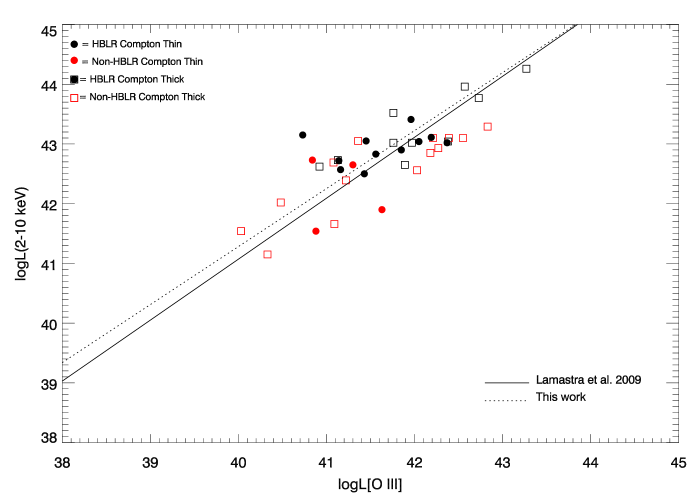
where an intrinsic Balmer decrement =3 is adopted. The results are shown in Fig. 1, top panel. All the Compton-Thick sources have a ratio smaller than the best fitting relation found by Lamastra et al. (2009) for a large sample of Compton-thin Seyfert 2s (solid line in Fig. 1: compare with the dotted line in the same figure, which best-fits the sub-sample of Compton-thin sources of our sample). For the Compton-thick sources of our sample, we find a mean value of . For the Compton-thin sources of their sample, instead, Lamastra et al. (2009) found a mean . The ratio between these two means can be used as an estimate of the correction factor needed to infer the nuclear 2-10 keV luminosity of Compton-thick sources, from their observed 2-10 keV luminosity: . The bottom panel of Fig. 1 shows the - plane for all the sources of our sample, after applying a correction factor of 70 to the observed 2-10 keV luminosity of all Compton-thick sources. Now all the sources of our sample lie on the Lamastra et al. (2009) relation for Compton-thin sources.
We decided to adopt this correction for all Compton-thick sources, also for those where E10 keV data were available (Suzaku PIN) and so a direct estimate of the nuclear continuum above 10 keV could in principle be attempted. This is because Compton scattering at high column densities may significantly suppress the observed intrinsic luminosity even at E 10 keV, and the modellization of these effects are highly dependent on the (unknown) geometry of the absorber (e.g. Matt et al. 1999). In the cases where objects presented observations in both Compton-thin and Compton-thick states in the past few years we chose the former, to infer with a higher precision the unabsorbed luminosity of the source. In one case (IRAS01475-0740 ), the 2-10 keV source spectrum is ambiguous: following the detailed analysis presented in Brightman and Nandra (2008) we classify this object as Compton-thick.
3.3 Bolometric Luminosities and Eddington Ratios
For each source of our sample, we used their intrinsic 2-10 keV luminosity (observed, for Compton-Thin sources, or inferred, for Compton-Thick sources, see previous section) to derive their bolometric luminosity, and thus Eddington ratio (Table 1, columns (h) and (i)), by adopting the luminosity-dependent relation presented in Marconi et al. (2004). We tested the importance of this assumption in our calculations, by trying different bolometric corrections (e.g. Elvis et al. 1994; Vasudevan and Fabian 2009), and comparing the results. The most significant differences, between these methods, were found at the extremes of the luminosity (accretion) range spanned by the sources of our sample. Therefore, the exact choice of the bolometric correction does not significantly affect our results.
The major contribution to the bolometric luminosity error determination comes from the uncertainty on the bolometric correction itself, which is generally significantly larger than the uncertainty on the X-ray luminosity. The bolometric correction proposed by Marconi et al. (2004) is based on the correlation between the UV luminosity at 2500 and the 2-10 keV X-ray luminosity, whose spread is estimated as 0.37 dex Young et al. (see eq. 3 of 2010). Therefore, we assume this uncertainty on our derived bolometric luminosities.
| Sample | N | P() | P() | P() | |||
|---|---|---|---|---|---|---|---|
| (1) | (2) | (3) | (4) | (5) | (6) | (7) | (8) |
| Non-HBLR Compton Thin | 4 | 0.5% | 4.4% | 0.1% | 43.90 | 42.73 | -1.9 |
| HBLR Compton Thin | 11 | ||||||
| Non-HBLR Compton Thick and Thin | 18 | 1.8% | 6.9% | 1.0% | 43.90 | 42.56 | -1.8 |
| HBLR Compton Thick and Thin | 21 | ||||||
| [OIII] | P( | ||||||
| Non-HBLR Compton Thin | 4 | 38.5% | 38.5% | 8.7% | 43.51 | 41.36 | -2.5 |
| HBLR Compton Thin | 11 | ||||||
| Non-HBLR Compton Thick and Thin | 18 | 23.2% | 23.2% | 25.7% | 43.54 | 41.39 | -2.1 |
| HBLR Compton Thick and Thin | 21 | ||||||
| [OIV] | P( | ||||||
| Non-HBLR Compton Thin | 3 | - | - | - | - | - | - |
| HBLR Compton Thin | 9 | ||||||
| Non-HBLR Compton Thick and Thin | 15 | 10.4% | 10.4% | 1.1% | 43.82 | 40.57 | -1.4 |
| HBLR Compton Thick and Thin | 17 |
For the Eddington ratios, we propagated the uncertainties on the BH mass and bolometric luminosity. This leads to an uncertainty of 0.5 dex in the Eddington ratios.
4 Results
We first considered only the Compton-thin sources of our sample. In the top panel of Fig. 2, we plot the bolometric luminosity against the Eddington ratio for all the Compton-thin sources of our sample.
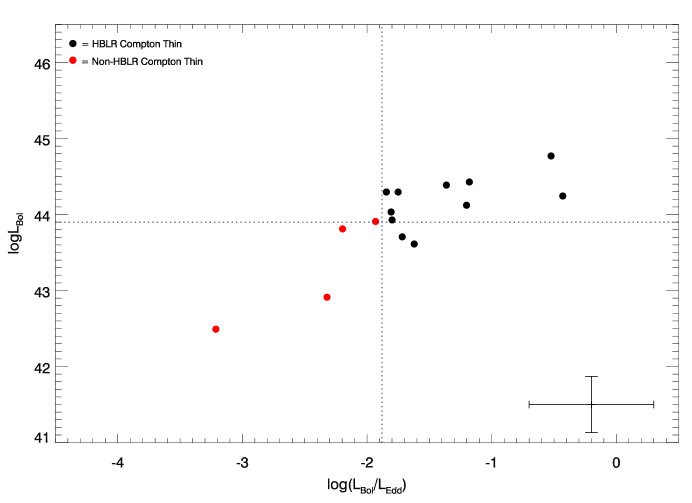
HBLR and non-HBLR sources are clearly separated both in luminosity and in accretion rate. To address the statistical significance of this separation (both in luminosity and accretion rate), we performed a two-sample Kolmogorov-Smirnov test on our data. These tests give probabilities of 0.5% (luminosity) and 0.1% (Eddington ratio) that the two classes are taken from the same parent population. These correspond to 2-sided Gaussian-equivalent significances of 2.8 and 3.3, respectively. The threshold Eddington ratio and luminosity that minimize the probability of chance separation, are and , respectively.
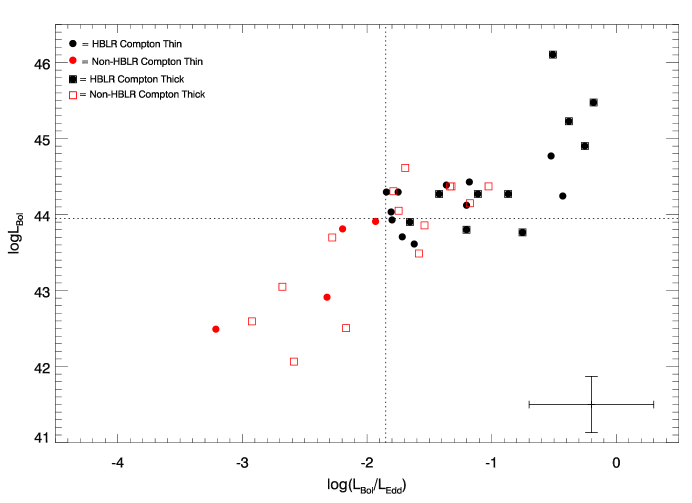
We then repeated our analysis, by including also Compton-thick sources (for which inferred intrinsic 2-10 keV luminosity estimates are uncertain: see Sect. 2.2). The inclusion of Compton-thick sources makes the HBLR versus non-HBLR separation less sharp (Fig. 2, bottom panel), and less significant, with probabilities of chance separation of 1.0% and 1.8%, for Eddington ratio and bolometric luminosity, respectively (Table 2), corresponding to statistical significances of only 2.4 and 2.6. However, we note that no HBLR source falls below the Eddington ratio threshold.
4.1 Comparison with other Works and Methodologies
Other authors investigated larger (but, in most cases inhomogeneous) samples to search for physical parameters responsible for the existence or absence of HBLRs in AGNs, and found often no clear indication for the existence of such a parameter (e.g. Bian and Gu 2007). However, we think that this is due to the non-homogenous nature of the assembled samples, or to the ill-suited methodologies used to derive bolometric luminosities and/or BH masses, or to a combination of both issues.
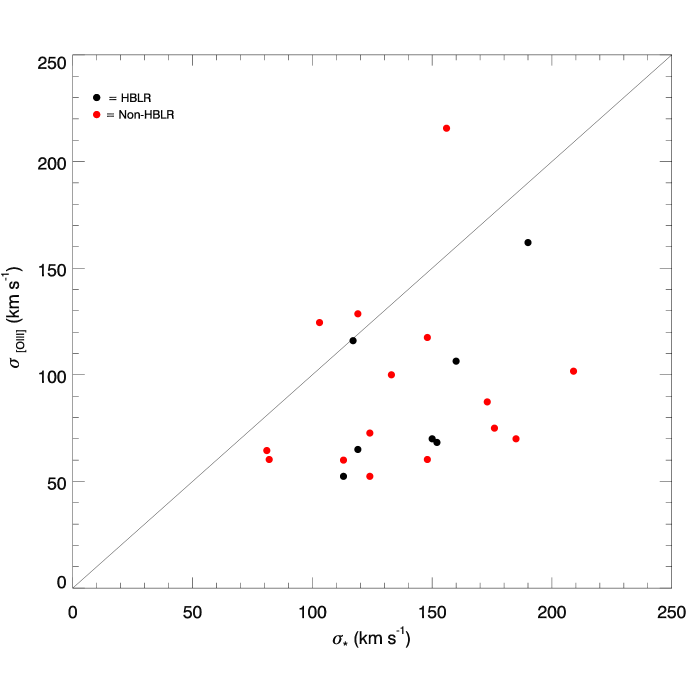
BH masses can be derived through a variety of different means (e.g. FWHM[OIII], ). Using all of these possible means, obviously allows for large samples to be assembled. However, building samples with black-hole mass determinations derived with different methods, introduces significant sources of uncertainties, which may wash out possible correlations among important physical parameters, like the source accretion rate or luminosity. For example, stellar velocity dispersion can in principle be inferred through the relation FWHM (Greene and Ho 2005), by making use of [Oiii] FWHM measurements, which are available for a large number of sources in the literaure. We tested the goodness of this estimator against the sources of our sample, for which direct stellar velocity dispersions are available. For all sources of our sample, we searched the literature for [Oiii] FWHM measurements, and applied the Greene and Ho (2005) relation to derive the stellar velocity dispersions. We then compared these estimates with the measurements of . Fig. 3 shows the result of this comparison: clearly the two values differ significantly and do not appear to be linearly correlated with one another. We, therefore, use only BH estimates based on direct measures of the , in order to avoid further uncertainties due to the indirect derivation of this parameter.
Another important source of potential error, is the proxy used to derive the nuclear bolometric luminosity of an obscured AGN.
In our work, we use 2-10 keV luminosities, which are a direct probe of the intrinisic nuclear activity.
However, such luminosities are available only for a limited number of Seyfert 2s.
On the contrary [Oiii] luminosities only echoes the intrinsic nuclear activity, but are available for a much larger number of
obscured AGNs.
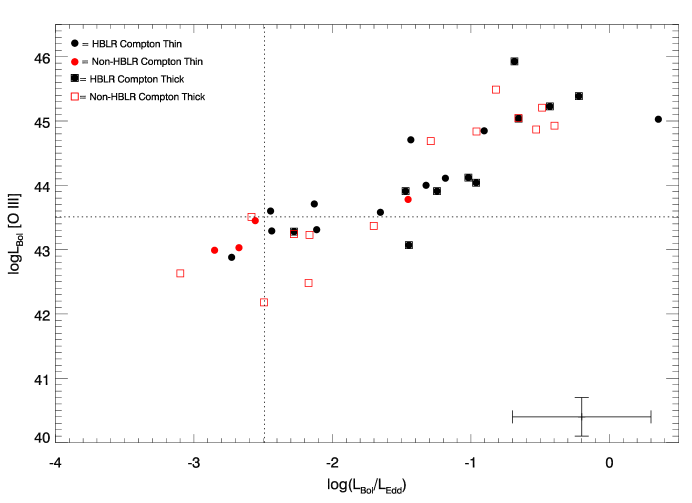
To check the goodness of the [Oiii] luminosity estimator, we compared our results with those obtained, for the sources of
our sample, by using the the [Oiii] luminosities and the bolometric luminosities derived from them, through the bolometric correction described in Lamastra et al. (2009). The results are shown in
Table 2 and Fig 4 (top panel): HBLR and non-HBLR sources are now mixed in both bolometric luminosities and
Eddington ratios, with no significant separation between the two classes.
The presence or absence of a clear separation, either in acrretion rates or bolometric luminosities, between Compton-thin
HBLRs and non-HBLRs, when these quantities are inferred from 2-10 keV (probabilities of chance separation of 0.1% and 0.5%,
for and , respectively) or [Oiii] (probabilities of chance separation of 8.7% and 38.5%) observed
luminosities, confirms (e.g. Lamastra et al. 2009; Trouille and Barger 2010, and references therein) that the [Oiii] luminosity is not a direct proxy
for the bolometric luminosity of an AGN.
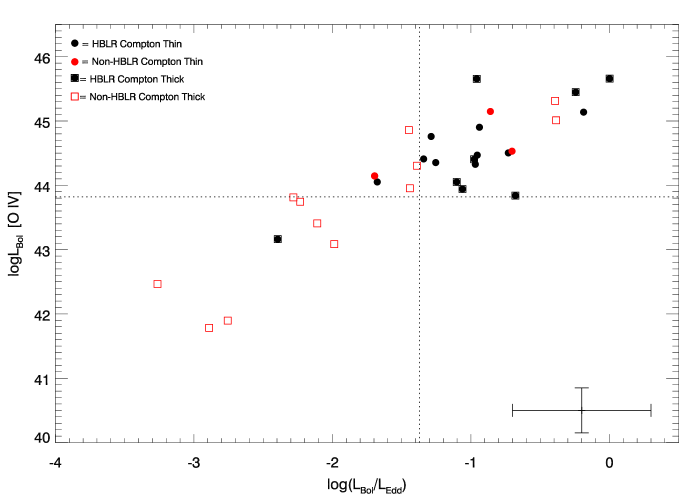
A large number of sources in our sample (32 out of 39) also have [Oiv] measurements (Pereira-Santaella et al. 2010; Weaver et al. 2010). For a few sources we inferred [Oiv] luminosities following the method presented in Goulding & Alexander (2009). Using the relation in Goulding
et al. (2010), both bolometric luminosities and accretion rates can be inferred from the [Oiv] luminosities. The results are shown in the bottom panel of Fig. 4 and Table 2. The two classes show a more significant separation in accretion rate than in bolometric luminosity (probability of chance separation of 1.1% and 10.4%, respectively222A K-S test for the subsample of only Compton-thin sources cannot be performed, since the minimum number of data values for a statistical significance is 4 (Stephens 1970, pag. 120-121)). Both HBLR and non-HBLR Compton thick sources are included in the sample and the separation between the two different populations in accretion rate resembles the one inferred from our X-ray analysis, suggesting that the efforts to use standard
extinction correction for [Oiii] are not always reliable (e.g. Goulding & Alexander 2009; LaMassa et al. 2010).
5 Discussion
Since the seminal results by Miller and Antonucci (1983) on the archetypical Seyfert 2 galaxy, NGC1068, many efforts have been spent to understand whether the Unification Model is valid for all Seyfert galaxies, or the presence/absence of the BLR may be also linked to intrinsic properties of different classes of sources. Intrinsic differences were strongly advocated by Tran (2001) and Tran (2003), who found that HBLR Seyfert 2s are normally associated with typical obscured Seyfert 1 nuclei, while non-HBLR Seyfert 2 galaxies host, on average, significantly weaker muclei, likely incapable of generating classical BLRs.
This evidence supports theoretical models that link the presence or absence of BLRs in Seyferts, to intrinsic nuclear properties. In a model proposed by Nicastro (2000), the presence of broad emission lines is intrinsically connected with disk instabilities occuring in proximity of a transition radius at which the accretion disk changes from gas-pressure dominated to radiation-pressure dominated. The transition radius is function of the accretion rate, and becomes smaller than the innermost stable orbit for accretion rates (and therefore luminosities) lower than a threshold that depends weakly on the BH mass. Weak AGN should, therefore, lack the BLR.
In this work we try to test this model in the least biased observational way, by collecting the ’cleanest’ possible sample of Seyfert 2 galaxies with the best spectropolarimetric data available at the moment, and robust estimates of their BH masses performed homogeneously on the basis of the observed stellar velocity dispersion. When only Compton-thin sources are considered, the estimate on their accretion rate is done directly on the observed nuclear X-ray emission, and the modest absorption is likely not able to affect severely the detection of the hidden BLR, if present. We find that the separation between HBLR and non-HBLR Compton-thin sources is highly significant both in accretion rate and luminosity. In particular, no HBLR is found below the threshold Eddington rate , and no non-HBLR above the same limit. Even when Compton-thick sources are included, no HBLR is still found at accretion rates lower than the above threshold. This threshold accretion rate is in good agreement with the value presented in a recent work (Trump et al. 2011).
This result supports the theoretical expectations of the model proposed by Nicastro (2000), albeit with a slightly higher value of the threshold accretion rate ( in Nicastro (2000)). We stress here that the model proposed by Nicastro (2000) applies only to radiatively efficient AGNs, accreting through a Shakura-Sunyaev disk (SS-disk hereinafter, Shakura & Sunyaev 1973). Broad Emission lines are known to exist in some objects (mostly LINERs or transition objects, e.g. Elitzur and Ho 2009) accreting at rates as low as (e.g. M 81, Ho 2008). These objects are highly radiatevely inefficient, and therefore most likely do not host a classic SS-disk.
If BLRs do not exist in weakly accreting AGN, one would expect the existence of unabsorbed, genuine Seyfert 2 galaxies. Such objects do indeed exist, and the best examples (where the lack of optical broad lines and of X-ray obscuration are unambiguosly assessed in simultaneous high S/N observations) have Eddington rates lower than the threshold estimated in this paper: NGC 3147 (: Bianchi et al. 2008a), Q2131427 (: Panessa et al. 2009), NGC 3660 (: Bianchi et al., in preparation; Brightman and Nandra 2008).
It is interesting to note that among all the 156 X-ray unobscured ( cm-2) AGN observed with XMM-Newton (CAIXA: Bianchi et al. 2009), only 6 have an Eddington rate lower than the threshold found in this work333An updated catalogue was used for this search.. Four of these 6 sources were previously classified as unabsorbed Seyfert 2s (Panessa and Bassani 2002; Panessa et al. 2009; Brightman and Nandra 2008) but see also Shi et al. (e.g. 2010, and references therein), who recently claimed the presence of very broad and weak broad emission lines in two of these objects). The remaining two objects are PG 1011-040 and NGC 7213, and both show the presence of BLR in their optical spectra. Both objects are peculiar. PG 1011-040 is only slightly below the accretion rate threshold of that we find here and, most importanly, is severely under-luminous in X-rays with respect to its multiwavelength luminosity, so that the accretion rate derived from its 2-10 keV luminosity by simply applying the Marconi et al. (2004) correction, is likely severely under-estimated (Gallagher et al. 2001; Vasudevan and Fabian 2007). NGC 7213 is the only bright Seyfert 1 galaxy known to unambiguously lack reprocessing features from Compton-thick distant material (Bianchi et al. 2003, 2004; Lobban et al. 2010).
The inclusion of Compton-thick sources in our sample, makes the HBLR versus non-HBLR separation, in terms of either Eddington ratios or bolometric luminosities, less significant. Several non-HBLR Compton-thick sources lie now in the HBLR – plane, i.e. at accretion rate higher than the threshold we find for Compton-thin sources. This mixing could be, at least partially, due to the difficulties in assessing the intrinsic 2-10 keV luminosity of Compton-thick sources, because of the unknown geometry of the absorbers and reflectors 444The same uncertainties are probably also responsible for the lack of HBLR and non-HBLR separation when indirect estimators of the nuclear bolometric luminosity (e.g. ) are used.
However, such uncertainties should in principle affect equally over- and under-estimates of the luminosities. Instead, while no Compton-thick HBLR is still found below the Eddington rate threshold, a significant fraction (64%) of Compton-thick non-HBLR has accretion rates higher than this limit. Moreover, uncertainties in the exact geometry of absorbers and reflectors, could only be responsible for modest (factor of 2-3) over-estimates of the intrinsic bolometric luminosity and so of the Eddington accretion rate. This could perhaps explain the presence of few non-HBLR closely above the Eddington ratio threshold, but can hardly explain order-of-magnitude over-estimations of the bolometric luminosity, as inferred from the 2-10 keV spectra.
If the scenario proposed by Nicastro (2000) is correct, non-HBLR Compton-thick sources with Eddington accretion rate estimates much above the threshold, are likely to be peculiar objects, where BLR line emission cannot be seen, not even in polarized light. These source should possess a BLR, but something prevents us from observing it. Different, alternative scenarios, to the intrinsic lack of a BLR, have already been proposed in the past (Lumsden and Alexander 2001; Gu and Huang 2002; Martocchia and Matt 2002; Tran 2003; Moran 2007). This could be either because of the lack of an unobscured population of hot electrons scattering the line emission along our line of sight, or because the orientation of these sources is such that our line of sight intercept larger portions of absorbing gas, and this covers both the nuclear source and at least part of the line-reprocessing electron region (e.g. Shu et al. 2007; Wu et al. 2011, and references therein).
6 Conclusions
The main results of this paper can be summarized as follows:
-
•
we presented evidence suggesting that accretion rate is the main ingredient which drives the presence of HBLRs in Seyfert 2 galaxies. By selecting a sample of 39 type 2 AGN with good quality spectropolarimetric and X-ray data, and for which we derived homogenous estimates of the mass of the central supermassive BH, we found a clear separation between Compton-thin HBLR and non-HBLR sources, both in luminosity () and in accretion rate (). A statistically similar separation is seen when bolometric luminosities are derived from infrared [Oiv] emission lines.
Our results agree with the ones discussed in Nicastro et al. (2003) but have higher statistical significance (due to the larger sample we use here, compared to Nicastro et al. (2003)), and probably more robust due to the more accurate estimates of the BH masses that we derive here; -
•
the inclusion of Compton-thick sources, washes out the separation between HBLR and non-HBLR, but still no HBLR source falls below the Eddington ratio threshold. We propose that the presence of a significant fraction (64%) of Compton-thick non-HBLRs at accretion rates higher than the threshold found for Compton-thin sources, is not due to the lack of BLRs, but to heavy line-of-sight absorption preventing us from observing not only the direct line emission, but also their polarized light scattered off an, at least partly, obscured population of hot electrons.
References
- Anders and Grevesse (1989) E. Anders and N. Grevesse, Geochim. Cosmochim. Acta 53, 197 (1989).
- Antonucci and Miller (1985) R. R. J. Antonucci and J. S. Miller, ApJ 297, 621 (1985).
- Antonucci (1993) R. Antonucci, ARA&A 31, 473 (1993).
- Arnaud (1996) K. A. Arnaud, in ASP Conf. Ser. 101: Astronomical Data Analysis Software and Systems V (1996), p. 17.
- Barth et al. (2002) A. J. Barth, L. C. Ho, and W. L. W. Sargent, AJ 124, 2607 (2002), arXiv:astro-ph/0209564.
- Bassani et al. (1999) L. Bassani, M. Dadina, ApJS 121, 473 (1999)
- Baum et al. (2010) S. A. Baum, J. F. Gallimore, C. P. O’Dea, ApJ 710, 289 (2010)
- Bian and Gu (2007) W. Bian and Q. Gu, ApJ 657, 159 (2007), arXiv:astro-ph/0611199.
- Bianchi et al. (2003) S. Bianchi, G. Matt, I. Balestra, and G. C. Perola, A&A 407, L21 (2003).
- Bianchi et al. (2004) S. Bianchi, G. Matt, I. Balestra, M. Guainazzi, and G. C. Perola, A&A 422, 65 (2004).
- Bianchi et al. (2008a) S. Bianchi, A. Corral, F. Panessa, X. Barcons, G. Matt, L. Bassani, F. J. Carrera, and E. Jiménez-Bailón, MNRAS 385, 195 (2008a), 0710.4226.
- Bianchi et al. (2008b) S. Bianchi, F. La Franca, G. Matt, M. Guainazzi, E. Jimenez Bailón, A. L. Longinotti, F. Nicastro, and L. Pentericci, MNRAS 389, L52 (2008b), 0806.3876.
- Bianchi et al. (2009) S. Bianchi, M. Guainazzi, G. Matt, N. Fonseca Bonilla, and G. Ponti, A&A 495, 421 (2009), 0811.1126.
- Bianchi et al. (2010) S. Bianchi, M. Chiaberge, D. A. Evans, M. Guainazzi, R. D. Baldi, G. Matt, and E. Piconcelli, MNRAS pp. 418–+ (2010), 1002.0800.
- Brightman and Nandra (2008) M. Brightman and K. Nandra, MNRAS 390, 1241 (2008), 0808.2385.
- Czerny et al. (2004) B. Czerny, A. Rózańska, J. Kuraszkiewicz, A&A 428, 39 (2004)
- Diamond-Stanic et al. (2009) A. M. Diamond-Stanic, G. H. Rieke, J. R Rigby, ApJ 698, 623 (2009)
- Dickey and Lockman (1990) J. M. Dickey and F. J. Lockman, ARA&A 28, 215 (1990).
- Elitzur and Ho (2009) J. M. Elitzur and L. C. Ho, ApJ 701, L91 (2009).
- Elvis et al. (1994) M. Elvis, B. J. Wilkes, J. C. McDowell, R. F. Green, J. Bechtold, S. P. Willner, M. S. Oey, E. Polomski, and R. Cutri, ApJS 95, 1 (1994),
- Fruscione et al. (2006) A. Fruscione, J. C. McDowell, G. E. Allen, N. S. Brickhouse, D. J. Burke, J. E. Davis, N. Durham, M. Elvis, E. C. Galle, D. E. Harris, et al., in Observatory Operations: Strategies, Processes, and Systems. Edited by Silva, David R.; Doxsey, Rodger E.. Proceedings of the SPIE, Volume 6270, pp. 62701V (2006). (2006), vol. 6270 of Presented at the Society of Photo-Optical Instrumentation Engineers (SPIE) Conference.
- Gallagher et al. (2001) S. C. Gallagher, W. N. Brandt, A. Laor, M. Elvis, S. Mathur, B. J. Wills, and N. Iyomoto, ApJ 546, 795 (2001), arXiv:astro-ph/0007384.
- Gabriel et al. (2004) C. Gabriel, M. Denby, D. J. Fyfe, J. Hoar, A. Ibarra, E. Ojero, J. Osborne, R. D. Saxton, U. Lammers, and G. Vacanti, in Astronomical Data Analysis Software and Systems (ADASS) XIII, edited by F. Ochsenbein, M. G. Allen, & D. Egret (2004), vol. 314 of Astronomical Society of the Pacific Conference Series, pp. 759–+.
- Garcia-Rissmann et al. (2005) A. Garcia-Rissmann, L. R. Vega, N. V. Asari, R. Cid Fernandes, H. Schmitt, R. M. González Delgado, and T. Storchi-Bergmann, MNRAS 359, 765 (2005), arXiv:astro-ph/0502478.
- Goulding & Alexander (2009) A. D. Goulding and D. M. Alexander, MNRAS 398, 1165
- Goulding et al. (2010) A. D. Goulding, D. M. Alexander, B. D. Lehmer, and J. R. Mullaney, MNRAS 406, 597 (2010).
- Greene and Ho (2005) J. E. Greene and L. C. Ho, ApJ 627, 721 (2005), arXiv:astro-ph/0503675.
- Gu and Huang (2002) Q. Gu and J. Huang, ApJ 579, 205 (2002).
- Gültekin et al. (2009) K. Gültekin, D. O. Richstone, K. Gebhardt, ApJ 698, 198 (2009).
- Haas et al. (2005) M. Haas, R. Siebenmorgen, B. Schulz, A&A 442, L39 (2005).
- Ho (2008) L. C. Ho, ARA&A 46, 475 (2008)
- Huchra and Burg (1992) J. Huchra and R. Burg, ApJ 393, 90 (1992).
- Kraemer et al. (2011) S. B. Kraemer and H. R. Schmitt, et al., ApJ 727, 130 (2011).
- LaMassa et al. (2010) S. M. LaMassa and T. M. Heckman, et al., ApJ 720, 786 (2010).
- Lamastra et al. (2009) A. Lamastra, S. Bianchi, G. Matt, G. C. Perola, X. Barcons, and F. J. Carrera, A&A 504, 73 (2009), 0905.4439.
- Laor (2003) A. Laor, ApJ 590, 86 (2003)
- Lobban et al. (2010) A. P. Lobban, J. N. Reeves, D. Porquet, V. Braito, A. Markowitz, L. Miller, and T. J. Turner, MNRAS 408, 551 (2010), 1006.1318.
- Lumsden and Alexander (2001) S. L. Lumsden and D. M. Alexander, MNRAS 328, L32 (2001), arXiv:astro-ph/0110174.
- Magdziarz and Zdziarski (1995) P. Magdziarz and A. A. Zdziarski, MNRAS 273, 837 (1995).
- Marconi et al. (2004) A. Marconi, G. Risaliti, R. Gilli, L. K. Hunt, R. Maiolino, and M. Salvati, MNRAS 351, 169 (2004), astro-ph/0311619.
- Martocchia and Matt (2002) A. Martocchia and G. Matt, in Inflows, Outflows, and Reprocessing around Black Holes, edited by I. Cagnoni (2002), pp. 34–+, arXiv:astro-ph/0210332.
- Matt et al. (1999) G. Matt, F. Pompilio, 191 (1999), arXiv:astro-ph/9904341.
- McElroy (1995) D. B. McElroy, ApJS 100, 105 (1995).
- Meléndez et al. (2008) M. Melendez and S. B. Kraemer, ApJ 682, 94 (2008).
- Miller and Antonucci (1983) J. S. Miller and R. R. J. Antonucci, ApJ 271, L7 (1983).
- Moran et al. (2000) E. C. Moran, A. J. Barth, L. E. Kay, and A. Filippenko, ApJ 540, L73 (2000).
- Moran (2007) E. C. Moran, The Central Engine of Active Galactic Nuclei, 373, 425 (2007)
- Nelson and Whittle (1995) C. H. Nelson and M. Whittle, ApJS 99, 67 (1995).
- Nicastro (2000) F. Nicastro, ApJ 530, L65 (2000).
- Nicastro et al. (2003) F. Nicastro, A. Martocchia, and G. Matt, ApJ 589, L13 (2003).
- Oliva et al. (1999) E. Oliva, L. Origlia, R. Maiolino, and A. F. M. Moorwood, A&A 350, 9 (1999), arXiv:astro-ph/9908063.
- Panessa and Bassani (2002) F. Panessa and L. Bassani, A&A 394, 435 (2002).
- Panessa et al. (2006) F. Panessa, L. Bassani, M. Cappi, M. Dadina, X. Barcons, F. J. Carrera, L. C. Ho, and K. Iwasawa, A&A 455, 173 (2006), arXiv:astro-ph/0605236.
- Panessa et al. (2009) F. Panessa, F. J. Carrera, S. Bianchi, A. Corral, F. Gastaldello, X. Barcons, L. Bassani, G. Matt, and L. Monaco, MNRAS 398, 1951 (2009), 0906.1974.
- Pereira-Santaella et al. (2010) M. Pereira-Santaella, A. M. Diamond-Stanic, A. Alonso-Herrero, G. H. Rieke, ApJ 725, 2270 (2010).
- Piconcelli et al. (2004) E. Piconcelli, E. Jimenez-Bailón, M. Guainazzi, N. Schartel, P. M. Rodríguez-Pascual, and M. Santos-Lleó, MNRAS 351, 161 (2004).
- Rigby et al. (2009) J. R. Rigby, A. M. Diamond-Stanic, and G. Aniano, ApJ 700, 1878 (2009)
- Risaliti et al. (2011) G. Risaliti, M. Salvati, and A. Marconi, MNRAS 411, 2223 (2011), 1010.2037.
- Rush et al. (1993) B. Rush, M. A. Malkan, and L. Spinoglio, ApJS 89, 1 (1993), arXiv:astro-ph/9306013.
- Shakura & Sunyaev (1973) N. I. Shakura, and R. A. Sunyaev, A&A 24, 337 (1973).
- Shaw et al. (1993) M. Shaw, A. Wilkinson, and D. Carter, A&A 268, 511 (1993).
- Shi et al. (2010) Y. Shi, G. H. Rieke, P. Smith, J. Rigby, D. Hines, J. Donley, G. Schmidt, and A. M. Diamond-Stanic, ApJ 714, 115 (2010), 1004.2077.
- Shu et al. (2007) X. W. Shu, J. X. Wang, P. Jiang, L. L. Fan, and T. G. Wang, ApJ 657, 167 (2007), arXiv:astro-ph/0603338.
- Stephens (1970) M. A. Stephens, Journal of the Royal Statistical Society. Series B (Methodological) 32, 115 (1970), http://links.jstor.org/sici?sici=0035-9246%281970%2932%3A1%3C115%3AUOTKCM%3E2.0.CO%3B2-9.
- Strüder et al. (2001) L. Strüder, U. Briel, K. Dennerl, R. Hartmann, E. Kendziorra, N. Meidinger, E. Pfeffermann, C. Reppin, B. Aschenbach, W. Bornemann, et al., A&A 365, L18 (2001).
- Terlevich et al. (1990) E. Terlevich, A. I. Diaz, and R. Terlevich, MNRAS 242, 271 (1990).
- Tran et al. (1992) H. D. Tran, J. S. Miller, and L. E. Kay, ApJ 397, 452 (1992).
- Tran (1995) H. D. Tran, ApJ 440, 565 (1995).
- Tran (2001) H. D. Tran, ApJ 554, L19 (2001).
- Tran (2003) H. D. Tran, ApJ 583, 632 (2003).
- Tremaine et al. (2002) S. Tremaine, K. Gebhardt, R. Bender, G. Bower, A. Dressler, S. M. Faber, A. V. Filippenko, R. Green, C. Grillmair, L. C. Ho, et al., ApJ 574, 740 (2002).
- Trouille and Barger (2010) L. Trouille and A. J. Barger, ApJ 722, 212 (2010)
- Trump et al. (2011) J. R. Trump, C. D. Impey, et al., ApJ 733, 60 (2011)
- Vasudevan and Fabian (2007) R. V. Vasudevan and A. C. Fabian, MNRAS 381, 1235 (2007), 0708.4308.
- Vasudevan and Fabian (2009) R. V. Vasudevan and A. C. Fabian, MNRAS 392, 1124 (2009), 0810.3777.
- Weaver et al. (2010) K. A. Weaver, M. Meléndez, R. F. Mushotzky, ApJ 716, 1151 (2010).
- Wu et al. (2011) Y. Wu, E. Zhang, Y. Liang, C. Zhang, and Y. Zhao, ApJ 730, 121 (2011).
- Young et al. (1996) S. Young, J. H. Hough, A. Efstathiou, B. J. Wills, J. A. Bailey, M. J. Ward, and D. J. Axon, MNRAS 281, 1206 (1996).
- Young et al. (2010) M. Young, M. Elvis, and G. Risaliti, ApJ 708, 1388 (2010), 0911.0474.