Unabsorbed Seyfert 2 galaxies: the case of “naked” AGN††thanks: Based on observations obtained with XMM-Newton and at ESO NTT telescope (La Silla, Chile, program: 278.B-5021).
Abstract
Hawkins (2004) reported on a class of “naked” AGN characterized by strong amplitude optical brightness variability and the complete absence of broad emission lines in the optical spectrum. The variability suggests that the nucleus is seen directly, however the absence of broad lines contradicts the simple formulation of Unified Models for AGN. We present the results of quasi-simultaneous spectroscopic observations with XMM-Newton and NTT (La Silla) of two “naked” AGN. We confirm the “naked” nature of Q 2131-427 for which no broad emission line components have been detected in the optical spectrum and its X-ray spectrum shows no signs of intrinsic absorption. The optical and X-ray mismatch in this source cannot be ascribed to a high nuclear dust-to-gas ratio and a Compton Thick nature is ruled out on the basis of the high FX/F ratio. The Broad Line Region (BLR) may be completely absent in this source, possibly as a consequence of its low Eddington ratio. On the other hand, the optical spectrum of Q 2130-431 shows Hα and Hβ broad emission line components, revealing the presence of a BLR. A mild X-ray absorption is expected in intermediate type 1.8 Seyfert galaxies like Q 2130-431, however we put a very low upper limit on the column density ( 2 cm-2), also the low Balmer decrement suggests that the BLR itself does not suffer from reddening. We propose that in this object the BLR is intrinsically weak, making a case of “true” intermediate Seyfert galaxy. We also report on the X-ray detection of the Abell 3783 galaxy cluster in the XMM-Newton field-of-view of the Q 2131-427 observation.
keywords:
galaxies: active - galaxies: Seyfert - X-rays: galaxies - galaxies: clusters: general1 Introduction
The Unified Model for Seyfert galaxies predicts that the differences observed between type 1 and type 2 Seyfert galaxies are primarily due to orientation effects (Antonucci 1993). Optical narrow emission lines present in both type 1 and type 2 Seyfert’s spectra are produced in the Narrow Line Region (NLR) at pc scale from the nucleus. Optical broad emission lines originate in the Broad Line Region (BLR) at sub-pc scale. The latter are observed only in type 1 Seyfert’s spectra since, in type 2 Seyferts, they are obscured by a molecular torus. Much evidence has been found in favor of this picture, such as the larger amount of absorbing material measured from X-ray observations in Seyfert 2s with respect to Seyfert 1s (Risaliti et al. 1999, Awaki et al. 1991).
However, in the last few years the number of cases in which observations do not match with Unified Models is increasing both in the local and in the distant universe. Type 1 Active Galactic Nuclei (AGN) with significant absorption have been found (Cappi et al. 2006, Mateos et al. 2005, Fiore et al. 2001) as well as type 2 AGN without X-ray absorption (Brightman & Nandra 2008, Bianchi et al. 2008, Wolter at al. 2005, Corral et al. 2005, Caccianiga et al. 2004, Barcons, Carrera & Ceballos 2003, Panessa & Bassani 2002, Pappa et al. 2001).
| Name | RA | DEC | z | [Oiii]/Hβ | B | Obs. Date | Exposure (s) | Filters |
|---|---|---|---|---|---|---|---|---|
| M1/M2/PN | M1/M2/PN | M1/M2/PN | ||||||
| (1) | (2) | (3) | (4) | (5) | (6) | (7) | (8) | (9) |
| Q 2130-431 | 21 33 15.62 | -42 54 24 | 0.266 | 16.36 | 1.20 | 2006-11-13 | 29997/29774/24431 | M/M/M |
| Q 2131-427 | 21 34 26.49 | -42 29 56 | 0.365 | 7.43 | 1.18 | 2006-11-15 | 23698/23429/16140 | M/M/M |
Notes: Col (1): Galaxy name; col (2)-(3) Optical position in epoch J2000; col. (4) Redshift; col. (5) [Oiii]/Hβ ratio; col. (6): Amplitude of the band measured over the period from 1974 to 2002; col. (7): Observation date; col. (8): MOS1/MOS2/PN observation exposures; col. (9): MOS1/MOS2/PN filters, M=medium. Columns (1), (4)-(6) are from Hawkins (2004).
Several explanations have been proposed to reconcile the Unified Model paradigm with these pieces of evidence. For instance, the broad emission lines could fade away in response to a decrease of the continuum emission (Guainazzi et al. 2005, Matt et al. 2003). Alternatively, the BLR is covered by clumpy and variable obscuring material, as in NGC 4388 where a variation of a factor of 100 in column density has been observed from X-ray observations (Elvis et al. 2004) and in NGC 1365 where a spectral change from Compton-thin to Compton-thick and back to Compton-thin has happened in four days (Risaliti et al. 2007). In the above mentioned cases, the misleading X-ray and optical behavior is basically due to non-simultaneity of the observations. Finally, the BLR could be weak or absent and its formation linked to the accretion physics (Wang & Zhang 2007, Elitzur & Shlosman 2006, Nicastro et al. 2003, Nicastro 2000, Williams et al. 1999). Simultaneous optical and X-rays observations have confirmed that NGC 3147 is BLR-free and without X-ray absorption (Bianchi et al. 2008). The strategy of observing the source simultaneously in the two bands has been proved to be fundamental in order to avoid mismatches due to spectral or flux variability of the source at X-rays and optical wavebands.
Hawkins (2004) presented the results from a long term monitoring of about 800 quasars. Among them a new class of AGN is reported, i.e. the “naked” AGN, where the absence of broad emission lines is accompanied by strong optical variability, suggesting that the nucleus is seen directly. Subsequently Chandra snapshot observations of three “naked” AGN (Q 2130-431, Q 2131-427 and Q 2122-444) by Gliozzi et al. (2007) confirmed this hypothesis given the absence of significant absorption in the X-ray spectra, though of low statistics. In this work we present quasi-simultaneous X-ray and optical spectroscopic observations with XMM-Newton and EMMI/NTT (La Silla Observatory, LSO, ESO) of two sources (Q 2130-431 and Q 2131-427) out of the six “naked” AGN sample defined in Hawkins (2004) and discuss their nature with respect to Unified Models and recent developments. We also report on the serendipitous detection of the cluster Abell 3783 in Appendix A. In the following, we adopt km s-1 Mpc-1, and (Spergel et al. 2003).
2 The sample of “naked” AGN
Hawkins (2004) carried out a yearly photometrical large-scale monitoring programme for AGN over the last 25 years. The survey was based on a long series of photographic plates from the UK 1.2m Schmidt telescope. Candidate AGN were selected from a catalogue of 200,000 objects to perform follow-up spectroscopic study. Optical spectra (obtained in July 2002) pinpoint a class of objects (6 in that sample) which show narrow and weak Hβ emission line, large [Oiii]5007/Hβ ratios typical of type 2 Seyferts (i.e., [Oiii]5007/Hβ 3, Shuder & Osterbrock 1981), and no sign of broad emission lines111Note, however, that the broadness of other emission lines as, for instance, Hα, could not be determined since this line was redshifted out of the optical passband.. For this class of objects, the difference between the maximum and minimum light in magnitudes in the BJ passband over a period of 25 years, B, reveals large amplitude variations normally only found in type 1 objects. Their brightness varied at least by a factor of 3 on a timescale of 5-10 years and also on shorter time scales (see light curves in Hawkins 2004). Two among the brightest sources of the six “naked” AGN sample have been observed in this work (Q 2130-431 and Q 2131-427). In particular, Hawkins (2004) reported also on a previous optical observation of Q 2131-427, in 1991 with EFOSC on the 3.6m at ESO, when the source was 0.7 magnitudes brighter than in 2002. Its optical spectrum showed no sign of broad emission lines and weak Hβ, basically consistent with the spectrum observed afterward in 2002, apart from some additional flux at the blue end of the continuum. In Table 1 we report the two observed “naked” AGN, where redshift, [Oiii]5007/Hβ and B are taken from Hawkins (2004).
3 Data reduction and analysis
3.1 Optical data
| Q 2130-431 | Q 2131-427 | |||
|---|---|---|---|---|
| Line | Flux ( cgs) | FWHM (km s-1) | Flux ( cgs) | FWHM (km s-1) |
| Hβ (narrow) | 0.11 | 320 (426) | 0.13 | 590 (830) |
| Hβ (broad) | 1.17 | 9680 | 0.06 | 4000∗ |
| 0.40 | 370 | 0.40 | 970 | |
| 1.19 | 370 (410) | 1.21 | 970 (960) | |
| Hα (narrow) | 0.39 | 320 | 0.54 | 590 |
| Hα (broad) | 4.01 | 9680 | 0.25 | 4000∗ |
| 0.22 | 440 | 0.24 | 890 | |
| 0.66 | 440 | 0.72 | 890 | |
| 0.10 | 320 | - | - | |
| 0.10 | 320 | - | - | |
Notes: Line widths for [Oiii], [Nii], [Sii] doublets and Balmer line components (narrow and broad respectively) were fitted by tying down the velocity widths to the same value. Parameters with ∗ were kept fixed to the reported value during the fitting procedure. FWHM in km s-1 obtained from Hawkins (2004) after correction for the spectral resolution of 520 km s-1 (see Hawkins (2004), sec 2.2).
Q 2130-431 and Q 2131-427 were observed at the NTT telescope in La Silla (Chile) in director discretionary time (ID: 278.B-5021) to obtain a quasi-simultaneous observation with the XMM-Newton ones. Observations for both sources have been performed on 2006, December 20th with the ESO Multi-Mode Instrument (EMMI) with grating #4 and a 1-arcsec slit width. The condition of the night was good (i.e., clear to photometric). The exposure for each spectrum was of 1200s (air mass 1.70 for Q 2130-431 and 1.92 for Q 2131-427). The wavelength resolution measured from unblended arc lines was 3 Å, in the range 6000-9000 Å. A standard reduction process was applied using midas and iraf tasks. The raw data were bias subtracted and corrected for pixel-to-pixel variations (flat-field). Object spectra were extracted and sky subtracted. Wavelength calibrations were carried out by comparison with exposures of He and Ar lamps, with an accuracy 1 Å. Relative flux calibration was carried out by observations of the spectrophotometric standard star SA95_42 (Oke 1990). We estimate an error on the flux calibration 10% from the standard adjustment during the calibration procedure. Statistical errors were propagated throughout the data reduction process.
The spectral fitting was carried out using the QDP fitting routines via minimisation. The spectrum has been fitted with a linear component in order to reproduce the continuum which is always almost flat. The line intensities and widths were measured by fitting Gaussian profiles and the Full Width Half Maximum (FWHM) calculated taking into account the spectrograph resolution. The NLR is stratified as it is the BLR, but emission lines coming from the same region (like the doublets and the Balmer lines) should display similar widths. For this reason, velocity widths for narrow lines were tied together to the same value for each doublet as well as for the narrow components (and broad, if any) of the Balmer lines. The results from the spectral fitting of the two objects are shown in Table 2 and the optical fitted spectra are shown in Figures 1 and 2.
In the case of Q 2130-431 a broad component with a FWHM 9700 km s-1 is clearly detected in the Hα and Hβ emission lines. According to the Whittle (1992) classification criteria for intermediate type Seyfert galaxies (based on the F/FHβ(broad) ratio), Q 2130-431 should be classified as Seyfert 1.5. However, F/FHβ(broad) = 1.0 is close to the boundary between the Seyfert 1.5 and Seyfert 1.8 classification; since the Seyfert 1.5 classification is mainly used for sources with highly variable spectra, we adopt a Seyfert 1.8 classification for Q 2130-431.
Conversely, no broad components (Hα nor Hβ) are significantly detected in the spectra of Q 2131-427. We compute an upper limit on the Hα and Hβ broad emission line components by fixing the line widths to 4000 km s-1, a conservative value for BLR widths (Ho et al. 1997). We are confident that in this source the lack of detection of broad line components is not due to the host galaxy contamination. Indeed, our spectra are quite flat and do not show any significant contribution from the host galaxy. Since the data are taken in long-slit mode, we are able to extract only the most central part of the source, thus avoiding as much as possible the host galaxy contribution.
We calculate the fractional contribution of the Hα broad component to the total (broadnarrow) Hα emission by using the estimated upper limit. This corresponds to at most 30 per cent, a low value if compared to the average value in the Ho et al. (1997) Seyfert sample which is around 65 per cent. Note that the latter is a conservative estimate since the average FWHM for broad line components in Ho et al. (1997) is around 2700 km s-1 while our upper limit has been calculated for a FWHM of 4000 km s-1.
In the classical [Oiii]/Hβ vs. [NII]/Hα diagnostic diagram plot used to classify narrow emission line galaxies (Kewley et al. 2006), both sources are placed in the Seyfert region, well above the LINER-Starburst limits. In conclusion, the optical classification for Q 2130-431 and Q 2131-427 is Seyfert 1.8 and Seyfert 2, respectively.
It is interesting to compare our spectral results with those obtained from Hawkins (2004) and here reported within parenthesis in Table 2. The [Oiii] and Hβ FHWM measured for Q 2130-431 are consistent with the ones reported in Hawkins (2004), after spectral resolution correction, while our measured [Oiii]/Hβ ratio of 11 is smaller compared to 16 (see Table 1). In the optical spectrum of Q 2131-427 the major difference results in the Hβ FWHM significantly smaller than the one measured by Hawkins (2004) ( 830 km s-1). On the other hand, the [Oiii]/Hβ ratio 9 and the [Oiii] width are consistent within errors. We note that, this comparison exercise should be taken with caution, since the quality of the spectroscopy observations in Hawkins (2004), performed with 2dF multi-fibre spectrograph, cannot provide accurate error estimates for the FWHM and could also be problematic when calculating line ratios, given the unreliability of sky subtraction and flux calibration.


| Name | MBH | LBol/LEdd | ||||||||
|---|---|---|---|---|---|---|---|---|---|---|
| (cgs) | (cgs) | (cgs) | (cgs) | |||||||
| (1) | (2) | (3) | (4) | (5) | (6) | (7) | (8) | (9) | (10) | (11) |
| Q 2130-431 | 2.4 | 2.0 | 1.77 | 149.8/144 | 7.910-14 | 1.510-13 | 2.01043 | 3.81043 | 1.6107 | 0.37 |
| Q 2131-427 | 2.2 | 9.0 | 2.00 | 27.3/23 | 1.810-14 | 2.210-14 | 1.01043 | 1.21043 | 7.7108 | 2.410-3 |
Notes: Col. (1): Name of the source; col. (2): Galactic column density in units of (cm; col. (3): Intrinsic column density in units of (cm; col. (4) Photon index; col. (5) Chi-squared and degrees of freedom; col. (6): Intrinsic flux in the 0.5–2 keV band; col. (7): Intrinsic flux in the 2–10 keV band; col. (8): Intrinsic luminosity in the 0.5–2 keV band; col. (9): Intrinsic luminosity in the 2–10 keV band; col. (10): black hole mass; col. (11): Ratio of bolometric to Eddington luminosity.
3.2 XMM-Newton Observations
Q 2130-431 and Q 2131-427 were observed by XMM-Newton on November 2006 (obsid: 0402460201). Data have been processed starting from the observation data fits files with SAS 7.0.0. X-ray events corresponding to patterns 0-12 and 0-4 were selected from the EPIC-MOS and EPIC-pn cameras, respectively. We used the most updated calibration files available at the time of the reduction for each source data. Source light curves and spectra were extracted from circular regions of 25′′ centered on the source, while background products were obtained from off-set regions close to the source. Exposure times have been filtered out for periods of high background and the “good time interval” exposures are reported in Table 1 as well as the observation date and the instruments filters. Spectra were binned according to the counts collected in each source. The ancillary and detector response matrices were generated using the XMM-Newton SAS arfgen and rmfgen tasks. The X-ray light-curves have been examined and no significant variability has been found.
The pn, MOS1 and MOS2 spectra were analyzed using XSPEC v.12.4.0. Galactic absorption is implicitly included in all spectral models. Abundances are those of Anders & Grevesse (1989). The errors, lower and upper limits quoted correspond to 90% confidence range for one interesting parameter (i.e., ; Avni 1976), unless otherwise stated.
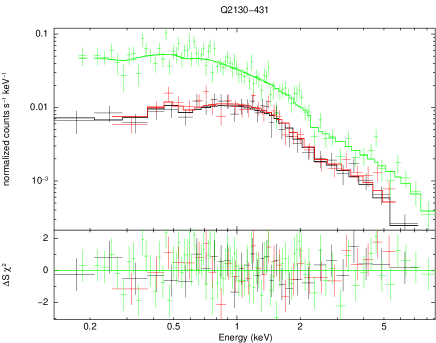
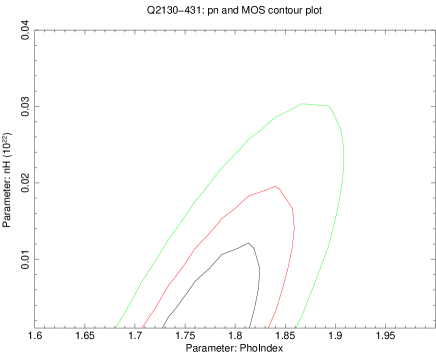
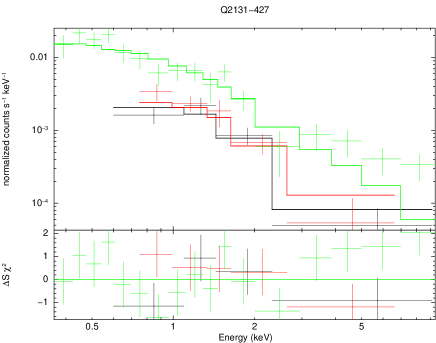
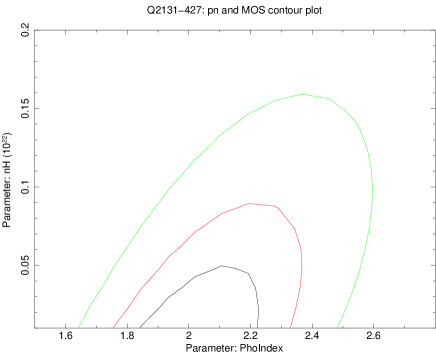
The X-ray spectrum of Q 2130-431 is well represented by a single power-law with photon spectral index ( = 150/144). No extra absorption apart from the Galactic one is needed ( 2 cm-2). Q 2131-427 shows a very weak spectrum, modeled by a single power-law ( 2) and an upper limit (at 90% confidence level) on the intrinsic absorption of 9 cm-2. We fixed a narrow Gaussian emission line at the rest energy of the FeKα line, 6.4 keV, and we measured an upper limit on the equivalent width of the line of 2 keV. However, this large value is probably due to the significant residuals visible above 5 keV in the pn spectrum; actually the very low photon statistics around 6-7 keV and the background dominance in this range prevent us from drawing any strong conclusions based on this limit. In Figures 3 and 4 best fit spectra are shown on the left panels, while column density versus photon index contour plots are on the right panels. In Table 3 we show the best–fit parameters together with the model fluxes and luminosities in the 0.5-2 keV and 2-10 keV bands. We also report the black hole mass derived from the relation (Tremaine et al. 2002), where is the stellar velocity dispersion obtained from the FWHM([Oiii]) as shown in Greene & Ho (2005). The Eddington ratio has been calculated assuming that 20 (Elvis et al. 1994, Vasudevan & Fabian 2009).
4 Discussion
The “naked” AGN as discovered by Hawkins (2004) are among the best candidates to look for “true” unabsorbed Seyfert 2 galaxies (Panessa & Bassani 2002). Indeed, the monitored optical variability over 25 years points to a nucleus seen directly where, given the absence of broad optical emission lines in the optical spectra, the BLR may lack. As successfully proven for NGC 3147 (Bianchi et al. 2008), the key strategy to spot this class of AGN is through simultaneous optical and X-ray observations in order to rule out variability as the cause of the optical and X-ray mismatch. We have therefore observed two “naked” AGN candidates, Q 2130-431 and Q 2131-427, simultaneously in the X-ray and optical band.
4.1 Q 2131-427: a “true” unabsorbed Seyfert 2 galaxy
For Q 2131-427, the photometric measurements obtained over 25 years, as reported in Hawkins (2004), show a slow decrease of the emission, from B 20 mag in 1974 to B 21 mag in 2002. The Optical Monitor on board XMM-Newton (Mason et al. 2001) measured B = 20.83 0.10, only slightly above the last measurement in the BJ light curve (in 2001) BJ = 21.2 0.3, confirming that the source is still in a low flux state. Interestingly, Q 2131-427 shows no signs of broad emission line components in its optical spectrum and the faint X-ray spectrum of this source is unabsorbed, with an upper limit on the intrinsic column density of 9 cm-2, consistent with that from a host galaxy. This picture is hard to reconcile within the Unified Model predictions, where the BLR is obscured by a toroidal absorbing medium of dust and gas, the former responsible of the optical extinction of the broad emission lines and the latter measurable in X-rays.
One possibility is that the BLR is hidden behind a Compton thick medium whose column density cannot be measured in X-ray spectra below 10 keV (Matt et al. 1999). The upper limit on the EW of the FeKα line at 6.4 keV does not rule out the Compton thick hypothesis, however this measurement is not reliable, given the low statistics spectrum above 5 keV. Instead, the F2-10keV/F ratio222F has been reddening corrected (Bassani et al. 1999). of 6 is typical of Compton thin sources.
Tran (2001) studied the properties of type 2 Seyfert galaxies with polarized (hidden) broad-line regions (HBLR) seen in reflected light compared to the non-HBLR Seyfert 2 galaxies, introducing the use of a diagnostic diagram involving [Oiii]5007/Hβ. The median values of [Oiii]5007/Hβ found are 6.8 1.5 and 9.9 1.3 for the non-HBLR and HBLR Seyfert 2 galaxies respectively. The [Oiii]5007/Hβ ratio of Q 2131-427 is 9, suggesting that this source might harbor a hidden BLR. In this hypothesis, some sort of dusty medium should obscure the optical broad emission lines and be gas-free.
As already invoked for the unabsorbed Seyfert 2 in Panessa & Bassani (2002), a dust-to-gas ratio 10-50 times higher than Galactic would be enough to obscure the BLR. However, this is an unlikely scenario as a dust obscuration is often observed to be lower than the associated gas column density (see Maiolino et al. 2001). Moreover, the Balmer decrement of the NLR, i.e. (Hα/Hβ)NLR 4.2, suggests that the environment is not particularly dusty (Ward et al. 1987) and the optical extinction AV 1.3 mag derived from the Balmer decrement is still too small to be able to completely obscure a standard BLR.
The hypothesis of a pc and/or sub-pc scale clumpy obscuring medium which results in a variable column density in X-ray spectra (Risaliti et al. 2002, Elvis et al. 2004, Risaliti et al. 2005, Bianchi et al. 2009) cannot help to explain the complete absence of broad components in the optical spectrum. Under the assumption that the X-ray absorption originates from the BLR clouds (see Risaliti et al. 2009), we should expect variable column density in the X-ray spectra but still broad emission lines in the optical spectrum, indeed at these spatial scales the gas should be dust-free being within the sublimation radius.
The most likely explanation for the observed optical/X-ray discrepancy is to assume that in this source the BLR does not exist or its emission is gradually declining. Indeed, the well documented optical flux decrease may favor the hypothesis that the BLR fade away in response to a decrease of the continuum emission. Recent models propose a dependence of the BLR properties with luminosity and/or accretion rate (Wang & Zhang 2007, Elitzur & Shlosman 2006, Nicastro et al. 2003, Nicastro 2000, Williams et al. 1999). According to Elitzur & Shlosman (2006), the classical molecular torus is just the outer part of a clumpy wind that comes out off the accretion disk. At bolometric luminosities lower than ergs sec-1, the mass accretion can no longer sustain the cloud outflow rate causing the disappearance of the torus and, at lower luminosities, of the broad line clouds too. According to the above scheme, the absence of a BLR in Q 2131-427 is not justified given the high bolometric luminosity (LBol 8 1044 ergs sec-1); however the low Eddington ratio measured (LBol/LEdd = 0.0024) may favor the scenario in which the BLR is formed in a vertical disk wind originating at a critical distance in the accretion disk, at accretion rates higher than a minimum value (, Nicastro 2000). According to this model, below the critical accretion rate the BLR cannot be formed. In the case of Q 2131-427, this is one of the best hypothesis to interpret the observational mismatch, taking into account that the Eddington ratio is around this critical value and it is probably affected by uncertainties related to the determination of the black hole mass and of the bolometric correction. If the BLR properties actually depend on the luminosity and/or accretion physics, this must have strong implications for AGN Unification Models and also for population studies of obscured and unobscured AGN samples (e.g. fraction of type 2 objects versus luminosity) as discussed in Elitzur & Shlosman (2006) (see also Wang & Zhang (2007) for an evolutionary sequence of Seyfert galaxies).
4.2 Q 2130-431: a “true” intermediate Seyfert galaxy?
The Q 2130-431 optical spectrum shown here reveals that this source is a type 1.8 Seyfert galaxy, i.e. we detect Hα and Hβ broad line components (see Figure 1). The Hα broad component was not detected by Hawkins (2004) since, at the redshift of the source, the line is shifted out of their optical spectra. Also the Hβ broad component was not detected, maybe because it is difficult to identify given its width, being hidden under a galaxy continuum (see Figure 6 in Hawkins 2004). Alternatively, it may be variable. Note that the FWHM of the Hβ narrow line component has not varied significantly between 2002 ( 426 km s-1) and 2006 (320 km s-1) observations.
The simultaneous ultraviolet imaging with the Optical Monitor, allows us to detect the source in the UVW1 filter (245-320 nm), with a Galactic reddening corrected magnitude of , slightly brighter when compared to the last measurement of mag, as shown in the 25 years light curve (see Fig. 8, Hawkins 2004). In X-rays, the 2-10 keV luminosity of 4 1043 ergs s-1 suggests that this is a typical type 1 Seyfert galaxy with a standard photon index ( = 1.8-2; e.g., Piconcelli et al. 2005) and no intrinsic absorption ( 2 cm-2, at 90% confidence level). The F2-10keV/F ratio is 77, well within the regime of Compton thin objects (Cappi et al. 2006, Bassani et al. 1999). Our X-ray flux is in agreement with the Chandra one found by Gliozzi et al. (2007) suggesting no particular variability in X-rays.
According to the above observational evidence, Q 2130-431 should not be considered as a pure “naked” AGN, in the sense that it displays optical broad emission line components and, therefore, it has a BLR. However, intermediate type Seyfert galaxies are characterized by large Balmer decrements consistent with reddening of the BLR and determining the 1.8/1.9 spectroscopic type (Osterbrock 1981). The weakness of the broad Balmer lines is often ascribed to dust absorption (Maiolino & Rieke 1995) and, indeed, moderate absorption is observed in X-rays (Risaliti et al. 1999). In Q 2130-431, the optical BLR Balmer decrement of 3.4 (almost the same value of the NLR Balmer decrement) suggests that the BLR does not suffer from heavy reddening. In addition, in the X-ray spectrum, no absorption has been measured, strengthening the idea that the BLR is not obscured and that the weakness of the broad optical lines can be intrinsic, e.g. due to a small amount of gas in the clouds. A weak BLR can be due to a luminosity/accretion rate related disappearance, as suggested for Q 2131-427. Interestingly the existence of this kind of objects should be hypothesized within an evolutionary sequence, as the one drawn in Elitzur & Shlosman (2006), from type 1 objects to “true” type 2s. However, the high X-ray luminosity and the Eddington ratio (LBol/LEdd 0.37) disfavor the latter hypothesis. Alternatively, the lack of a prominent BLR in Q 2130-431 may simply be a peculiar intrinsic property of this object. In both scenarios, Q 2130-431 can represent a case of “true” intermediate Seyfert galaxy, in which the BLR is intrinsically weak instead of being obscured by dust or gas.
5 Conclusions
We have obtained quasi-simultaneous X-ray (XMM-Newton) and optical (NTT-EMMI) spectra of two Seyfert galaxies, Q 2130-431 and Q 2131-427, belonging to the class of “naked” AGN characterized by Hawkins (2004) and, currently, composed of six members. The strong optical brightness variability and the lack of broad emission line components in their spectra have suggested that in these AGN the nucleus is seen directly and it is taken off its BLR. Our quasi-simultaneous observations have proven fundamental to confirm the “naked” hypothesis in the case of Q 2131-427, for which we have ruled out the Compton thick nature based on the low F2-10keV/F ratio. Moreover the Balmer decrement in the NLR excludes a high dust-to-gas ratio as a possible explanation of the broad emission lines absence. Instead, the present observations have confirmed that no broad components are found associated to the optical spectrum emission lines and simultaneously no absorption is measured in the X-ray spectrum. Either a dusty medium is absorbing the BLR being adequately gas free to let the X-ray continuum escape, however this is an unlikely scenario, or the source is accreting below a critical accretion rate such that the BLR cannot be formed (Nicastro 2000).
The “naked” hypothesis is instead discarded for Q 2130-431, which indeed displays Hα and Hβ broad line components in its optical spectrum. However, no sign of mild absorption in its X-ray continuum is found, contrary to what expected for intermediate Seyfert galaxies (in order to justify the partial obscuration of the BLR), neither the BLR itself seems to suffer from heavy reddening. The presence of a small amount of gas to photoionize can be the reason for the intermediate optical spectrum, making it a case of a potential “true” intermediate Seyfert galaxy.
At last, in the appendix, we present the results on the cluster Abell 3783 serendipitously detected in the Q 2131-427 EPIC FOV providing a description of its fundamental parameters.
Acknowledgments
We thank the anonymous referee for the useful comments. F.P. acknowledges support by ASI-INAF I/08/07/0 grants. FJC and XB acknowledge support by the Spanish Ministry of Science and Innovation, under grants ESP2006-13608-C02-01. This work benefited from an Italian-Spanish Integrated Action (HI 2006-0079). F.P. thanks M.T. Ceballos for the technical support. P.J. Humphrey is thanked for the use of his surface brightness fitting code. This research has made use of data obtained from the High Energy Astrophysics Science Archive Research Center (HEASARC), provided by NASA’s Goddard Space Flight Center. This research has also made use of the NASA/IPAC Extragalactic Database (NED) which is operated by the Jet Propulsion Laboratory, California Institute of Technology, under contract with NASA.
References
- Allen & Fabian (1998) Allen S. W., Fabian A. C., 1998, A&A, 297, L57
- Antonucci (1993) Antonucci R., 1993, ARA&A, 31, 473
- Arnaud (1996) Arnaud K. A., 1996, in ASP Conf. Ser. 101: Astronomical Data Analysis Software and Systems V, Vol. 5, 17
- Awaki et al. (1991) Awaki H., Koyama K., Inoue H., Halpern J. P., 1991, PASJ, 43, 195
- (5) Bassani L., Dadina M., Maiolino R., Salvati M., Risaliti G., della Ceca R., Matt G., Zamorani G., 1999, ApJS, 121, 473
- Barcons et al. (2003) Barcons X., Carrera F. J., Ceballos M. T., 2003, MNRAS, 339, 757
- Bartelmann & Steinmetz (1996) Bartelmann M., Steinmetz M., 1996, MNRAS, 283, 431
- Bianchi et al. (2009) Bianchi, S., Piconcelli, E., Chiaberge, M., Bailón, E. J., Matt, G., & Fiore, F. 2009, ApJ, 695, 781
- (9) Bianchi S., Corral A., Panessa F., Barcons X., Matt G., Bassani L., Carrera F. J., Jiménez-Bailón E., 2008, MNRAS, 385, 195
- Bianchi et al. (2007) Bianchi S., Guainazzi M., Matt G., Fonseca Bonilla N., 2007, A&A, 467, L19
- Bianchi & Matt (2002) Bianchi S., Matt G., 2002, A&A, 387, 76
- Bianchi et al. (2005) Bianchi S., Matt G., Nicastro F., Porquet D., Dubau J., 2005, MNRAS, 357, 599
- (13) Brightman M., Nandra K., 2008, MNRAS, 390, 1241
- Bryan & Norman (1998) Bryan G. L., Norman M. L., 1998, ApJ, 495, 80
- (15) Caccianiga A., et al., 2004, A&A, 416, 901
- (16) Cappi M., et al., 2006, A&A, 446, 459
- Cavaliere & Fusco-Femiano (1976) Cavaliere A., Fusco-Femiano R., 1976, A&A, 49, 137
- Corral et al. (2005) Corral A., Barcons X., Carrera F. J., Ceballos M. T., Mateos S., 2005, A&A, 431, 97
- De Grandi & Molendi (2001) De Grandi S., Molendi S., 2001, ApJ, 551, 153
- Dickey & Lockman (1990) Dickey J. M., Lockman F. J., 1990, ARA&A, 28, 215
- Dong & De Robertis (2006) Dong X. Y., De Robertis M. M., 2006, AJ, 131, 1236
- Elitzur & Shlosman (2006) Elitzur M., Shlosman I., 2006, ApJ, 648, L101
- Elvis et al. (2004) Elvis M., Risaliti G., Nicastro F., Miller J. M., Fiore F., Puccetti S., 2004, ApJ, 615, L25
- Elvis et al. (1994) Elvis M. et al., 1994, ApJS, 95, 1
- Ettori (2000) Ettori S., 2000, MNRAS, 311, 313
- Ettori & Balestra (2009) Ettori S., Balestra I., 2009, A&A, 496, 343
- (27) Fiore F., et al., 2001, MNRAS, 327, 771
- Gastaldello et al. (2007) Gastaldello F. et al., 2007, ApJ, 669, 158
- Gastaldello et al. (2008) Gastaldello F. et al., 2008, ApJ, 673, 176
- Gliozzi et al. (2007) Gliozzi M., Sambruna R. M., Foschini L., 2007, ApJ, 662, 878
- (31) Greene J. E., Ho L. C., 2005, ApJ, 627, 721
- Grevesse & Sauval (1998) Grevesse N., Sauval A. J., 1998, Space Science Reviews, 85, 161
- Gu & Huang (2002) Gu Q., Huang J., 2002, ApJ, 579, 205
- Guainazzi et al. (2005) Guainazzi M., Fabian A. C., Iwasawa K., Matt G., Fiore F., 2005, MNRAS, 356, 295
- Guainazzi (2008) Guainazzi M., 2008, XMM-SOC-CAL-TN-0018 issue 2.7
- Hawkins (2004) Hawkins M. R. S., 2004, A&A, 424, 519
- Ho et al. (1995) Ho L. C., Filippenko A. V., Sargent W. L., 1995, ApJS, 98, 477
- Ho et al. (1997b) Ho L. C., Filippenko A. V., Sargent W. L. W., Peng C. Y., 1997, ApJS, 112, 391
- Kuntz & Snowden (2008) Kuntz K. D., Snowden S. L., 2008, A&A, 478, 575
- Kewley et al. (2006) Kewley, L. J., Groves, B., Kauffmann, G., & Heckman, T. 2006, MNRAS, 372, 961
- Lin & Mohr (1981) Lin, Y.-T., & Mohr, J. J, 2004, ApJ, 617, 879
- Maiolino et al. (2001) Maiolino R., Marconi A., Salvati M., Risaliti G., Severgnini P., Oliva E., La Franca F., Vanzi L., 2001, A&A, 365, 28
- Maiolino & Rieke (1995) Maiolino, R., & Rieke, G. H. 1995, ApJ, 454, 95
- Markevitch (1998) Markevitch M., 1998, ApJ, 504, 27
- Mason et al. (2001) Mason K. O. et al., 2001, A&A, 365, L36
- (46) Mateos S., Barcons X., Carrera F. J., Ceballos M. T., Hasinger G., Lehmann I., Fabian A. C., Streblyanska A., 2005, A&A, 444, 79
- Mateos et al. (2009) Mateos S. et al. 2009, A&A, 496, 789
- Matt et al. (2003) Matt G., Guainazzi M., Maiolino R., 2003, MNRAS, 342, 422
- (49) Matt G., Pompilio F., La Franca F., 1999, NewA, 4, 191
- Nicastro (2000) Nicastro F., 2000, ApJ, 530, L65
- Nicastro et al. (2003) Nicastro F., Martocchia A., Matt G., 2003, ApJ, 589, L13
- Oke (1990) Oke, J. B. 1990, AJ, 99, 1621
- (53) Osterbrock D. E., 1981, ApJ, 249, 462
- Panessa & Bassani (2002) Panessa F., Bassani L., 2002, A&A, 394, 435
- Pappa et al. (2001) Pappa A., Georgantopoulos I., Stewart G. C., Zezas A. L., 2001, MNRAS, 326, 995
- (56) Peterson B. M., Pogge R. W., Wanders I., Smith S. M., Romanishin W., 1995, PASP, 107, 579
- Piconcelli et al. (2005) Piconcelli E., Jimenez-Bailón E., Guainazzi M., Schartel N., Rodríguez-Pascual P. M., Santos-Lleó M., 2005, A&A, 432, 15
- (58) Risaliti G., et al., 2009, MNRAS, 393, L1
- (59) Risaliti G., Elvis M., Fabbiano G., Baldi A., Zezas A., Salvati M., 2007, ApJ, 659, L111
- Risaliti et al. (2005) Risaliti G., Elvis M., Fabbiano G., Baldi A., Zezas A., 2005, ApJ, 623, L93
- (61) Risaliti G., Elvis M., 2004, ASSL, 308, 187
- (62) Risaliti G., Elvis M., Nicastro F., 2002, ApJ, 571, 234
- Risaliti et al. (1999) Risaliti, G., Maiolino, R., & Salvati, M. 1999, ApJ, 522, 157
- (64) Shuder J. M., Osterbrock D. E., 1981, ApJ, 250, 55
- Spergel et al. (2003) Spergel, D. N., et al. 2003, ApJS, 148, 175
- (66) Tran H. D., 2001, ApJ, 554, L19
- (67) Tremaine S., et al., 2002, ApJ, 574, 740
- Vasudevan & Fabian (2009) Vasudevan, R. V., & Fabian, A. C. 2009, MNRAS, 392, 1124
- Vikhlinin et al. (1999) Vikhlinin A. et al., 1999, ApJ, 525, 47
- Vikhlinin et al. (2006) Vikhlinin A. et al., 2006, ApJ, 640, 691
- Voges et al. (1999) Voges W. et al., 1999, A&A, 349, 389
- Wang & Zhang (2007) Wang, J.-M., & Zhang, E.-P. 2007, ApJ, 660, 1072
- (73) Ward M., Elvis M., Fabbiano G., Carleton N. P., Willner S. P., Lawrence A., 1987, ApJ, 315, 74
- West & Fradsen (1981) West, R. M., & Fradsen, S. 1981, A&AS, 44, 329
- Whittle (1992) Whittle, M. 1992, ApJS, 79, 49
- Wolter et al. (2005) Wolter A., Gioia I. M., Henry J. P., Mullis C. R., 2005, A&A, 444, 165
Appendix A The serendipitous detection of X-ray emission by the cluster Abell 3783
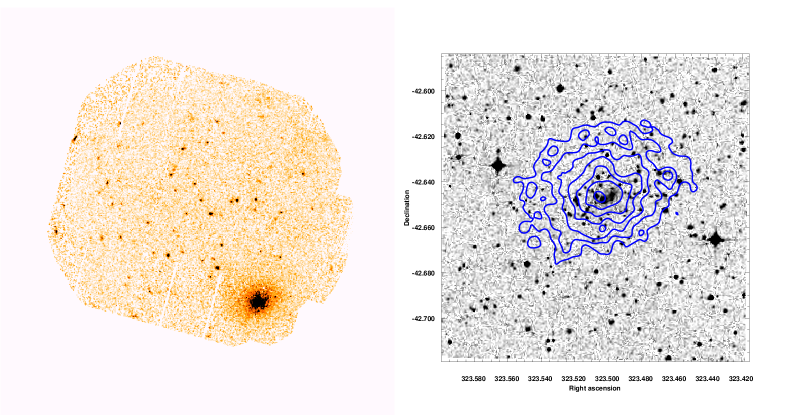
An extended source, of a arc-minute scale, in the field of Q 2131-427 is clearly detected at 10.2′ off-axis (see Fig.5). The X-ray peak of of the source in equatorial coordinates is and it is associated with the cluster of galaxies Abell 3783 (see the overlay of the X-ray contours on the DSS image in Fig.5) at the redshift of (West & Fradsen 1981). With the caveat of the XMM-Newton PSF at this off-axis angle (′′ is the 50% encircled energy fraction radius at 1.5 keV) the peak is consistent with being associated with the brightest galaxy (BCG) of the cluster, 2MASX J21335944-4238448, rather than the likely interloper 2MASX J21340071-4238528 with position at a redshift . These are the only galaxies with redshifts available listed in NED within 3′ of the source. Considerations of the redshift derived from the Fe K complex in the X-ray spectrum, the luminosity and the temperature of the cluster give further strength to the association. In the following we will therefore assume as the redshift of the source for which 1′ corresponds to 194 kpc. All the errors quoted in this Appendix are at the 68% confidence limit.
The data reduction and preparation follow the procedure of Gastaldello et al. (2008) where more details can be found; here we provide just a brief description. The data were re-processed with SAS v8.0.
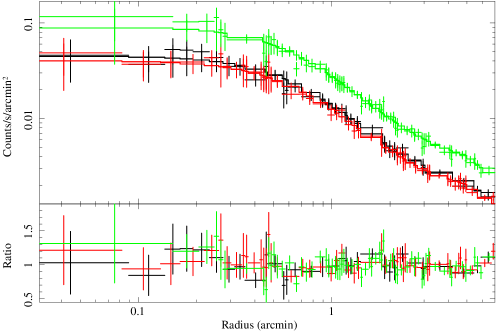
For each detector we created images in the 0.5-2 keV band with point sources masked using circular regions of 25′′ radius centered at the source position. The images have been exposure corrected and a radial surface brightness profile was extracted from a circular region of 7′ of radius centered on the cluster centroid. We account for the X-ray background in the surface brightness analysis by including a constant-background component. The data were grouped to have at least 20 counts per bin in order to apply the statistic. The fitted model is convolved with the XMM-Newton PSF. The joint best-fit -model (Cavaliere & Fusco Femiano 1976) has a core radius of kpc (′′′′) and for a /d.o.f. = 210/141 (see Fig.6). Fits to the profiles of the individual detectors give consistent results within 1 of the combined-fit result and in the case of the MOS2 detector is formally acceptable (49/47). The main contribution to the comes mainly from the pn (/d.o.f. = 102/61 for the fit to the individual profile) and its origin is instrumental (CCD gaps and pixels under-sampling the PSF), whereas a large area of the radial profile at ′ is lost for MOS1 (/d.o.f. = 55/29) due to the missing CCD-6, hence there is no need for more complicated models.
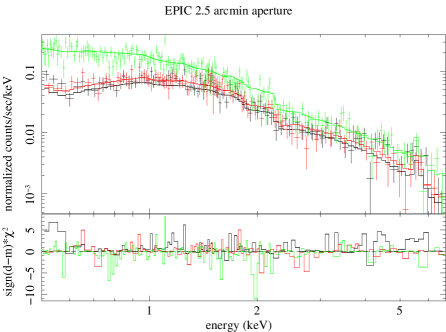
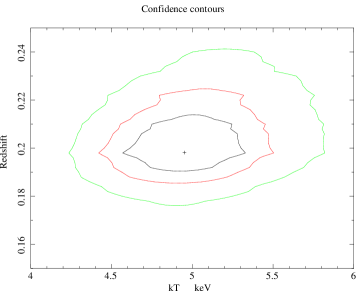
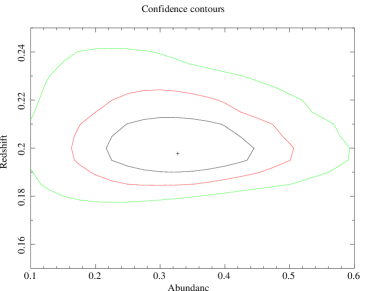
For spectral fitting, we extracted spectra for each detector from a 2.5′ region centered on the peak of the emission, to maximize the S/N over the background. Redistribution matrix files (RMFs) and ancillary response files (ARFs) were generated using the SAS tasks rmfgen and arfgen in extended source mode with appropriate flux weighting. The background was estimated locally using spectra extracted from a source free region of the same extent at the same off-axis angle (avoiding CCD-4 for MOS1 and CCD-5 for MOS 2 because in this observation they display anomalous background for energies below 1 keV, see Kuntz & Snowden 2008). The spectra from the three detectors were re-binned to ensure a signal-to-noise ratio of at least 3 and a minimum 20 counts per bin and they were jointly fitted with an APEC thermal plasma modified by Galactic absorption (Dickey & Lockman 1990). The spectral fitting was performed in the 0.5-7 keV band. The spectra are shown in Fig.7: the best fit parameters are keV and for a /d.o.f. = 418/396. The source photons correspond to about 78% of the total events ( counts in each MOS and 5700 in the pn). If we leave the redshift parameter free we obtain , in good agreement with the redshift determined optically: the quality of the XMM-Newton data is such to tightly constrain the redshift of the cluster; in Fig.8 we show the temperature-redshift and redshift-metal abundance confidence contours.
A likely previous X-ray identification is the ROSAT source 1RXS J213401-423833 in the ROSAT All-Sky bright source catalogue (Voges et al. 1999) and associated with Abell 3783. The ROSAT count-rate of ct/s which corresponds to an unabsorbed flux in the 0.1-2.4 keV band of ergs cm-2 s-1 (for a 5′ extraction radius) is in good agreement with our determination of in the 0.1-2.4 keV band (according to the derived surface brightness model the 2.5′-5′ region contributes only % of the flux within a 5′ region).
To investigate possible spatial variation in the spectral parameters of the cluster, we extracted two annular regions of radii 0′-1′ and 1′-3′. The derived spectral parameters are: keV and with /d.o.f. = 226/177 for the inner annulus; keV and with /d.o.f. = 313/314 for the outer annulus. The width of the bins have been chosen in order to avoid bias in the temperature measurement caused by scattered flux by the PSF. It is difficult, given the off-axis position of the cluster, to asses the existence of gradients in the temperature: given the quality of the data the cluster is consistent with being isothermal over the explored radial range. The abundance gradient, signature of relaxed cool-core cluster (e.g., De Grandi & Molendi 2001), is on the contrary significant at the 2.6 level.
Under the assumption of isothermality and assuming that the cluster follows the best fit model to the surface brightness profile derived above we can calculate the total mass profile using the best-fit -model for which the gas density and total mass profiles can be expressed by simple analytical formula (e.g., Ettori 2000). We evaluated as the radius at which the density is 500 times the the critical density and the virial radius as the radius at which the density corresponds to , as obtained by Bryan & Norman (1998) 333 where , and for the concordance cosmological model used in this paper. To evaluate the errors on the estimated quantities we used the same procedure as above repeating the measurements for 10000 random selections drawn from Gaussian distributions for the temperature and parameters of the surface brightness profile. For we obtained, within kpc; the virial mass is, , within the virial radius kpc. If the identification of 2MASX J21335944-4238448 with the BCG is correct, the optical luminosity calculated in the following Lin & Mohr 2004 is corresponding to , consistent with the central galaxy luminosity-host halo mass relation (and its scatter) derived in the literature (e.g., Lin & Mohr 2004). We calculated the gas mass to be . For Abell 3783, the aperture of 485 kpc used for spectroscopy encloses 74% of the flux within . The derived bolometric luminosity within is ergs s-1: Abell 3783 lies very close to the - relation derived from the cluster sample of objects with keV of Markevitch (1998), though given the angular resolution of the data it has not been possible to correct for the effect of an eventual presence of a cool core (Allen & Fabian 1998; Markevitch 1998).
Finally, as done routinely in our previous analysis (e.g., Gastaldello et al. 2007, 2008) we have studied the sensitivity of our results to various systematic uncertainties and data analysis choices that may impact our results, like varying or using a different energy band (1-7 keV) or standard blank background fields for background subtraction, finding always agreement within the errors with the results reported above. Below we summarize two possible sources of errors not previously explored in our work.
Cross-calibration: improvements have been made in the status of the cross-calibration between the EPIC cameras in the recent SAS releases, but some calibration differences are still present which can affect the spectral parameters of an extended source positioned off-axis like Abell 3783 in the present observation. In the 2.5′ aperture the fit to the individual MOS1 data returns , and Xspec (/d.o.f. = 111/105); for MOS 2 , and (/d.o.f. = 96/114); for pn , and (/d.o.f. = 176/186). The above results correspond to an unabsorbed flux in the 0.5-2 keV band of ergs cm-2 s-1 and ergs s-1 for MOS1, ergs cm-2 s-1 and ergs s-1 for MOS2, ergs cm-2 s-1 and ergs s-1 for pn. The results are within 1 of the best joint fit and the overall trend of higher fluxes of the MOS compared to the pn is consistent with the current calibration uncertainties (Guainazzi 2008, Mateos et al. 2009).
Radial range used in the surface brightness fitting: Simulations and simple analytic models pointed out how the model overestimates gas mass because it returns a biased low due to the restricted range of radii where the fit is performed (e.g. Bartelmann & Steinmetz 1996; Roncarelli et al. 2006). Indeed recent analyses investigating surface brightness profiles of clusters with ROSAT and Chandra find evidence for a steepening of the gas density slope with radius for clusters (Vikhlinin et al. 1999, 2006; Ettori & Balestra 2009) . We investigated fitting the surface brightness profile in a narrower range (5′) and wider range (9′) compared to the choice made in the analysis. Using the narrower range we obtain a core radius of kpc (′′′′) and for a /d.o.f. = 149/129 and using the wider range we obtain kpc (′′′′) and for a /d.o.f. = 338/156. The use of a radial range as large as possible is clearly preferred in the determination of the model parameters, but we did not adopt the fit obtained in the 9′ aperture because of the large residuals due to a not optimal fitting of the background level. This is due to the fact that, because of the off-axis position of the source, the increased radial range is obtained with only a partial azimuthal coverage due to the increasing out of field of view area (only % of the 6′-9′annulus is covered by data in the MOS1 and pn detectors). Had we used the parameters obtained in the narrower range we would have derived within kpc and , within the virial radius kpc whereas using the wider range we would have derived within kpc and , within the virial radius kpc.