Unobscured Type 2 AGNs
Abstract
Type 2 AGNs with intrinsically weak broad emission lines (BELs) would be exceptions to the unified model. After examining a number of proposed candidates critically, we find that the sample is contaminated significantly by objects with BELs of strengths indicating that they actually contain intermediate-type AGNs, plus a few Compton-thick sources as revealed by extremely low ratios of X-ray to nuclear IR luminosities. We develop quantitative metrics that show two (NGC 3147 and NGC 4594) of the remaining candidates to have BELs 2-3 orders of magnitude weaker than those of typical type-1 AGNs. Several more galaxies remain as candidates to have anomalously weak BELs, but this status cannot be confirmed with the existing information. Although the parent sample is poorly defined, the two confirmed objects are well under 1% of its total number of members, showing that the absence of a BEL is possible, but very uncommon in AGN. We evaluate these two objects in detail using multi-wavelength measurements including new IR data obtained with Spitzer and ground-based optical spectropolarimeteric observations. They have little X-ray extinction with 1021 cm-2. Their IR spectra show strong silicate emission (NGC 4594) or weak aromatic features on a generally power law continuum with a suggestion of silicates in emission (NGC 3147). No polarized BEL is detected in NGC 3147. These results indicate that the two unobscured type-2 objects have circumnuclear tori that are approximately face-on. Combined with their X-ray and optical/UV properties, this behavior implies that we have an unobscured view of the nuclei and thus that they have intrinsically weak BELs. We compare their properties with those of the other less-extreme candidates. We then compare the distributions of bolometric luminosities and accretion rates of these objects with theoretical models that predict weak BELs.
Subject headings:
galaxies: Seyfert – galaxies: nuclei1. Introduction
Active galactic nuclei (AGNs) are optically classified into type 1 and type 2: a type 1 object shows broad emission lines (BELs) that are absent in type 2s. The strict AGN unified model (Antonucci, 1993; Urry & Padovani, 2000) states that the apparent large diversity in AGN properties is caused almost entirely by different viewing angles and nuclear luminosities. An AGN is identified as type 2 when a dusty torus is viewed at large inclination (more edge-on) and obscures the BEL region, while a torus in a type 1 AGN is viewed at lower inclination and does not block the BEL region.
In the past few decades, the unified model has achieved tremendous success in explaining the general properties of AGNs. However, there are indications that its axioms may not be universal; parameters other than orientation may influence the observed AGN properties. For example, the host galaxy may play an important role in the type 1/type 2 division. It has been found that a significant fraction of type 2 AGNs are actually obscured by kpc-scale material in the host galaxy instead of the sub-kpc dusty torus (e.g. Keel, 1980; Maiolino & Rieke, 1995; Rigby et al., 2006; Diamond-Stanic et al., 2009a). The typical level of star formation in a type 2 host galaxy is also found to be higher than that in a type 1 host (Maiolino et al., 1995; Shi et al., 2007), implying that a more dusty type 2 host increases the probability of obscuration of the BEL region. In radio-loud AGNs, infrared observations indicate that a significant fraction of type 2 radio galaxies harbor intrinsically weaker nuclei than type 1 galaxies (Whysong & Antonucci, 2004; Shi et al., 2005, 2007; Ogle et al., 2006; Cleary et al., 2007). There are also claims that AGNs with intrinsically weak BEL emission may exist (e.g. Laor, 2003; Hawkins, 2004; Diamond-Stanic et al., 2009b; Hopkins et al., 2009). For example, spectropolarimetric observations reveal hidden BEL (HBEL) regions in only half of type 2 Seyferts (Kay, 1994; Moran et al., 2000; Tran, 2001). The comparison between Seyfert 2 galaxies with and without HBELs reveals a significant difference in the nuclear luminosity between the two populations (Tran, 2001; Gu & Huang, 2002). However, it is unclear if the low nuclear luminosity of Seyfert 2 nuclei without HBELs is simply due to a larger host galaxy contamination for a given nuclear luminosity or if Seyfert 2 galaxies without HBELs harbor genuinely weak nuclei.
In the standard model, a type 2 object shows only narrow optical emission lines in total light and has strong X-ray obscuration. The HI equivalent column density can be inferred through fitting photoelectric absorption models to the X-ray spectrum. As expected, the HI column densities of 96% of type 2 AGNs are larger than 1022 cm-2, and they are therefore considered to be X-ray obscured (Risaliti et al., 1999). However, with the increasing volume of X-ray spectral data, a small sample of type 2 AGNs has been found to be relatively unobscured in the X-ray (Pappa et al., 2001; Xia et al., 2002; Panessa & Bassani, 2002; Georgantopoulos et al., 2003a; Wolter et al., 2005; Gliozzi et al., 2007; Bianchi et al., 2008a; Brightman & Nandra, 2008). In the literature, they are defined as type 2 AGNs with 1022 cm-2. This sample of unusual AGNs may offer the best means to refine the unified model and may identify exceptions to the model that would modify our overall view of the subject.
Various explanations have been proposed to understand the nature of this unusual type of AGN: (1) Compton-thick behavior: The X-ray spectra of Compton-thick objects in the energy range 10 keV are dominated by the reflection of the nuclear emission off the far side of the torus and the HI column densities inferred from X-ray spectral fits are similar to those for unobscured objects; (2) Dilution: The BELs in these objects are overwhelmed by host galaxy light. (3) Variability: Some AGNs change their optical classification on a timescale of years to decades as a result of the location of obscuring material on pc scales. Such objects might be classified as unobscured (in the X-ray) type 2 objects by chance, if the X-ray and optical data are obtained at different times. (4) S/N effect: The BEL can be hidden in a low-S/N optical spectrum while the Compton-thick signature can be lost in a low S/N X-ray spectrum; (5) Exceptions to the AGN unified model: in contrast to the above speculations that still fit the unified model, these X-ray-unobscured type 2 AGNs may harbor genuinely weak BEL regions, and thus are not the simple obscured version of type 1 AGNs expected from the unified model.
In this paper, we will first combine Spitzer IR data with data in the literature to update the current list of X-ray-unobscured type 2 AGN candidates. We then review the members of this list to identify objects that can be explained by points 1 - 4 above and that are therefore not true unobscured type-2 objects. Of 24 candidates from the literature, less than a third are possible true unobscured type-2 AGNs. We evaluate these candidates, including using metrics for relative broad line strength, and find that the broad lines in two of them are at least two orders of magnitude weaker than in typical type-1 AGNs. Their IRS/Spitzer spectra indicate that we have a pole-on view of their circumnuclear tori, consistent with the X-ray measurements of small absorbing columns toward their nuclei. Thus, the properties of these two AGNs appear to be contradictory between type-1 levels of obscuration but type-2 line properties. We conclude that AGN with intrinsically weak BELs are very rare, but that they do exist.
We develop our arguments as follows. In Section 2, we describe the sample selection and data analysis. In Section 3, we eliminate contaminants to the sample of X-ray-unobscured type 2 AGNs, including type 1 AGNs and Compton-thick objects. The IR observations of the remaining objects are presented in Section 4 and placed in context with observations at other wavelengths. Section 5 summarizes our conclusions.
2. Sample Selection And Data Reduction
2.1. Sample Selection
Our initial sample is listed in Table 1 and is composed of 24 objects identified as X-ray-unobscured type 2 AGN candidates in the literature (“candidate” refers to an un-verified suggestion of an X-ray-unobscured type 2 AGN). Panessa & Bassani (2002) compiled a total of 17 candidates. However, as listed in their Table 2, NGC 6221 has 1022 cm-2 and is thus excluded from our list. NGC 2992 is also not included as it has variable , 1.41022 cm-2 in 1997 and 0.900.031022 cm-2 in 1998 (Gilli et al., 2000). IC 1631 is also excluded, since the XMM-Newton observation indicates that it has an X-ray flux three orders of magnitude lower than the upper-limit based on the GINGA measurements originally used in Panessa & Bassani (2002), and it is thus most likely Compton-thick (Bianchi et al., 2008b).
Among objects with AGN types 1.5 and X-ray columns or upper-limits 1022 cm-2 in a complete Seyfert sample observed with XMM-NEWTON by Cappi et al. (2006), we identified two more candidates (NGC 3941 and NGC 4501). Confirmed and possible Compton-thick objects (see their Table 4) are not included. However, the new observation of NGC 4501 with Chandra indicates that the observed low HI column density with XMM-Newton is mainly caused by significant extra-nuclear contamination (Brightman & Nandra, 2008). NGC 4501 is most likely a Compton-thick object and thus excluded from our sample.
2.2. Optical Emission Line Data
These objects were originally classified by different authors. We have re-classified them in a consistent way using the classification scheme in Ho et al. (1997a). The result is listed in Table 1. For each object, we have compiled from the literature the [OIII]5007 flux and the narrow line ratios including , , and . The extinction correction for the line emission follows that of Ho et al. (1997a).
2.3. Optical Spectropolarimeteric Data
To search for possible HBELs in reflection, new spectropolarimeteric observations were obtained for NGC 3147, NGC 4698 and RXJ 1737.0+6601 with the 2.3 m Bok Reflector on Kitt Peak. The observations were carried out on March 30-31, 2008, using the CCD Spectropolarimeter (SPOL; Schmidt et al., 1992), upgraded with a 1200800 pixel, thinned, antireflection-coated, UV-sensitized CCD, and an improved camera lens and half-wave plate. SPOL was configured using a 600 l/mm grating that covers 4400-8200 so that both H and H were included in the spectrum for all three objects. Combined with a slit width of 2′′, the resolution was 15 (900 and 700 km/s at H and H, respectively), adequate to identify BELs (FWHM 1000 km/s). A Y-46 filter was also used to block second-order contamination at H for RXJ1737.0+6601. The observations were made on dark nights to minimize the sky signal. The total integration time was 12,800 sec for NGC 3147 and NGC 4698, and 15,360 sec for RXJ1737.0+6601. The data reduction follows Smith et al. (2003) and the results are shown in Table 2.
2.4. X-ray Data
X-ray data, including observatory, X-ray flux, HI column density and the equivalent width (EW) of the Fe K line, were compiled from the literature and listed in Table 3. Whenever multiple observations were available, all are included to evaluate the X-ray variability and the dependence of the X-ray flux on the spatial resolution.
2.5. Infrared Data
We obtained the Spitzer IRAC photometric and IRS low-resolution spectroscopic data in our own program (PID-40385, PI-G. Rieke) and from other archived programs, as listed in Table 4. The IRAC photometry was measured from the post-BCD images. For the IRS mapping mode, all BCD images were sky-subtracted, bad-pixel-masked and combined to build the final cube using CUBISM (Smith et al., 2007). For the IRS staring mode, the BCD image was cleaned with IRSCLEAN and sky-subtracted using the BCD images of another order but the same module (For a detailed description, see Shi et al., 2009). The archived 2MASS images at , and were also retrieved.
Except for the quasars, the objects were well-resolved with the Spitzer beam. To construct the IR spectral energy distribution (SED), we have adopted different strategies for: (1) quasars; (2) objects mapped with IRS; and (3) nearby objects observed only with the IRS staring mode. For quasars, the SED of the total IR emission was constructed. The IRAC photometry was measured using a 5 pixel radius with sky annulus between 5 and 10 pixels (1.2′′/pixel). The corresponding aperture corrections were 1.061, 1.064, 1.067 and 1.089 for the IRAC 3.6, 4.5, 5.8 and 8.0 m channels, respectively. The IRS spectrum was extracted using the optimal extraction algorithm with SPICE. The 2MASS photometry was extracted using an aperture of 10 pixels (1′′/pixel) and a sky annulus of [10, 15] pixels and the aperture correction was obtained using a star image.
For nearby objects observed with the IRS mapping mode (see Table 4), the extraction aperture for all IR data (2MASS, IRAC and IRS) was defined using the IRAC-5.8m image. The emission at 5.8 m is dominated by hot dust radiation and best locates the active nuclei. The aperture was centered at the peak emission of the 5.8 m image and had a diameter of 9 pixels (equivalent to the slit width of the IRS long-low module). The 2MASS and IRAC photometry were measured within this aperture and the IRS spectrum was also extracted using CUBISM. No aperture corrections were applied for these extended objects. Slight mismatches between different spectral orders, due to astrometric and photometric uncertainties, were removed by re-scaling the longer wavelength order to the next lower one. The scaling adjustments were 10%. The final IRS spectra were then re-normalized to the IRAC photometry at 8 m requiring adjustments by 30%.
For nearby objects observed with the IRS staring mode, the spectra were extracted using the regular extraction algorithm with SPICE. The slit widths of the IRS short-low (5.2-14.5m) and IRS long-low (14.0-38.0m) modules are 3.7′′ and 10.7′′, respectively. The aperture for the IRAC and 2MASS photometry was defined to be centered at the IRS extraction aperture and had a size of 7′′ in diameter, which gave the minimum difference of 20% between the IRAC and IRS flux densities at IRAC 8 m. No aperture correction was applied for these extended objects.

The IRS spectra are shown in Figure 1. For each object, the spectrum of the stellar photospheric emission was estimated from stellar models. To determine the appropriate model, we extracted a series of single stellar population (SSP) models with ages spanning from 0.01 Gyr to 12 Gyr and solar metallicity (Bruzual & Charlot, 2003). The adopted model provides the best match to the 2MASS photometry by minimizing the value, shown as dotted lines. For the quasar RXJ 1737.0+6601 with only K-band photometry, the oldest stellar model was adopted. For each object, we calculated the nuclear IR emission from the dusty torus. The flux densities in the IRAS 12 m and MIPS 24 m filters were measured with the stellar-subtracted IRS spectra. The star-forming component was further subtracted based on the 11.3 m aromatic flux scaled to the Rieke et al. (2009) template. The result for the nuclear IR flux density is listed in Table 4.
3. Identification of Unobscured Type 2 AGNs
3.1. Contaminants
Many sources are incorrectly identified as X-ray-unobscured type 2 AGNs (e.g., Lumsden et al., 2004). These objects must be classified carefully and rejected from the sample. We list the AGN that we eliminated from our initial sample in Table 5 and discuss them below.
3.1.1 AGNs With BELs

As shown in Table 1, we have reclassified all objects in our initial sample on a consistent basis as either HII galaxies (dominated by star formation), LINERs, Seyfert galaxies, or quasars ( 1044 erg s-1), following the scheme of Ho et al. (1997a). This approach is based on narrow emission line ratios including , , and . The presence and strength of a BEL was further used to assign intermediate types (1.2, 1.5, 1.8 & 1.9) to objects classified as AGNs (LINERs, Seyferts and quasars). Two objects have ambiguous classifications. NGC 4579 is at the edge of the division between Seyfert and LINER regimes. NGC 5995 is classified as a HII-galaxy based on and diagnostics, but has a solid Seyfert classification based on the . Its IRS spectrum (Figure 1) is typical of a moderately obscured AGN. The optical spectrum of Mrk 273x does not cover the H line and its AGN nature was deduced from its high X-ray luminosity (1044 erg s-1) (Xia et al., 1999). XBSJ 031146.1-550702 does not have published line ratios and the S1.9 classification is taken from Caccianiga et al. (2004). NGC 6251 is classified as type 2 in Shuder & Osterbrock (1981) but shows a BEL in very narrow-slit HST spectra (Ferrarese & Ford, 1999; Verdoes Kleijn et al., 2006). From the ratio of broad to narrow line strengths in Ferrarese & Ford (1999), it would appear to be an intermediate-type; it could also be variable in type. The strong silicate emission in its spectrum (Figure 1) supports a type-1 designation. For one of the three type 2 quasars identified in Wolter et al. (2005) (RXJ 1737.0+6601), our new high-S/N observation reveals a prominent broad H line as shown in Figure 2, identifying it as a type 1 quasar. The power-law-dominated IR spectrum (Figure 1) is consistent with this classification. The remaining two objects (RXJ 1715.4+6239 and RXJ 1724.9+6636) will require high S/N optical spectra to classify them reliably.

The initial sample of X-ray-unobscured type 2 AGNs in Table 1 is contaminated by four HII galaxies (IRAS 00317-2142, NGC 3660, IRAS 20051-1117 & NGC 7679) whose IR spectra are dominated by aromatic features. All of them show BELs in their optical spectra. They were misclassified as type 2 AGNs in the literature most likely because intense emission from the star-formation region dilutes the BEL emission significantly. Figure 3 shows the relation between the extinction-corrected X-ray luminosity and the total H luminosity corrected for narrow-line extinction (Ho et al., 2001). Two HII objects (IRAS 00317-2142 and IRAS 20051-1117) are also plotted in Figure 3. For the remaining two objects (NGC 3660 & NGC 7679), the H luminosities uncorrected for reddening are shown as lower-limits. The broad component of the H line for NGC 3660 is estimated from the published spectrum in Gonçalves et al. (1999). The X-ray luminosities are from Chandra data for IRAS 00317-2142 and IRS 20051-1117. As shown in Figure 3, even the observed broad H luminosities of two objects (NGC 3660 & NGC 7679) are not significantly lower than the total unabsorbed H luminosities expected from the X-ray luminosities. This result implies that the AGNs in these HII galaxies do not have intrinsically weak BELs and thus should be excluded from the sample.
For the 20 objects classified as AGNs (LINERs, Seyferts, or quasars), only seven are of type 2. To be conservative, we have excluded Mrk 273x, since its optical spectrum does not cover H. The remaining objects show BELs at different levels with classifications ranging from Type 1.2 to type 1.9. Note that the Compton-thin L1.9/S1.9 galaxy NGC 4579 shows a strong silicate emission feature, indicating its weak narrow H emission is not likely to result from extinction. However, the detection of an additional very broad H component indicates that the total emission in this line is significantly larger than in the narrow component alone (Barth et al., 2001).
3.1.2 The Polarization of RXJ 1737.0+6601
Significant linear polarization was discovered in the optical continuum of RXJ 1737.0+6601. The narrow and broad lines appear to be unpolarized (Figure 2) at a 1- polarization level of 1%. If the polarization is due to scattering, the scattering material needs to be relatively close to the BEL region in order to account for the lack of line polarization. Alternatively, the featureless polarized spectrum could result from a synchrotron continuum. Variability of the polarization or the detection of scattered H in future high-S/N spectro-polarimetry of RXJ 1737.0+6601 would be definitive in identifying the source of polarized flux.
3.1.3 Compton-thick AGNs

In Compton-thick AGNs, the transmitted photons are completely absorbed at 2 - 10 keV and the emission is dominated by reflected emission from cold or warm scatterers (Matt et al., 2000). The objects may be thus mis-classified as having low absorption. However, they can still be identified through the much lower luminosity of the reflected component and, usually, by the large equivalent width (EW) of the Fe K line.
Bassani et al. (1999) proposed a two-dimensional diagnostic tool to test if an AGN is a reflection-dominated Compton-thick object, using the EW of FeK and the extinction-corrected flux ratio ( parameter) of to [OIII]5007. Our sample is shown in Figure 4 where all available X-ray observations are included. Objects with available and EW(FeK) data show 1 and EW(FeK) 1 keV, i.e., outside the locus of the Compton-thick region. The result is summarized in Table 5.

A dusty torus in an AGN reprocesses absorbed optical/UV/X-ray energy and re-radiates it in the IR. Under this process, the intrinsic X-ray emission is expected to correlate with the IR emission. Over the past decade, a strong IR/X-ray correlation has emerged (Lutz et al., 2004; Horst et al., 2008; Gandhi et al., 2009). We will use it to search for possible Compton-thick objects within our sample of X-ray-unobscured type 2 AGN candidates111Although the X-ray to the total IR flux ratio has been used to identify the Compton-thick objects in Panessa & Bassani (2002), the significant contribution from stars and star formation to the IR emission complicates the use of their diagnostic.. Figure 5 shows the locus of our sample in the - plane, where the X-ray luminosity is corrected for obscuration assuming it is Compton-thin and the nuclear IR luminosity is obtained by subtracting the stellar and star-formation contributions from the total IR emission. The solid line shows the correlation for local Seyfert galaxies with well-resolved IR cores (Gandhi et al., 2009). As shown in the figure, most of the X-ray-unobscured type 2 candidates have the levels of X-ray emission expected from their nuclear IR emission, confirming that they are Compton-thin. There are three exceptions, NGC 3941, NGC 4565 and NGC 4698, with X-ray luminosities 10 times lower than those expected from the - correlation, given their IR fluxes. Being Compton-thick provides a natural explanation for their low X-ray emission. However, this explanation lacks evidence from other aspects. First, the X-ray spectra do not show Fe K lines with high EWs. The ratios are about 1, 4 and 0.5 for NGC 3941, NGC 4565 and NGC 4698, respectively, which is not significantly below the dividing line (=1) between Compton-thick and Compton-thin objects. Furthermore, the IRS spectra of these three objects do not show silicate absorption features, unlike the general behavior of X-ray-obscured objects (Shi et al., 2006). These sources may have either intrinsically weak X-ray emission or very dusty tori that boost their IR emission. Due to the lack of definitive explanations for their low X-ray emission, we exclude them from the following discussion.
After excluding Compton-thick objects as indicated by extreme low X-ray-to-IR ratio and intermediate type (type 1-1.9) objects (with BELs), the remaining sample of potential X-ray-unobscured type 2 AGNs is composed of five objects: IRAS 01428-0404, NGC 3147, NGC 4594, NGC 7590 and H2000 213115.90-424318.9, as listed in Table 6. Due to the observational complexity in finding real unobscured type 2 AGNs, we discuss various possible limitations to this final sample further.
3.2. The Final Sample of Possible X-ray-Unobscured Type 2 AGNs
3.2.1 The Quality of The Optical Spectra
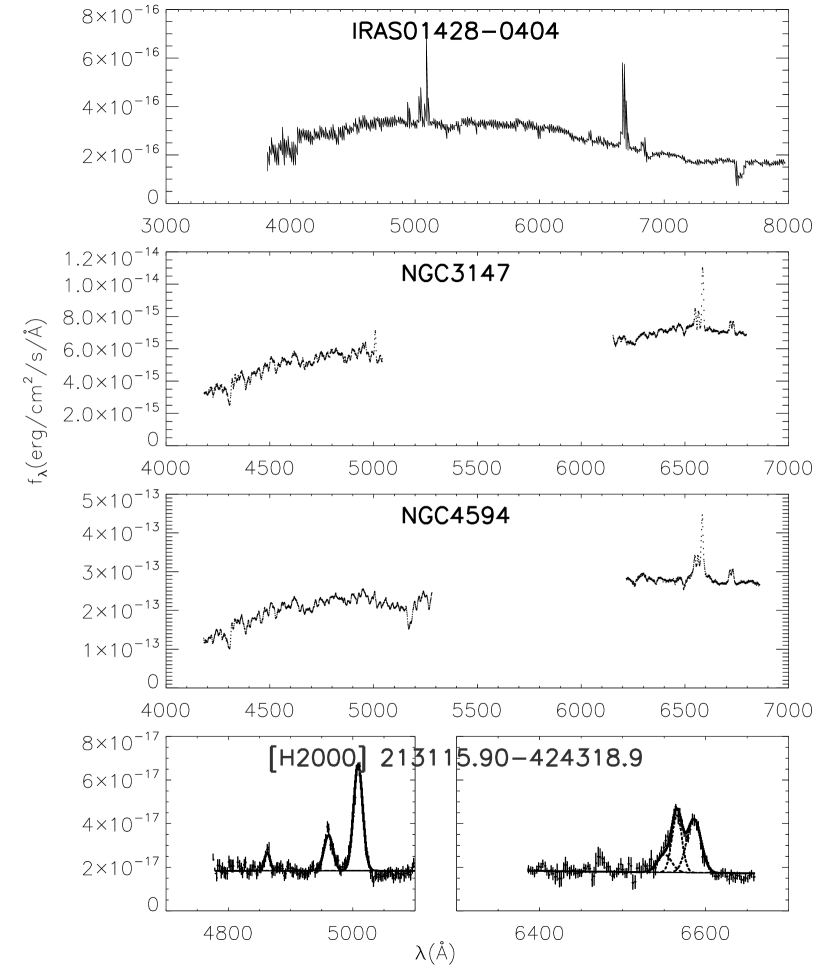
Figure 6 shows the available published optical spectra for four objects. No broad line component is visible in these spectra. Since a so-called “non-detection” actually depends on the S/N that the observation achieves, we develop quantitative methods to measure the reliability of “no BELs” in these objects based on the upper-limits to the BEL fluxes. The upper-limits on the broad H fluxes for NGC 3147 and [H2000] 213115.90-424318.9 are from Bianchi et al. (2008a) and Panessa et al. (2009), respectively. For IRAS01428-0404 and NGC 4594 with published flux-calibrated spectra, the 3- upper limits are derived through 3(FWHM*0.5, where is the noise of the flux density at the spectral resolution of . The FWHM is assumed to be 2200 km/s, the median value for the sample of Ho et al. (1997b).222There is no published spectrum of NGC 7590, although it is described as being a potentially unobscured Type 2 AGN (Panessa & Bassani, 2002).


We evaluate the strength of the BELs in these galaxies (represented by the broad H flux) relative to the X-ray, mid-infrared, and radio nuclear continuum fluxes. These metrics are put in context by comparing them with the distributions for unobscured, type-1 AGN. Figure 7 shows the distribution of extinction-corrected broad H to hard X-ray luminosity ratio () for type 1-1.9 galaxies with solid broad H measurements from Ho et al. (1997b). The hard X-ray data are from Ho et al. (2001), Terashima et al. (2002), Ptak et al. (2004), Pellegrini (2005), González-Martín et al. (2006), Cappi et al. (2006), and Panessa et al. (2006). A second test is based on the observation that measurements at wavelengths near 12m provide a reasonably good estimate of the total luminosity of an AGN (Spinoglio & Malkan, 1989). We use small-beam measurements of the N-band flux for type-1 AGN and compare them with the broad H as shown in Figure 8. The H fluxes for the comparison sample (all type 1.0 - 1.2) are from Lacy et al. (1982), Rafanelli (1985), Neugebauer et al. (1979), Ho et al. (1997b) and Morris & Ward (1988). The are the N-band (10m) luminosities measured through small apertures (a diameter of 2′′ - 6′′) and are collected from Rieke (1978), Neugebauer et al. (1979), Heckman et al. (1983), Maiolino et al. (1995) and Gorjian et al. (2004) 333Small-beam N-band and 1.4 GHz measurements are not available for IRAS 01428-0404 and [H2000]213115.90-424318.9.. The third test is based on the correlation between radio luminosity and the broad H emission as seen by Li et al. (2008), as shown in Figure 9, where the H flux is taken to be H/3.1.
We now discuss five objects that possibly have relatively extreme behavior according to the above three metrics.
NGC 3147: NGC 3147 has upper limits on the ratio of the broad H and H lines to X-ray, nuclear IR and radio luminosities 2-3 orders of magnitude lower than the average value of general type 1 AGNs, as shown in Figures 79. All three tests indicate that NGC 3147 is the strongest case where the BEL is absent or extremely weak. The upper-limit on the BEL flux is based on an assumption of a 2000 km s-1 FWHM (Bianchi et al., 2008a) and a strength larger by 2-3 orders of magnitude would be required to bring this galaxy up into the normal range. Only if the line width were far greater than we have assumed would a significant amount of BEL flux be missed. However, given the relation between virial mass around a black hole and the H and H line widths (Denny et al., 2009), plus the moderate stellar mass in NGC 3147 (M) and thus the expected moderate black hole mass (Table 6), such an explanation would be contrived.
NGC 4594: NGC 4594 is the second strongest case for no BEL as indicated by Figures 79. Kormendy et al. (1996) suggested the presence of broad H based on the overall profile in a high-spatial-resolution HST spectrum. However, Nicholson et al. (1998) argued that the line profile arises from a combination of three narrow lines, H and [NeII]6548, 6583. Walsh et al. (2008) instead found from more recent HST observations that the fit was improved including broad H, but were not able to reach a definite conclusion because the signal to noise was not high enough. On the other hand, no broad H component is seen (Kormendy et al., 1996). A broad component 1-2 orders of magnitude brighter than the upper limit we have used would be necessary to bring this galaxy into the range of normal broad line strengths (Figures 7 and 8). The stellar mass in this galaxy again implies only a moderately massive black hole (Table 6), so as for NGC 3147, it is unlikely that the lines are so broad that they have beenmissed.
IRAS01428-0404 and [H2000] 213115.90-424318.9: The upperlimits on the / are at the edge of the distribution of general type 1 AGNs. Deeper spectroscopic observations with small slits are required to test whether these galaxies harbor extremely faint BELs.
NGC 7590: As there is no available published optical spectrum, we cannot comment on how reliable the absence of a BEL is (Vaceli et al., 1997).
In conclusion, of these five remaining possible X-ray-unobscured type 2 AGNs, two (NGC 3147 and NGC 4594) have optical spectra with sufficient S/N to indicate extremely weak or absent BELs. For the remaining three, there is only moderate evidence that they may harbor no or extremely weak BELs.
3.2.2 The Aperture for the X-ray Observations
Our identification of unobscured X-ray emission in these objects may be mistaken if the X-ray emission is actually dominated by diffuse and/or extra-nuclear point source emission that shows little X-ray obscuration. Some examples are shown in Brightman & Nandra (2008). An example in this study is NGC 4698. It shows a large difference in the X-ray flux between the small aperture of Chandra and large ones of other observatories. It is classified as an unobscured type 2 AGN based on the ASCA observations (Panessa & Bassani, 2002). As shown in § 3.1.3 and Figure 5, this object is likely Compton-thick based on the flux observed with Chandra and it is excluded from our final sample. Only one (NGC 3147) of the final sample listed in Table 6 has a high spatial-resolution (resolution of 0.5′′) Chandra observation. Extra-nuclear contamination could in principle be an explanation for the unusual properties of the remaining objects, but it is not very likely. As indicated in Table 3, only one object (not in our final sample) suffers from this problem among 10 objects with multiple X-ray observations in different apertures.
3.2.3 AGN Variability
AGNs can change their optical classification on a timescale of years to decades. Variation in X-ray obscuration has also been observed for many objects (e.g. Matt et al., 2003; Elvis et al., 2004), either due to a change in the properties of the nucleus or in the motion of an obscuring cloud intercepting our line of sight. A fake X-ray-unobscured type 2 AGN could result from optical and X-ray variability, if observed at different epochs. However, simultaneous optical and X-ray observations have been carried out for NGC 3147 and exclude variable obscuration as a possibility for its behavior (Bianchi et al., 2008a). Similar constraints are available for H2000 213115.90-424318.9 (Panessa et al., 2009). For NGC 4594, multiple X-ray observations do not detect variability and multiple sets of optical data do not reveal BEL variations, but the measurements are not truly simultaneous. Objects still lacking simultaneous X-ray and optical observations are indicated in column (4) of Table 6.
4. Discussion

IR spectra of the two weak-BEL AGN, NGC 3147 and 4594, plus the unconfirmed candidate NGC 7590 are shown in Fig. 10, while the remaining two (IRAS01428-0404 and [H2000]213115.90-424318.9) were not observed by Spitzer. NGC 7590 has strong aromatic emission indicating its mid-IR output is dominated by star forming regions, while NGC 3147 and 4594 show strong contributions by the AGN. We will now put the infrared properties of these AGNs into context with other observations.
4.1. NGC 3147: The Prototypical Unobscured Type 2 AGN
NGC 3147 presents the most complete case for having an unobscured Type-2 AGN, as listed in Table 6. Since it can be considered a prototype for these objects, we discuss its status first.
NGC 3147 was found to have an unobscured X-ray spectrum and no BEL in simultaneous observations by Bianchi et al. (2008a). Brightman & Nandra (2008) carried out a more detailed analysis of the X-ray data and concluded that a Compton-thick component could not be completely excluded, although they pointed out that the X-ray variability provided substantial evidence against this possibility. This can be tested further with our infrared spectrum. In addition to aromatic features of modest equivalent width, a substantial power-law continuum is present. The relatively strong feature in the 16 - 19 m region is probably due in part to silicates in emission. The spectrum shows no silicate absorption as would be expected from a heavily obscured AGN (e.g. Shi et al., 2006). Together with the X-ray variability, the IR spectrum makes the Compton-thick possibility very unlikely.
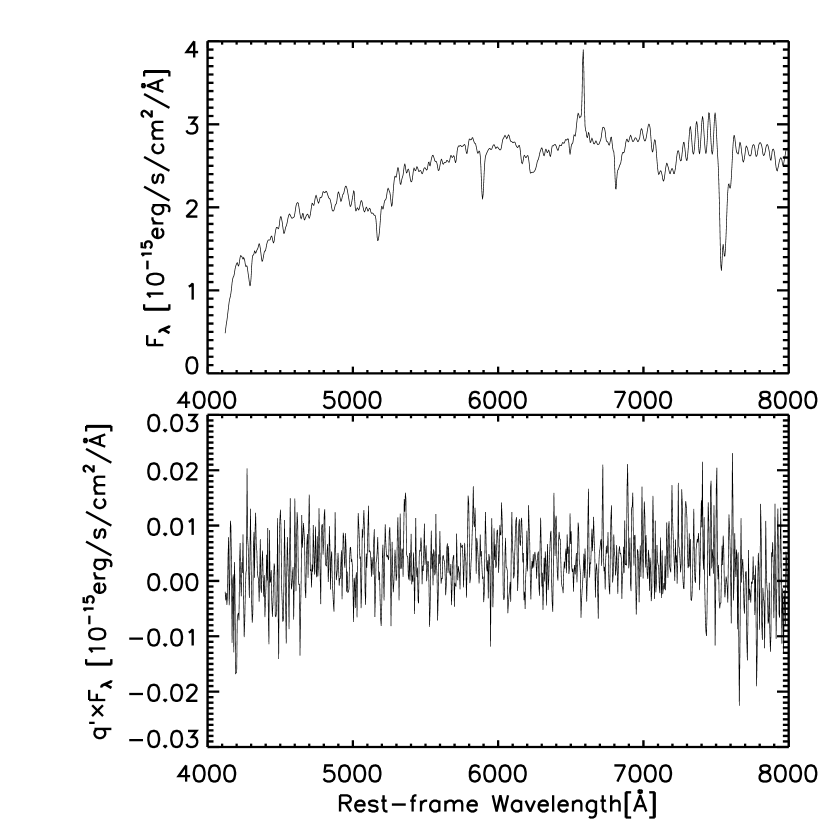
Tran et al. (2005) report that spectropolarimetry of this galaxy did not reveal a hidden BEL, but no details of the observation are provided. The optical spectropolarimeteric observation for NGC 3147 in this study is shown in Figure 11, and H is not detected in polarized light. We set a 3- upper-limit to the peak of any polarized H line of 1.410-17 erg/s/cm2/. The two results together provide a strong limit, since they show that there were no polarized broad lines detected at two separate epochs.
Despite the evidence in the X-ray and mid-infrared for a low level of obscuration, as shown in Figure 79, NGC 3147 has an upper limit to its broad H more than two orders of magnitude lower than would be expected for a type-1 AGN of its intrinsic nuclear luminosity. The very stringent limit on any scattered broad H emission makes it difficult to appeal to some unique geometry to hide the BEL region. Our metrics could be deceptive if the nuclear emission were dominated by star formation, since that would strengthen all the continuum luminosity indicators relative to the broad H. However, the mid-infrared spectrum of NGC 3147 shows only a modest level of contribution from the aromatic bands, indicating that the AGN is dominant. Thus, the case is very strong that this galaxy lacks any significant level of broad line emission.
The case for NGC 4594 having anomalously weak broad lines is also strong. Like NGC 3147, it falls far below the normal Seyferts in its broad H strength relative to the AGN luminosity indicators, and its mid-IR spectrum is dominated by the AGN. Although it does not have X-ray measurements simultaneously with spectroscopy, repeated measurements of both types do not indicate variability at a level that could account for its apparently weak H. As shown in column (13) of Table 6, a variable UV core is detected in NGC 4594. Due to its high sensitivity to dust obscuration, the detection of the nuclear UV emission and its variability imply a low level of obscuration for this AGN.
4.2. Candidate Unobscured Type-2 AGNs as a Whole
With NGC 3147 and NGC 4594 as templates, we review the behavior of the candidates most likely to represent additional weak-BEL AGNs.
4.2.1 Silicate Features
We previously excluded NGC 3941, NGC 4565 and NGC 4698 from consideration because their X-ray properties were between those of Compton thick and unobscured AGN. As shown in Figure 1, the infrared spectra of all three galaxies show silicate emission and resemble the spectrum of NGC 4594 closely. This behavior supports the possibility that these objects may be unobscured with somewhat peculiar X-ray properties. Additional measurements in the X-ray may elucidate whether they are weak-BEL AGN. In comparison, the strong aromatic features in the spectrum of NGC 7590 indicate powerful nuclear star formation that might cause our metrics to underestimate the intrinsic BEL strength relative to the continuum emission of the AGN.
For typical AGNs, the existence of the dusty tori has been demonstrated extensively through thermal IR continuum observations (e.g. Neugebauer et al., 1979), the discovery of polarized BELs in type 2 AGNs (Miller & Antonucci, 1983; Hines et al., 1995; Moran et al., 2000; Hines et al., 1999; Tran, 2001; Schmidt et al., 2002), detection of the silicate features (Roche et al., 1991; Siebenmorgen et al., 2005; Hao et al., 2005; Weedman et al., 2005; Shi et al., 2006), and interferometric imaging of nearby Seyfert galaxies (Jaffe et al., 2004; Tristram et al., 2007). In the unification model, these tori are responsible for obscuring the type-1 nuclei to yield type 2 AGNs. The detection of the silicate feature in emission is evidence for the existence of dusty tori or similar structures in the weak-BEL AGNs. It is possible that the dusty tori in these peculiar sources have special properties to account for their unusual nature.
The material in the dusty torus is either smoothly distributed or clumpy (cloudy) (Fritz et al., 2006; Elitzur, 2008; Nenkova et al., 2008; Hatziminaoglou et al., 2009). In the smooth model, the UV/X-ray radiation directly heats the inner dusty wall that shields the outer part. The dust temperature generally decreases monotonically with distance from the central accretion disk. Therefore, while the BEL region is obscured by the dusty torus, the inner hot wall is also invisible and obscured by the outer cold part. In this case, a silicate absorption feature should be present, i.e., the smooth torus model cannot explain the simultaneous presence of the silicate emission feature and a type 2 optical spectrum in these AGNs.
The smooth dusty model may over-simplify the real situation for AGNs in general. For example, the Seyfert-2/Seyfert-1 ratio of 4 indicates a large covering factor and thick torus (Maiolino & Rieke, 1995), as is also found by interferometric imaging of nearby Seyfert galaxies (Jaffe et al., 2004; Tristram et al., 2007). A thick smooth model is also dynamically unstable against gravitational force. Consequently, several models have been proposed based on a thick cloudy structure (e.g. Krolik, 2007; Schartmann et al., 2009). Clumpy models can explain the Compton-thick/Compton-thin transitions in some objects (Matt et al., 2003; Elvis et al., 2004) in terms of a Compton-thick cloud moving through the line of sight. In general for AGNs, the transition of the silicate feature from emission to absorption with increasing X-ray obscuration supports the predictions of the clumpy model (Shi et al., 2006; Schartmann et al., 2009). For the unobscured type 2 AGNs, the silicate emission is therefore consistent with the small level of X-ray absorption (see Fig. 3 of Shi et al., 2006). Both characteristics indicate that the dusty torus is viewed face-on, i.e., it is not likely that a dusty torus can obscure any BEL region if it exists in these AGNs.
The co-existence of the silicate emission feature, the type 2 optical spectrum and the small X-ray obscuration is therefore not compatible with standard proposals for the circumnuclear tori in these AGNs. It has been suggested that their tori may have a higher-than-normal dust-to-gas ratio (i.e. ), leading to much higher obscuration of the BEL region than that of the X-ray emission. However, since the torus must still be viewed edge-on to obscure the BEL region, this model is inconsistent with the presence of the silicate emission feature.
4.3. Theoretical Interpretation For Weak BELs

There are several theoretical works that predict the disappearance of the BEL region under certain bolometric luminosities or accretion rates (Elitzur & Shlosman, 2006; Czerny et al., 2004; Laor, 2003; Nicastro, 2000; Elitzur & Ho, 2009). In order to compare our sample to the predictions of these models, we have compiled the black-hole (BH) masses from the literature and calculated the bolometric luminosities. For NGC 3147 and NGC 4594, we have compiled the nuclear SED as shown in Figure 12 and Tables 78. The nuclear IR photometry at 12 m and 24 m was obtained by subtracting the stellar and star formation contribution from the total IR emission as described in § 2.5. Fluxes at other wavelengths were obtained through high spatial-resolution observations. We have integrated the SED from GHz to 10 KeV; the bolometric luminosities are listed in Table 6. For the remaining objects, the X-ray flux is used to calculate the bolometric luminosity using the luminosity-dependent relation of X-ray to bolometric luminosity (Shankar et al., 2004).

In the disk-outflow model (Elitzur & Shlosman, 2006), the clouds across the accretion disk rise into the wind and move outward, forming both the BEL and dusty torus regions. The inner hot ionized clouds are responsible for the observed BELs while the outer dusty clouds are the components of the clumpy torus. The outflow rate of clouds is related to the available material reservoir in the accretion disk. For 1042 erg s-1, the accretion rate is not high enough to provide enough cold clouds and the clumpy torus disappears. At somewhat lower accretion rates, the hot cloud outflow is further suppressed, resulting in a vanishing of the BEL regions. As shown in Figure 13, NGC 4594 has a bolometric luminosity below 1042 erg s-1. However, this galaxy shows strong silicate emission features at both 9.7 and 18 m, indisputable evidence for the existence of the dusty torus. Elitzur & Ho (2009) have derived a lower bound below which the BEL does not exist, which is even more difficult to make compatible with our results.
There is a limit on the maximum velocity of the BEL ( 25, 000 km s-1) (Laor, 2003). Using the well-known correlation between the BEL size and the luminosity, such a limit implies BELs may not exist at low luminosities for a given BH mass. This critical luminosity is approximately 1041.8( erg s-1. Only one object is below this limit in Figure 13. Although the maximum velocity is observationally uncertain, to include most of our sample in the region where Laor (2003) would predict no BEL, the required maximum velocity needs to be ten times lower, obviously inconsistent with the observations.
Nicastro (2000) proposes a vertical outflow as the origin of the BEL clouds, in a configuration where the radially accreting disk and vertically outflowing corona coexist. Below an accretion rate of =, the accretion disk is gas-pressure-dominated throughout. As a result, all the available energy is dissipated in the disk and no radiation-supported and -driven wind is produced. Adopting a mass-to-energy conversion coefficient =0.06 and a viscosity coefficient =0.1, the limiting bolometric luminosity is shown in Figure 13. This model can explain all of the objects in our sample. This suggests that the luminosity and accretion rate may play an important role in the existence of the BEL region. However, the situation may be more complicated as there are some type 1 objects with low luminosity (1042 erg s-1) and accretion rate (10-3) (Ho, 2008; Elitzur & Ho, 2009).
5. CONCLUSION
We have presented a multi-wavelength study of unobscured type 2 AGNs. Our conclusions are the following:
(1) We have found that the original sample of this proposed type of AGN is contaminated by many objects with BELs, as revealed by our consistent optical classification and new observations. One of these objects, RXJ 1737.0+6601, has a highly polarized optical continuum. Additional contaminants include several new Compton-thick candidates with extremely low nuclear X-ray-to-IR ratios.
(2) We have identified two objects that appear to be true unobscured type-2 AGNs: NGC 3147 and NGC 4594. They have little X-ray extinction with 1021 cm-2. The upper-limits on the BEL luminosities at a given nuclear X-ray, IR or radio luminosity are two orders of magnitude lower in relative BEL strength than the average of typical type-1 AGNs. Several other galaxies remain as candidates to be weak-BEL AGN.
(3) From the small number of confirmed cases, unobscured Type 2 AGN do exist but they are very rare.
(4) The IR spectra of the unobscured type 2 AGNs and of many of the candidates show silicate emission features. The presence of the silicate features demonstrates the existence of dusty tori and that the tori are viewed approximately face-on.
(5) Thus, in contradiction to the simple unified model, the X-ray and IR properties indicate that the nuclei are viewed directly without intervening obscuring material, despite the intrinsically weak broad emission lines.
(6) The distributions of the bolometric luminosity and the accretion rate of these objects contradict some theoretical studies but are consistent with the work of Nicastro (2000).
References
- Anderson et al. (2004) Anderson, J. M., Ulvestad, J. S., & Ho, L. C. 2004, ApJ, 603, 42
- Antonucci (1993) Antonucci, R. 1993, ARA&A, 31, 473
- Barcons et al. (2003) Barcons, X., Carrera, F. J., & Ceballos, M. T. 2003, MNRAS, 346, 897
- Barth et al. (2001) Barth, A. J., Ho, L. C., Filippenko, A. V., Rix, H.-W., & Sargent, W. L. W. 2001, ApJ, 546, 205
- Bassani et al. (1999) Bassani, L., Dadina, M., Maiolino, R., Salvati, M., Risaliti, G., della Ceca, R., Matt, G., & Zamorani, G. 1999, ApJS, 121, 473
- Bian & Gu (2007) Bian, W., & Gu, Q. 2007, ApJ, 657, 159
- Bianchi et al. (2008a) Bianchi, S., Corral, A., Panessa, F., Barcons, X., Matt, G., Bassani, L., Carrera, F. J., & Jiménez-Bailón, E. 2008, MNRAS, 385, 195
- Bianchi et al. (2008b) Bianchi, S., Corral, A., Panessa, F., Barcons, X., Matt, G., Bassani, L., Carrera, F. J., & Jiménez-Bailón, E. 2008, 8th National Conference on AGN, held in Torino, Italy, May 19-22, 2008. Edited by L. Lanteri, C.M. Raiteri, A. Capetti, and P. Rossi. Available online at agn8.oato.inaf.it.
- Brightman & Nandra (2008) Brightman, M., & Nandra, K. 2008, MNRAS, 390, 1241
- Bruzual & Charlot (2003) Bruzual, G., & Charlot, S. 2003, MNRAS, 344, 1000
- Caccianiga et al. (2004) Caccianiga, A., et al. 2004, A&A, 416, 901
- Cappi et al. (2006) Cappi, M., et al. 2006, A&A, 446, 459
- Czerny et al. (2004) Czerny, B., Rózańska, A., & Kuraszkiewicz, J. 2004, A&A, 428, 39
- Chiaberge et al. (2006) Chiaberge, M., Gilli, R., Macchetto, F. D., & Sparks, W. B. 2006, ApJ, 651, 728
- Cleary et al. (2007) Cleary, K., Lawrence, C. R., Marshall, J. A., Hao, L., & Meier, D. 2007, ApJ, 660, 117
- Corral et al. (2005) Corral, A., Barcons, X., Carrera, F. J., Ceballos, M. T., & Mateos, S. 2005, A&A, 431, 97
- Della Ceca et al. (2001) Della Ceca, R., Pellegrini, S., Bassani, L., Beckmann, V., Cappi, M., Palumbo, G. G. C., Trinchieri, G., & Wolter, A. 2001, A&A, 375, 781
- Denny et al. (2009) Denny, K. D., Peterson, B. M., Dietrich, M., Vestergaard, M., & Bentz, M. C. 2009, ApJ, 692, 246
- Dewangan et al. (2004) Dewangan, G. C., Griffiths, R. E., Di Matteo, T., & Schurch, N. J. 2004, ApJ, 607, 788
- Diamond-Stanic et al. (2009a) Diamond-Stanic, A. M., Rieke, G. H., & Rigby, J. R. 2009a, ApJ, 698, 623
- Diamond-Stanic et al. (2009b) Diamond-Stanic, A. M., et al. 2009b, ApJ, 699, 782
- Dong & De Robertis (2006) Dong, X. Y., & De Robertis, M. M. 2006, AJ, 131, 1236
- Elitzur & Shlosman (2006) Elitzur, M., & Shlosman, I. 2006, ApJ, 648, L101
- Elitzur (2008) Elitzur, M. 2008, New Astronomy Review, 52, 274
- Elitzur & Ho (2009) Elitzur, M., & Ho, L. C. 2009, ApJ, 701, L91
- Elvis et al. (2004) Elvis, M., Risaliti, G., Nicastro, F., Miller, J. M., Fiore, F., & Puccetti, S. 2004, ApJ, 615, L25
- Evans et al. (2005) Evans, D. A., Hardcastle, M. J., Croston, J. H., Worrall, D. M., & Birkinshaw, M. 2005, MNRAS, 359, 363
- Eracleous et al. (2002) Eracleous, M., Shields, J. C., Chartas, G., & Moran, E. C. 2002, ApJ, 565, 108
- Ferrarese & Ford (1999) Ferrarese, L., & Ford, H. C. 1999, ApJ, 515, 583
- Fritz et al. (2006) Fritz, J., Franceschini, A., & Hatziminaoglou, E. 2006, MNRAS, 366, 767
- Fitzpatrick (1999) Fitzpatrick, E. L. 1999, PASP, 111, 63
- Gandhi et al. (2009) Gandhi, P., Horst, H., Smette, A., Hoenig, S., Comastri, A., Gilli, R., Vignali, C., & Duschl, W. 2009, arXiv:0902.2777
- Georgantopoulos (2000) Georgantopoulos, I. 2000, MNRAS, 315, 77
- Georgantopoulos et al. (2003a) Georgantopoulos, I., Zezas, A., & Ward, M. J. 2003a, ApJ, 584, 129
- Georgantopoulos & Zezas (2003b) Georgantopoulos, I., & Zezas, A. 2003b, ApJ, 594, 704
- Georgantopoulos et al. (2004) Georgantopoulos, I., Papadakis, I., Zezas, A., & Ward, M. J. 2004, ApJ, 614, 634
- Gilli et al. (2000) Gilli, R., Maiolino, R., Marconi, A., Risaliti, G., Dadina, M., Weaver, K. A., & Colbert, E. J. M. 2000, A&A, 355, 485
- Gliozzi et al. (2004) Gliozzi, M., Sambruna, R. M., Brandt, W. N., Mushotzky, R., & Eracleous, M. 2004, A&A, 413, 139
- Gliozzi et al. (2007) Gliozzi, M., Sambruna, R. M., & Foschini, L. 2007, ApJ, 662, 878
- Gonçalves et al. (1999) Gonçalves, A. C., Véron-Cetty, M.-P., & Véron, P. 1999, A&AS, 135, 437
- González-Martín et al. (2006) González-Martín, O., Masegosa, J., Márquez, I., Guerrero, M. A., & Dultzin-Hacyan, D. 2006, A&A, 460, 45
- Gorjian et al. (2004) Gorjian, V., Werner, M. W., Jarrett, T. H., Cole, D. M., & Ressler, M. E. 2004, ApJ, 605, 156
- Gu & Huang (2002) Gu, Q., & Huang, J. 2002, ApJ, 579, 205
- Hao et al. (2005) Hao, L., et al. 2005, ApJ, 625, L75
- Hatziminaoglou et al. (2009) Hatziminaoglou, E., Fritz, J., & Jarrett, T. 2009, arXiv:0907.2389
- Hawkins (2004) Hawkins, M. R. S. 2004, A&A, 424, 519
- Heisler et al. (1997) Heisler, C. A., Lumsden, S. L., & Bailey, J. A. 1997, Nature, 385, 700
- Heckman et al. (1983) Heckman, T. M., Lebofsky, M. J., Rieke, G. H., & van Breugel, W. 1983, ApJ, 272, 400
- Hines et al. (1995) Hines, D. C., Schmidt, G. D., Smith, P. S., Cutri, R. M., & Low, F. J. 1995, ApJ, 450, L1
- Hines et al. (1999) Hines, D. C., Schmidt, G. D., Wills, B. J., Smith, P. S., & Sowinski, L. G. 1999, ApJ, 512, 145
- Ho et al. (1997a) Ho, L. C., Filippenko, A. V., & Sargent, W. L. W. 1997a, ApJS, 112, 315
- Ho et al. (1997b) Ho, L. C., Filippenko, A. V., Sargent, W. L. W., & Peng, C. Y. 1997b, ApJS, 112, 391
- Ho et al. (2001) Ho, L. C., et al. 2001, ApJ, 549, L51
- Ho (2008) Ho, L. C. 2008, ARA&A, 46, 475
- Hopkins et al. (2009) Hopkins, P. F., Hickox, R., Quataert, E., & Hernquist, L. 2009, MNRAS, 398, 333
- Horst et al. (2008) Horst, H., Gandhi, P., Smette, A., & Duschl, W. J. 2008, A&A, 479, 389
- Hummel et al. (1984) Hummel, E., van der Hulst, J. M., & Dickey, J. M. 1984, A&A, 134, 207
- Jaffe et al. (2004) Jaffe, W., et al. 2004, Nature, 429, 47
- Kay (1994) Kay, L. E. 1994, ApJ, 430, 196
- Keel (1980) Keel, W. C. 1980, AJ, 85, 198
- Kewley et al. (2001) Kewley, L. J., Heisler, C. A., Dopita, M. A., & Lumsden, S. 2001, ApJS, 132, 37
- Kollatschny et al. (1983) Kollatschny, W., Biermann, P., sFricke, K. J., Huchtmeier, W., & Witzel, A. 1983, A&A, 119, 80
- Kormendy et al. (1996) Kormendy, J., et al. 1996, ApJ, 473, L91
- Krips et al. (2006) Krips, M., Eckart, A., Neri, R., Schödel, R., Leon, S., Downes, D., García-Burillo, S., & Combes, F. 2006, A&A, 446, 113
- Krips et al. (2007) Krips, M., et al. 2007, A&A, 464, 553
- Krolik (2007) Krolik, J. H. 2007, ApJ, 661, 52
- Laor (2003) Laor, A. 2003, ApJ, 590, 86
- Lacy et al. (1982) Lacy, J. H., et al. 1982, ApJ, 256, 75
- Li et al. (2008) Li, Z.-Y., Wu, X.-B., & Wang, R. 2008, ApJ, 688, 826
- Lumsden et al. (2001) Lumsden, S. L., Heisler, C. A., Bailey, J. A., Hough, J. H., & Young, S. 2001, MNRAS, 327, 459
- Lumsden et al. (2004) Lumsden, S. L., Alexander, D. M., & Hough, J. H. 2004, MNRAS, 348, 1451
- Lutz et al. (2004) Lutz, D., Maiolino, R., Spoon, H. W. W., & Moorwood, A. F. M. 2004, A&A, 418, 465
- Maiolino & Rieke (1995) Maiolino, R., & Rieke, G. H. 1995, ApJ, 454, 95
- Maiolino et al. (1995) Maiolino, R., Ruiz, M., Rieke, G. H., & Keller, L. D. 1995, ApJ, 446, 561
- Maoz et al. (1998) Maoz, D., Koratkar, A., Shields, J. C., Ho, L. C., Filippenko, A. V., & Sternberg, A. 1998, AJ, 116, 55
- Maoz et al. (2005) Maoz, D., Nagar, N. M., Falcke, H., & Wilson, A. S. 2005, ApJ, 625, 699
- Matt et al. (2000) Matt, G., Fabian, A. C., Guainazzi, M., Iwasawa, K., Bassani, L., & Malaguti, G. 2000, MNRAS, 318, 173
- Matt et al. (2003) Matt, G., Guainazzi, M., & Maiolino, R. 2003, MNRAS, 342, 422
- Miller & Antonucci (1983) Miller, J. S., & Antonucci, R. R. J. 1983, ApJ, 271, L7
- Moran et al. (1996) Moran, E. C., Halpern, J. P., & Helfand, D. J. 1996, ApJS, 106, 341
- Moran et al. (2000) Moran, E. C., Barth, A. J., Kay, L. E., & Filippenko, A. V. 2000, ApJ, 540, L73
- Morris & Ward (1988) Morris, S. L., & Ward, M. J. 1988, MNRAS, 230, 639
- Nenkova et al. (2008) Nenkova, M., Sirocky, M. M., Nikutta, R., Ivezić, Ž., & Elitzur, M. 2008, ApJ, 685, 160
- Neugebauer et al. (1979) Neugebauer, G., Oke, J. B., Becklin, E. E., & Matthews, K. 1979, ApJ, 230, 79
- Nicholson et al. (1998) Nicholson, K. L., Reichert, G. A., Mason, K. O., Puchnarewicz, E. M., Ho, L. C., Shields, J. C., & Filippenko, A. V. 1998, MNRAS, 300, 893
- Nicastro (2000) Nicastro, F. 2000, ApJ, 530, L65
- Ogle et al. (2006) Ogle, P., Whysong, D., & Antonucci, R. 2006, ApJ, 647, 161
- Panessa & Bassani (2002) Panessa, F., & Bassani, L. 2002, A&A, 394, 435
- Panessa et al. (2006) Panessa, F., Bassani, L., Cappi, M., Dadina, M., Barcons, X., Carrera, F. J., Ho, L. C., & Iwasawa, K. 2006, A&A, 455, 173
- Panessa et al. (2009) Panessa, F., et al. 2009, arXiv:0906.1974
- Pappa et al. (2001) Pappa, A., Georgantopoulos, I., Stewart, G. C., & Zezas, A. L. 2001, MNRAS, 326, 995
- Pellegrini et al. (2003) Pellegrini, S., Baldi, A., Fabbiano, G., & Kim, D.-W. 2003, ApJ, 597, 175
- Pellegrini (2005) Pellegrini, S. 2005, ApJ, 624, 155
- Pietsch et al. (1998) Pietsch, W., Bischoff, K., Boller, T., Doebereiner, S., Kollatschny, W., & Zimmermann, H.-U. 1998, A&A, 333, 48
- Ptak et al. (2004) Ptak, A., Terashima, Y., Ho, L. C., & Quataert, E. 2004, ApJ, 606, 173
- Rafanelli (1985) Rafanelli, P. 1985, A&A, 146, 17
- Rieke (1978) Rieke, G. H. 1978, ApJ, 226, 550
- Rieke et al. (2009) Rieke, G. H., Alonso-Herrero, A., Weiner, B. J., Pérez-González, P. G., Blaylock, M., Donley, J. L., & Marcillac, D. 2009, ApJ, 692, 556
- Rigby et al. (2006) Rigby, J. R., Rieke, G. H., Donley, J. L., Alonso-Herrero, A., & Pérez-González, P. G. 2006, ApJ, 645, 115
- Risaliti et al. (1999) Risaliti, G., Maiolino, R., & Salvati, M. 1999, ApJ, 522, 157
- Roche et al. (1991) Roche, P. F., Aitken, D. K., Smith, C. H., & Ward, M. J. 1991, MNRAS, 248, 606
- Sambruna et al. (1999) Sambruna, R. M., Eracleous, M., & Mushotzky, R. F. 1999, ApJ, 526, 60
- Schartmann et al. (2009) Schartmann, M., Meisenheimer, K., Klahr, H., Camenzind, M., Wolf, S., & Henning, T. 2009, MNRAS, 393, 759
- Schmidt et al. (1992) Schmidt, G. D., Stockman, H. S., & Smith, P. S. 1992, ApJ, 398, L57
- Schmidt et al. (2002) Schmidt, G. D., Smith, P. S., Foltz, C. B. & Hines, D. C. 2002, ApJ, 578, L99
- Smith et al. (2003) Smith, P. S., Schmidt, G. D., Hines, D. C., & Foltz, C. B. 2003, ApJ, 593, 676
- Smith et al. (2007) Smith, J. D. T., et al. 2007, PASP, 119, 1133
- Shankar et al. (2004) Shankar, F., Salucci, P., Granato, G. L., De Zotti, G., & Danese, L. 2004, MNRAS, 354, 1020
- Shi et al. (2005) Shi, Y., et al. 2005, ApJ, 629, 88
- Shi et al. (2006) Shi, Y., et al. 2006, ApJ, 653, 127
- Shi et al. (2007) Shi, Y., et al. 2007, ApJ, 669, 841
- Shi et al. (2009) Shi, Y., Rieke, G. H., Ogle, P., Jiang, L., & Diamond-Stanic, A. M. 2009, ApJ, 703, 1107
- Shinozaki et al. (2006) Shinozaki, K., Miyaji, T., Ishisaki, Y., Ueda, Y., & Ogasaka, Y. 2006, AJ, 131, 2843
- Shuder & Osterbrock (1981) Shuder, J. M., & Osterbrock, D. E. 1981, ApJ, 250, 55
- Siebenmorgen et al. (2005) Siebenmorgen, R., Haas, M., Krügel, E., & Schulz, B. 2005, A&A, 436, L5
- Spinoglio & Malkan (1989) Spinoglio, L. & Malkan, M. A. 1989, ApJ, 342, 83
- Terashima et al. (2002) Terashima, Y., Iyomoto, N., Ho, L. C., & Ptak, A. F. 2002, ApJS, 139, 1
- Terashima & Wilson (2003) Terashima, Y., & Wilson, A. S. 2003, ApJ, 583, 145
- Tonry et al. (2001) Tonry, J. L., Dressler, A., Blakeslee, J. P., Ajhar, E. A., Fletcher, A. B., Luppino, G. A., Metzger, M. R., & Moore, C. B. 2001, ApJ, 546, 681
- Tran (2001) Tran, H. D. 2001, ApJ, 554, L19
- Tran et al. (2005) Tran, H. D., Mader, J. A., & Lyke, J. 2005, BAAS, 20717406
- Tristram et al. (2007) Tristram, K. R. W., et al. 2007, A&A, 474, 837
- Urry & Padovani (2000) Urry, M., & Padovani, P. 2000, PASP, 112, 1516
- Vaceli et al. (1997) Vaceli, M. S., Viegas, S. M., Gruenwald, R., & de Souza, R. E. 1997, AJ, 114, 1345
- Verdoes Kleijn et al. (2006) Verdoes Kleijn, G. A., van der Marel, R. P., & Noel-Storr, J. 2006, AJ, 131, 1961
- Walsh et al. (2008) Walsh, J. L., Barth, A. J., Ho, L. C., Filippenko, A. V., Rix, H.-W., Shields, J. C., Sarzi, M., & Sargent, W. L. W. 2008, AJ, 136, 1677
- Wang & Zhang (2007) Wang, J.-M., & Zhang, E.-P. 2007, ApJ, 660, 1072
- Weedman et al. (2005) Weedman, D. W., et al. 2005, ApJ, 633, 706
- Whysong & Antonucci (2004) Whysong, D., & Antonucci, R. 2004, ApJ, 602, 116
- Wolter et al. (2005) Wolter, A., Gioia, I. M., Henry, J. P., & Mullis, C. R. 2005, A&A, 444, 165
- Xia et al. (1999) Xia, X.-Y., Mao, S., Wu, H., Liu, X.-W., Gao, Y., Deng, Z.-G., & Zou, Z.-L. 1999, ApJ, 524, 746
- Xia et al. (2002) Xia, X. Y., Xue, S. J., Mao, S., Boller, T., Deng, Z. G., & Wu, H. 2002, ApJ, 564, 196
| sources | D | Type | Ref. | ||||||
|---|---|---|---|---|---|---|---|---|---|
| (1) | (2) | (3) | (4) | (5) | (6) | (7) | (8) | (9) | (10) |
| IRAS 00317-2142 | 113.2 | HII+BEL(H) | 10.2 | 0.45 | 0.93 | 0.03 | 0.21 | 8.51 | 1 |
| IRAS 01428-0404 | 75.6 | S2 | – | 0.7 | 3.7 | 0.2 | 0.4 | – | 2 |
| Mrk 993 | 65.1 | S1.5 | 15.4 | 2.20 | 12.02 | 0.46 | 1.35 | – | 3 |
| NGC 3147 | 45.1 | S2 | 9.50 | 2.71 | 6.14 | 0.15 | 1.14 | – | 4 |
| NGC 3660 | 58.5 | HII+BEL(H) | 98.8 | 0.47 | 2.80 | 0.05 | 0.20 | 2.0 | 5,6 |
| NGC 3941 | 12.2a | S2 | 3.60 | 1.56 | 3.52 | 0.130 | 0.95 | 4 | |
| NGC 4565 | 17.5a | S1.9 | 6.87 | 2.50 | 8.73 | 0.31 | 0.97 | – | 4 |
| NGC 4579 | 14.5 | S1.9/L1.9 | 8.88 | 1.89 | 3.07 | 0.48 | 1.52 | – | 4 |
| NGC 4594 | 9.8a | L2 | 6.65 | 2.19 | 1.57 | 0.18 | 1.07 | – | 4 |
| NGC 4698 | 14.3 | S2 | 2.15 | 1.31 | 4.29 | 0.074 | 0.88 | – | 4 |
| NGC 5033 | 18.0 | S1.5 | 18.1 | 2.36 | 4.69 | 0.29 | 1.08 | – | 4 |
| H1320+551 | 284.6 | S1.8 | 110 | 1.40 | 18.17 | 0.36 | 0.72 | – | 7 |
| Mrk 273x | 1964.8 | S2 | 0.138b | 5.75b | – | 8 | |||
| NGC 5995 | 117.5 | S1.9/HII+BEL(H) | 660 | 1.02 | 6.31 | 0.058 | 0.22 | – | 9 |
| NGC 6251 | 109.1 | S1 | 4.4 | 2.65 | 11.21 | 0.25 | 0.29 | – | 10 |
| IRAS 20051-1117 | 138.7 | HII+BEL(H, H) | 6.11 | 0.61 | 2.58 | 0.054 | 0.32 | 2.63 | 1 |
| NGC 7590 | 22.9 | S2 | 3.0 | 1.05 | 5.0 | 0.11 | 0.86 | – | 11 |
| NGC 7679 | 72.8 | HII+BEL(H) | – | 0.50 | 0.95 | 0.035 | 0.28 | 5.86 | 12, 13 |
| RXJ1715.4+6239 | 3642.1 | QSO2.0? | – | – | – | – | – | – | 14 |
| RXJ1724.9+6636 | 2910.3 | QSO2.0? | – | – | – | – | – | – | 14 |
| RXJ1737.0+6601 | 1534.8 | QSO1.0 | – | – | – | – | – | – | 15 |
| XBSJ031146.1-550702 | 775 | S1.9 | – | – | – | – | – | – | 16 |
| H2004213004.24-430744.2 | 1349 | S1.2 | 0.18 | 1.69 | 10.64 | – | 0.51 | – | 17 |
| H2000213115.90-424318.9 | 1947 | S2 | 0.31 | 1.33 | 8.97 | – | – | – | 17 |
Note. — Col.(1): Sources; Col.(2): Distance in Mpc given by D(Virgo+GA+Shapley) as measured by NED for H0=70 km/s/Mpc, =0.3 and =0.7. a Distance is from Tonry et al. (2001). Col.(3): Optical AGN type. Col.(4): Extinction-corrected [OIII]5007 line flux in the unit of 10-14 erg/cm2/s. The extinction is derived from Balmer decrement using = 2.02 and based on the extinction curve of Fitzpatrick (1999) (see their Fig.6), where = Hα/Hβ and = 3.1. b Not corrected for extinction due to the lack of H measurement. Col.(5)-(8): Extinction-corrected , , and . Col.(9): The observed broad H flux in the unit of 10-14 erg/cm2/s. Col.(10): References for optical line fluxes.
References: 1 – Moran et al. (1996); 2 – Pietsch et al. (1998); 3 – Corral et al. (2005); 4 – Ho et al. (1997a); 5 – Kollatschny et al. (1983); 6 – Gonçalves et al. (1999); 7 – Barcons et al. (2003); 8 – Xia et al. (1999); 9 – Lumsden et al. (2001); 10 – Ferrarese & Ford (1999); 11 – Vaceli et al. (1997); 12 – Kewley et al. (2001); 13 – Della Ceca et al. (2001); 14 – Wolter et al. (2005); 15 – This work; 16 – Caccianiga et al. (2004); 17 – Panessa et al. (2009)
| sources | Wavelength | Polarization | P.A. |
|---|---|---|---|
| RXJ 1737.0+6601 | [3500, 6000]Å | 2.410.08% | 7.50.9∘ |
| NGC3147 | [4500, 7500]Å | 0.140.01% | 158.11.6∘ |
| NGC4698 | [4500, 7500]Å | 0.130.01% | 167.81.7∘ |
Note. — The error bar is given at 1- level.
| sources | Observatory | EWFeKα | Ref. | |||
|---|---|---|---|---|---|---|
| [10-12erg/s/cm2] | [1020cm-2] | [eV] | ||||
| (1) | (2) | (3) | (4) | (5) | (6) | |
| IRAS 00317-2142 | Chandra | 0.21 | 83 | 1400 | 1 | |
| ASCA | 0.8 | 1.9 | 900 | 2 | ||
| IRAS 01428-0404 | ASCA | 0.4 | 32 | – | 3 | |
| Mrk 993 | XMM | 1.34 | 7.21.1 | 270 | 4 | |
| NGC 3147 | Chandra | 3.7 | 14.8 | – | 5 | |
| XMM | 1.480.07 | 2.81.2 | 13080 | 6 | ||
| SAX | 2.2 | 2.9 | 675 | 3 | ||
| NGC 3660 | ASCA | 2.3 | 3 | – | 7 | |
| NGC 3941 | XMM | 0.04 | 10 | – | 8 | |
| NGC 4579 | Chandra | 5.2 | – | – | 9 | |
| XMM | 3.85 | 2 | 17050 | 8 | ||
| XMM | 3.82 | 3 | 106 | 10 | ||
| NGC 4594 | XMM | 1.3 | 18 | 296 | 11 | |
| NGC 4565 | Chandra | 0.22 | 256 | – | 12 | |
| XMM | 0.24 | 124 | – | 8 | ||
| NGC 4698 | Chandra | 0.013 | 5 | – | 13 | |
| XMM | 0.04 | 40 | – | 8 | ||
| ASCA | 1.04 | 9.5 | 425 | 14 | ||
| NGC 5033 | XMM | 2.87 | 3 | 466215 | 8 | |
| ASCA | 2.6 | 0.27 | – | 15 | ||
| H1320+551 | XMM | 2.1 | 1.69 | 380 | 16 | |
| Mrk 273x | Chandra | 0.1 | 14.1 | 30 | 17 | |
| NGC 5995 | ASCA | 28.9 | 90 | 144 | 3 | |
| NGC 6251 | Chandra | 4.5 | 3 | – | 18 | |
| XMM | 4.0 | 5.1 | 223 | 19 | ||
| ASCA | 1.4 | 75 | 443 | 20 | ||
| IRAS 20051-1117 | Chandra | 1.50.02 | 0.1 | 250155 | 21 | |
| XMM | 1.50.025 | 3 | 360 | 21 | ||
| ASCA | 2.4 | 40 | 272 | 3 | ||
| NGC 7590 | ASCA | 1.2 | 9.2 | – | 22 | |
| NGC 7679 | ASCA | 5.2 | 7.6 | – | 23 | |
| SAX | 6.0 | 2.2 | 180 | 23 | ||
| RXJ1715.4+6239 | XMM | 0.10 | 9 | 250 | 24 | |
| RXJ1724.9+6636 | XMM | 0.11 | 3-12 | 190 | 24 | |
| RXJ1737.0+6601 | XMM | 0.34 | 2 | 240 | 24 | |
| XBSJ031146.1-550702 | XMM | 0.28 | 1.3 | – | 25 | |
| H2004213004.24-430744.2 | XMM | 0.15 | 2 | – | 26 | |
| H2000213115.90-424318.9 | XMM | 0.022 | 9 | – | 26 |
Note. — Col.(1): Sources; Col.(2): The observatory for X-ray data; Col.(3): Observed 2-10 keV fluxes; Col.(4): The HI column density. Col.(5): EW of Fe K line. Col(6): References for X-ray data. Note that the confidence levels for errors and upper-limits are generally between 68% and 90%.
References: 1–Georgantopoulos et al. (2003a); 2–Georgantopoulos (2000); 3–Panessa & Bassani (2002); 4–Corral et al. (2005); 5–Terashima & Wilson (2003); 6–Bianchi et al. (2008a); 7–Brightman & Nandra (2008); 8–Cappi et al. (2006); 9–Eracleous et al. (2002); 10–Dewangan et al. (2004); 11–Pellegrini et al. (2003); 12–Chiaberge et al. (2006); 13–Georgantopoulos & Zezas (2003b); 14–Pappa et al. (2001); 15–Shinozaki et al. (2006); 16–Barcons et al. (2003); 17–Xia et al. (2002); 18–Evans et al. (2005); 19–Gliozzi et al. (2004); 20–Sambruna et al. (1999); 21–Georgantopoulos et al. (2004); 22–Bassani et al. (1999); 23–Della Ceca et al. (2001); 24–Wolter et al. (2005); 25–Caccianiga et al. (2004); 26–Panessa et al. (2009)
| sources | IRS MODE | ||
|---|---|---|---|
| [mJy] | [mJy] | ||
| (1) | (2) | (3) | (4) |
| IRAS 00317-2142 | STARE | – | – |
| IRAS 01428-0404 | – | – | – |
| Mrk 993 | STARE | 11 | 41.1 |
| NGC 3147 | STARE | 30.5 | 84.0 |
| NGC 3660 | MAP | 1.1 | 33.2 |
| NGC 3941 | STARE | 2.2 | 14.5 |
| NGC 4565 | STARE | 17.8 | 47.9 |
| NGC 4579 | MAP | 14.8 | 69.5 |
| NGC 4594 | MAP | 2.2 | 24.9 |
| NGC 4698 | STARE | 1.7 | 4.6 |
| NGC 5033 | MAP | – | 33.8 |
| H1320+551 | – | – | – |
| Mrk 273x | – | – | – |
| NGC 5995 | MAP | 191.7 | 337.6 |
| NGC 6251 | STARE | 18.2 | 50.3 |
| IRAS 20051-1117 | – | – | – |
| NGC 7590 | MAP | – | 22.7 |
| NGC 7679 | STARE | – | – |
| RXJ 1715.4+6239 | – | – | – |
| RXJ 1724.9+6636 | – | – | – |
| RXJ 1737.0+6601 | STARE | 2.0 | 6.8 |
| XBSJ031146.1-550702 | – | – | – |
| H2004 213004.24-430744.2 | – | – | |
| H2000 213115.90-424318.9 | – | – |
Note. — Col.(1): Sources. Col.(2): The IRS observation mode. Col.(3): The nuclear flux density within IRAS 12 m filter after subtracting the stellar atmospheric and star-formation emission. The associated error is dominated by that of the star-formation component derived from the aromatic flux and is estimated to be 50% (Shi et al., 2007). Col.(4): The nuclear flux density within the MIPS 24 m filter. The uncertainty is also dominated by the aromatic-derived star-formation component and is about 50%.
| source | Type 1 | Compton-thick | ||
|---|---|---|---|---|
| 1 | EW(FeK)1 KeV | |||
| (1) | (2) | (3) | (4) | (5) |
| IRAS 00317-2142 | Y | |||
| Mrk 993 | Y | |||
| NGC 3660 | Y | |||
| NGC 3941 | N | - | - | Y |
| NGC 4565 | Y | N | N | Y |
| NGC 4579 | Y | N | N | N |
| NGC 4698 | N | Y | N | Y |
| NGC 5033 | Y | |||
| NGC 6251 | Y | |||
| H1320+551 | Y | N | N | - |
| Mrk 273x | N? | N | N | - |
| NGC 5995 | Y | N | N | N |
| IRAS 20051-1117 | Y | |||
| NGC 7679 | Y | |||
| RXJ 1715.4+6239 | ? | |||
| RXJ 1724.9+6636 | ? | |||
| RXJ 1737.0+6601 | Y | |||
| XBSJ031146.1-550702 | Y | - | - | - |
| H2004 213004.24-430744.2 | Y | |||
Note. — Col.(1): Sources. Col.(2): ′Y′ indicates the type 1 classification while ′N′ is for type 2. ′?′ indicates low S/N for the optical spectra. Col.(3)-Col.(5): Compton-thick objects with solid type 2 classifications are marked as ′Y′. A ′-′ is for the cases with no available data.
| sources | Type | Chandra | SIMU. | 10-20m | PBEL | Ref. | Log | Log | Ref | VX–ray | Ref | VUV | Ref |
|---|---|---|---|---|---|---|---|---|---|---|---|---|---|
| (1) | (2) | (3) | (4) | (5) | (6) | (7) | (8) | (9) | (10) | (11) | (12) | (13) | (14) |
| IRAS 01428-0404 | S2 | – | 41.99 | 7.3 [] | 3 | ||||||||
| NGC 3147 | S2 | Y | Y | Aromatic | N | 1 | 43.29 | 8.4 [] | 4 | ||||
| NGC 4594 | L2 | Sil. Emi. | 41.01 | 8.3 [] | 6 | N | 10 | Y | 13 | ||||
| NGC 7590 | S2 | Aromatic | N | 2 | 41.19 | 6.79 [] | 8 | ||||||
| H2000 213115.90-424318.9 | S2 | Y | – |
Note. — Col.(1): Sources. Col.(2): Optical AGN type. Col.(3): ’Y’ indicates that there is Chandra observation. Col.(4): ’Y’ indicates the X-ray and optical observation are taken simultaneously. Col.(5): the spectral feature at 10-20 m. Col.(6): The presence of polarized broad emission line (PBEL). Col.(7): The references for the PBEL. Col.(8): The bolometric luminosity in erg s-1. Col.(9): The black hole mass in M⊙ corrected to the distance adopted in this paper. ’’ indicates the BH mass based on the bulge mass. ’’ indicates the BH mass based on the stellar velocity dispersion. ’H’ indicates the BH mass using the H emission line. ’DYN.’ indicates the BH mass calculated through a dynamical model. Col.(10): The references for BH masses. Col.(11): The variability in X-ray. Col.(12): References for X-ray variability. Col.(13): The variability in UV. Col.(14): References for UV variability.
References: 1 - This work; 2 - Heisler et al. (1997); 3 - Wang & Zhang (2007); 4 - Dong & De Robertis (2006); 5 - Wang & Zhang (2007); 6 - Dong & De Robertis (2006); 7 - Ferrarese & Ford (1999); 8 - Bian & Gu (2007); 9 – Eracleous et al. (2002); 10- Pellegrini et al. (2003); 11- Gliozzi et al. (2004); 12– Maoz et al. (2005); 13– Maoz et al. (2005); 14– Evans et al. (2005)
| Freq. | Flux | Ref. |
|---|---|---|
| [Hz] | [erg s-1 cm-2] | |
| 1.63E+09 | 9.78E-17 | Krips et al. (2007) |
| 1.70E+09 | 1.14E-16 | Anderson et al. (2004) |
| 2.30E+09 | 1.50E-16 | Anderson et al. (2004) |
| 4.99E+09 | 4.64E-16 | Krips et al. (2007) |
| 5.00E+09 | 4.20E-16 | Anderson et al. (2004) |
| 8.40E+09 | 7.48E-16 | Anderson et al. (2004) |
| 1.54E+10 | 1.25E-15 | Anderson et al. (2004) |
| 2.22E+10 | 1.86E-15 | Anderson et al. (2004) |
| 4.32E+10 | 4.54E-15 | Anderson et al. (2004) |
| 9.99E+10 | 5.30E-15 | Krips et al. (2006) |
| 3.00E+11 | 8.40E-15 | Krips et al. (2006) |
| 1.25E+13 | 1.69E-11 | This-work |
| 2.50E+13 | 8.89E-12 | This-work |
| 1.45E+18 | 3.70E-12 | Terashima & Wilson (2003) |
| Freq. | Flux | Ref. |
|---|---|---|
| [Hz] | [erg s-1 cm-2] | |
| 1.50E+10 | 1.50E-14 | Hummel et al. (1984) |
| 1.25E+13 | 3.00E-12 | This-work |
| 2.50E+13 | 3.24E-13 | This-work |
| 9.09E+14 | 5.05E-13 | Maoz et al. (2005) |
| 1.20E+15 | 1.88E-13 | Maoz et al. (2005) |
| 3.02E+17 | 5.50E-13 | Pellegrini et al. (2003) |
| 1.45E+18 | 1.30E-12 | Pellegrini et al. (2003) |