Black holes regulate cold gas accretion in massive galaxies
Abstract
Nearly every massive galaxy contains a supermassive black hole (BH) at its center[1]. For decades, both theory and numerical simulations have indicated that BHs play a central role in regulating the growth and quenching of galaxies[2]. Specifically, BH feedback by heating or blowing out the interstellar medium (ISM) serves as the groundwork for current models of massive galaxy formation[3, 4, 5, 6]. However, direct evidence for such an impact on the galaxy-wide ISM from BHs has only been found in some extreme objects[7]. For general galaxy populations, it remains unclear whether and how BHs impact the ISM. Here based on a large sample of nearby galaxies with measurements of masses of both black holes and atomic hydrogen, the major component of cold ISM, we reveal that the atomic hydrogen content () is tightly and anti-correlated with black hole mass () with (). This correlation is valid across five orders of magnitude in . Once this correlation is taken into account, loses dependence on other galactic parameters, demonstrating that serves as the primary driver of . These findings provide critical evidence for how the accumulated energy from BH accretion impacts galaxy-wide ISM, representing a crucial step forward in our understanding on the role of BHs in regulating the growth and quenching of massive galaxies.
1.2 {affiliations}
School of Astronomy and Space Science, Nanjing University, Nanjing, Jiangsu 210093, China
Key Laboratory of Modern Astronomy and Astrophysics, Nanjing University, Ministry of Education, Nanjing 210093, China
AIM, CEA, CNRS, Université Paris-Saclay, Université Paris Diderot, Sorbonne Paris Cité, F-91191 Gif-sur-Yvette, France
Kavli Institute for Astronomy and Astrophysics, Peking University, Beijing 100871, China
Department of Astronomy, School of Physics, Peking University, Beijing 100871, China
Shanghai Key Lab for Astrophysics, Shanghai Normal University, 200234, Shanghai, China
Shanghai Astronomical Observatory, Chinese Academy Of Sciences, Shanghai, China
Tianjin Astrophysics Center, Tianjin Normal University, Tianjin 300387, China
During the past few decades, numerous efforts have been dedicated to identifying observational signs of significant impact of BH accretion or Active Galactic Nuclei (AGNs) on gas content and star formation of galaxies[8]. Most of these studies have revealed that the galaxies hosting powerful AGNs are equally gas-rich and actively forming stars as their non-active counterparts, with some of them even more gas-rich and starbursting[9, 10, 11, 12]. This contradicts the conventional feedback models that instant negative AGN feedback is highly efficient in removing cold gas from host galaxies[2]. On the other hand, an increasing amount of evidence indicates that the mass of black holes plays probably the most crucial role in establishing the quiescence of galaxies[13, 14, 15, 16]. These findings indicate that the BH mass (), instead of the instantaneous AGN power, should be the key parameter regulating the growth of galaxies. However, direct observational evidence and the underlying physics on how impact star formation in galaxies remain unclear. Since cold gas is the fuel of star formation, here we tackle this important question by exploring whether there is a direct link between and the cold gas content in galaxies.
Our primary sample comprises of 69 central galaxies in the nearby Universe with direct estimates of BH masses derived from resolved kinematics of stars or gas [17, 18, 19, 14]. We have only included central galaxies to circumvent any environmental impact on the ISM properties of galaxies. The sample encompasses several types of galaxies, including spirals, lenticulars, and ellipticals. We obtained the HI 21-cm emission fluxes, which trace the atomic gas mass , through crossmatching with nearby galaxy databases and HI surveys. Details on the sample selection and derivation of their physical parameters are shown in Methods. A summary of their key properties is presented in Extended Data Table LABEL:etb1.
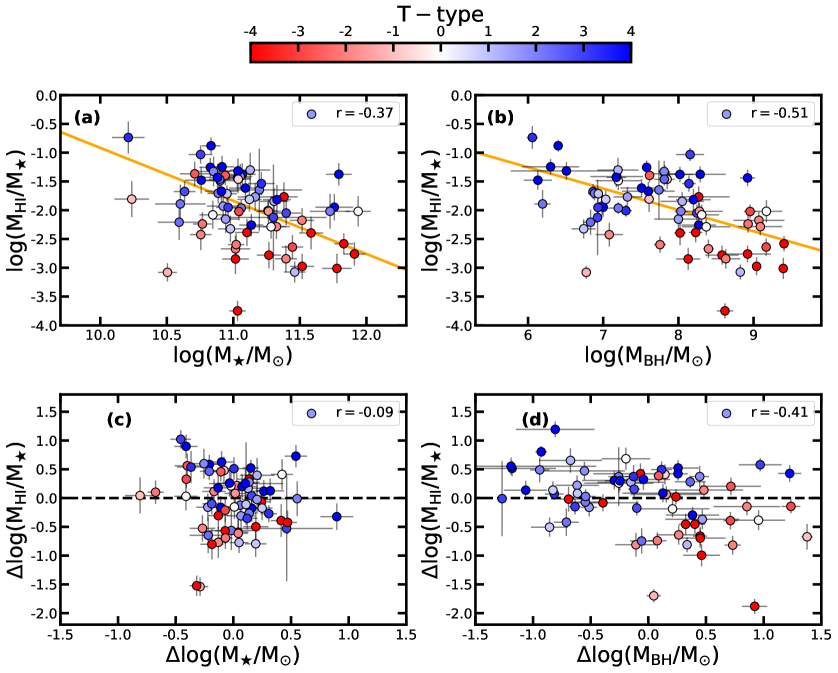
We define the HI gas content as the ratio between the HI mass and the stellar mass represented as = . We first examine the relationship between and BH masses, and compare it with the correlation in Figure 1. The correlation with is found more significant than that with , with a Pearson correlation coefficient of and , respectively. More importantly, the partial correlation between and while controlling for indicates that after removing the correlation of both and with , shows no dependence on ( ). This suggests that the correlation is primarily due to the correlation between and . Additionally, while the correlation differs significantly for early- and late-type galaxies with the early-type galaxies exhibiting systematically lower at fixed , galaxies with different morphologies follow the same relation. This suggests that the low HI content in those early-type galaxies is likely caused by their larger BHs compared to late-type galaxies with similar .
While the tight relation offers direct evidence that BHs play a more crucial role than in regulating , the heterogeneous nature of this sample makes it challenging to determine how the resulting relation could be applicable to broad galaxy populations. To validate this relation with a more representative galaxy sample, we utilized a large sample of galaxies with deep HI observations from the extended GALEX Arecibo SDSS Survey (xGASS [20]) and HI-MaNGA surveys [21]. The sample represents the deepest HI view for a statistical and unbiased galaxy sample in the nearby Universe. The depth of the survey also allows for stringent constraints on the upper limits for the HI non-detections (Methods, Extended Data Figure 1), enabling a comprehensive assessment of the HI content for the entire sample. We start with only selecting group central galaxies, which include at least one satellite galaxy in their groups. Isolated central galaxies lacking any satellites within their groups are discarded because many of them were likely stripped from previous cluster-like environments and have probably suffered from additional environmental effects [22]. Our final sample comprises 572 group central galaxies spanning a broad range of stellar masses, . 365 of them are detected in HI with HI upper limits available for the remaining 207 sources (Methods). Hereafter we will call this xGASS and HI-MaNGA sample “the galaxy sample”, while we call the sample with directly measured “the BH sample”.
The BH masses for the galaxy sample are derived by applying the relation among , K-band luminosity (), and half-light radius () (see Methods). Ref [19] shows that this correlation has similar scatter as the correlation ( dex) based on a large sample of galaxies with direct measurements. In addition, the same relation appears to be valid for both early- and late-type galaxies [19]. For simplicity, we take this relation to derive for the whole galaxy sample.
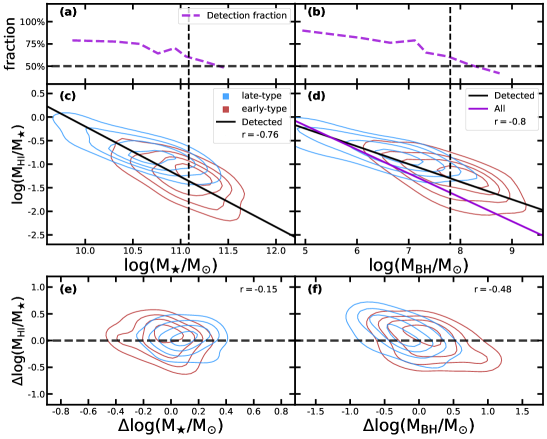
The and relations for the HI-detected galaxy sample are displayed in Figure 2. Although both and are found tightly correlated with for the HI-detected sample (partly due to the derivation of involves or ), the partial correlation analysis suggests that the correlation almost disappears when controlling for . This further supports that the correlation is mostly driven by the and correlation. In addition, similar to the BH sample, while the relation show large differences for these two different classes of galaxies, the relation for early- and late-type galaxies appears to be not significantly different.
Since the HI-detection fraction is a strong function of both and , the relations obtained based on only HI-detections are biased. In order to obtain the inherent scaling relation, we take advantage of the galaxy sample with its effective control of non-detections, and fit the scaling relation encompassing both HI-detections and non-detections. The non-detection rates stay minimal at low , only becoming significant () at . As a result, the best-fitted relation, incorporating the non-detections, results in a steeper slope () than that derived from fitting HI-detections exclusively (see detailed fitting methods in Methods). We summarize these fitting results in Extended Data Table LABEL:etb2.
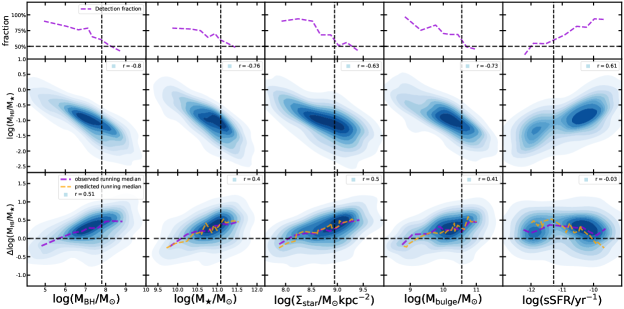
Based on the derived inherent relation, we explore further the impact of this relation on the correlations between and other major galactic parameters[23], including stellar surface densities (), bulge masses (), and specific star formation rates (sSFR), to determine if is the key parameter in determining in galaxies. Figure 3 first compares the correlation among fHI, , , , , and sSFR. As expected, significant correlations exist between fHI and all these parameters for the HI-detected galaxy sample. However, after removing the dependence on based on the inherent relation, the residual in () shows much weaker correlation with the other parameters. Next we further demonstrate that this remaining weak correlation is largely due to the observational biases in the HI-detected galaxy sample, and the fact that is strongly correlated with the other parameters.
Based on the linear relations between and the other parameters, we can convert the running median in the relation (the cycan line in the bottom left panel in Figure 3) into an expected linear relation between and the other parameters. Remarkably, these derived linear relations turns out to be nearly identical with the observed running median relation. These findings demonstrate that the correlation serves as the most fundamental relation in determining , and the other correlations is largely driven by the fact those parameters are tightly correlated with . The same conclusion can also be verified by the partial correlation analysis for the HI-detected galaxy sample, which yields a running median consistent with zero in most correlations when controlling for (Extended Data Figure 2). It is also verified that using a different conversion method for has no impact on our primary findings (Methods, Extended Data Figure 3).
Given that , , and are all highly correlated, as a further test on the fundamental role of in driving the correlation with fHI, we conduct a Partial Least Squares Regression (PLS) between fHI and the parameter set of , , and for the HI-detected galaxy sample and the BH sample (Methods). The PLS algorithm generalize a few latent variables (or principal components) that summarize the variance of independent variables, which is used to find the fundamental relation between a set of independent and dependent variables. Through various tests, we have determined that the optimal number of latent variables for both the BH and the galaxy sample converge to one, and dominants the variance of (Extended Data Table LABEL:etb3 ). Further increasing the number of latent variables only results in few percents change in mean squared errors, and remains the most significant predictor parameter.
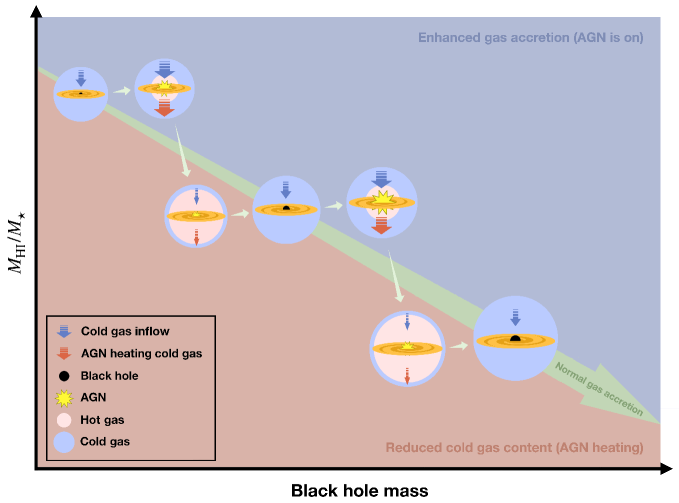
Since is proportional to the integrated energy of BHs across their accretion history, our findings offer one of the first observational proof that the accumulated energy from BHs is vital in regulating the accretion and/or cooling of cold gas in galaxies. The fundamental physics behind this relation has been advocated for several decades. The immense energy released from the accretion of SMBHs in massive galaxies is well known to be comparable to or even greater than the binding energy of host galaxies, which is anticipated to significantly impact the accretion/cooling of the ISM. Since the stellar mass of galaxies is closely linked with the the inner halo binding energy (total binding energies within effective radii of galaxies) [24], , the relation means , where represents the binding energy of the inner dark matter halo [24]. At the stellar mass range probed by our BH sample, , which is close to the value of , yielding with .
The analysis above indicates that the HI mass in galaxies is determined by the relative strength between the binding energy of the halo and the energy released from BHs (). The binding energy of the halo determines how much gas can be accreted onto the dark matter halo, while the energy from BHs heats up the gas, preventing it from further cooling. The contest between the two determines how much accreted gas can be eventually cooled and settled down onto the central galaxies. For such a mechanism to be effective, a negative feedback loop involves gas accretion/cooling and BH accretion/feedback would be required. The fact that the accreted cold gas could feed both star formation and BH accretion makes this possible. When cold gas accretion/cooling is elevated, stronger BH accretion is also triggered, resulting in more energy ejected into the ISM which inhibits further cooling/accretion of the cold gas. This eventually brings down the cold gas content (and also the BH accretion rates). Conversely, a lower cold gas content would generally lead to weaker BH accretion with less energy ejection into the ISM, which will facilitate further cold gas accretion/cooling and increase until it reaches the average relation. This proposed mechanism reconciles the discrepancy between the absence of strong instantaneous negative AGN feedback and the tight correlation between with galaxy quiescence.
By demonstrating the key role of BH masses in driving the HI gas content in galaxies, we present evidence of how the accumulated energy from BH accretion regulates the cooling/accretion of cold gas in host galaxies. Since cold gas is the material of star formation, these findings also shed critical light on the intimate connection between the presence of massive black holes and quiescence of galaxies. For instance, it explains well why most quiescent galaxies are only present at high BH masses, typically with [13, 14, 15, 16], resulting in naturally low levels of cold gas, hence minimal star formation rates. This scenario is also consistent with empirical models indicating that the contest between dark matter halos and BHs governs quenching of star formation in galaxies based on various observed galactic scaling relations[25].
Although current studies has been confined to galaxies in the local Universe, the strong correlation across all redshifts between the quiescence of a galaxy and a prominent bulge or a high central stellar density[26, 27], both of which suggest a large BH, implies that the same scenario may be applied to galaxies at high redshifts as well. Next-generation facilities, such as the Square Kilometer Array and next-generation Very Large Array, would be required to confirm this.
0.1 Cosmology.
We adopted a Chabrier initial mass function (IMF)[28] to estimate star formation rate (SFR) and assumed cosmological parameters of = 70 km s-1 Mpc-1, = 0.3, and = 0.7. When necessary, data from the literature has been converted with conversion factor of M∗ (Salpeter IMF)[29] = 1.7 M∗ (Chabrier IMF) [28].
0.2 Sample selection:
0.3 The BH sample
The sample for galaxies with directly measured BH masses is primarily from Ref[14], which includes 91 central galaxies collected from Ref[18, 19, 17]. We excluded 18 sources with BH masses measured with reverberation mapping and only kept those measured with dynamical methods. We then added another 63 galaxies with measured BH masses from recent literature, which were matched with the group catalog [30] of nearby galaxies to select only central galaxies. We obtained the HI flux densities/masses of this sample by crossmatch with the well known nearby galaxy database, HyperLeda [31]. Our final sample includes 69 central galaxies with 41 from Ref[14] and the remaining from the compilation of recent literature. In table LABEL:etb1, we list the basic properties of our BH sample.
0.4 The galaxy sample
The sample for galaxies with HI measurements and indirect BH mass measurements are from the extended GALEX Arecibo SDSS Survey (xGASS [20]) and HI-MaNGA programme [32, 21], which include HI observations towards a representative sample of 1200 and 6000 galaxies with , respectively. We limited the redshift to ensure a high HI-detection rates even at the highest stellar masses and BH masses. We only selected group central galaxies based on the crossmatch with the group catalogue [33, 34] .
We derived the BH masses for the xGASS and HI-MaNGA sample with their K-band luminosity () and K-band effective radius () from apparent magnitudes () and sizes () in 2MASS All-Sky Extended Source Catalog after applying corrections in Ref [19], motivated by the tight relation from previous studies. We obtained BH masses for the galaxy sample based on the relation in Ref [19]
| (1) |
0.5 Physical parameters of the BH and galaxy sample:
0.6 Stellar masses
We derived the stellar masses of the BH and galaxy sample using the same method as in Ref [19], to avoid systematics in the comparison. Basically, was determined by the total K-band luminosity and velocity dispersion-dependent K-band mass-to-light ratio:
| (2) |
Since an accurate determination of is only available for a small number of galaxies, we derived for the full sample from the tight correlation in Ref [19]:
| (3) |
0.7 HI fraction and upper limits
The HI detection limit depends not only the sensitivity but also the width of the HI line. To obtain more realistic upper limits, we first derived the expected HI line width for each HI non-detections. The width of the HI line indicates the circular velocity of the host galaxy, which should be proportional to the stellar masses. We explored this using the HI detections from the xGASS sample. Extended Data Figure 1 shows the relation between and the observed line width, as well as and inclination-corrected line width. It indicates that the inclination-corrected line width is tightly correlated with , which is further used to derive expected line width for the HI non-detections. Combining the sensitivity of the HI observations and the expected line width, we derived the upper limits for all the HI non-detections in our BH and galaxy samples.
0.8 Morphological T-types
The morphology indicator T is obtained from the HyperLEDA database [31]. It can be a non integer since for most objects the final T is averaged over various estimates available in the literature.
0.9 star formation rates
The specific star formation rates of galaxy sample are from MPA-JHU catalogue based on Ref [35].
0.10 Bulge masses
0.11 Linear Least-squares approximation
We implemented linear regression for BH sample using python package LTS_LINEFIT introduced in Ref [38], which is insensitive to outliers and can give the intrinsic scatter around the linear relation. For galaxy sample, we implemented orthogonal distance regression with Python scipy.odr package.
0.12 Linear fitting including upper limits
To incorporate both detections and upper limits in the galaxy sample, we applied the Kaplan-Meier (KM) non-parametric estimator to derive the cumulative distribution function (CDF) at different bins, and estimated the median value as well as the associated confidence level at each bin. The relation between and is derived via fitting the medians. The non-detection rate of HI is relatively low across most of the range and only becomes significant for galaxies with the most massive BHs (reaching at ).
0.13 Partial least square (PLS) regression
To derive the most significant physical parameters in determining statistically, we utilized Python package Scikit-learn [39] with PLS Regression function, which implement non-linear iterative partial least squares (NIPALS) [40] algorithm. The PLS analysis has advantages in regression among highly-correlated predictor variables. It calculates the linear combinations of the original predictor datasets (latent variables) and the response datasets with maximal covariance, then fits the regression between the projected datasets and returns the model:
| (4) |
where and are predictor and response datasets, is the matrix of regression coefficients and is the intercept matrix.
We constructed and matrix as the set of , , , and the set of . For BH and galaxy sample, this returns the sample size of 45 and 253 respectively. The optimal number of latent variables (linear combinations of predictor variables) in PLS Regression are determined by the minimum of mean squared error from cross-validation (utilize function cross_val_predict in Scikit-learn) at each number of components. We find that the optimal number of latent variables for both the BH and the galaxy sample converges to one. Further increasing the number of latent variables only yields few percents changes in mean squared errors, and remains the most significant predictor parameter. Following appendix B in Ref [41], the variance contribution from different parameters to is decomposed as:
| (5) |
where Var is a measure of the spread of a distribution. The portion of each parameter variance is shown in the last column of the Extended Data Table LABEL:etb3, which clear shows that dominates the variance.
0.14 The f relation with derived from different conversion for early- and late-type galaxies
Galaxy sample were separated into the early and late types based on their Sérsic index from NASA-Sloan Atlas catalog. We obtained from relation as Ref [19] and calibrated this relation using MaNGA IFU data [42]. We limited galaxies in MaNGA and our galaxy sample close to face-on, with K-band axis ratio , as velocity dispersion estimation for edge-on galaxies is prone to large uncertainties. The velocity dispersion from best-fit relation for early- and late-type galaxies:
| (6) |
were then adopted to derive [19]:
| (7) |
and (Eq.2) for our galaxy sample.
![[Uncaptioned image]](/html/2311.07653/assets/x5.png)
![[Uncaptioned image]](/html/2311.07653/assets/x6.png)
![[Uncaptioned image]](/html/2311.07653/assets/x7.png)
| Name | RA | DEC | Distance | log | log | log * | log ** |
|---|---|---|---|---|---|---|---|
| (deg) | (deg) | (Mpc) | (log ) | (log ) | (log ) | (log ) | |
| Centaurus-A | 201.3672 | -43.0181 | [17] | [17] | |||
| Circinus | 213.2913 | -65.3392 | [43] | [17] | |||
| IC1459 | 344.2942 | -36.4622 | [43] | [17] | |||
| IC1481 | 349.8546 | 5.9062 | [17] | [17] | |||
| M31 | 10.6847 | 41.2690 | [43] | [17] | |||
| M66 | 170.0625 | 12.9916 | [19] | [19] | |||
| M81 | 148.8882 | 69.0653 | [43] | [17] | |||
| NGC0315 | 14.4537 | 30.3524 | [19] | [19] | |||
| NGC0613 | 23.5758 | -29.4184 | [19] | [19] | |||
| NGC1023 | 40.0999 | 39.0633 | [43] | [17] | |||
| NGC1068 | 40.6697 | -0.0133 | [43] | [17] | |||
| NGC1097 | 41.5796 | -30.2750 | [19] | [19] | |||
| NGC1194 | 45.9546 | -1.1037 | [43] | [17] | |||
| NGC1320 | 51.2029 | -3.0423 | [19] | [19] | |||
| NGC1332 | 51.5718 | -21.3353 | [43] | [17] | |||
| NGC1358 | 53.4154 | -5.0895 | [19] | [19] | |||
| NGC1398 | 54.7171 | -26.3378 | [43] | [43] | |||
| NGC1497 | 60.5283 | 23.1329 | [19] | [19] | |||
| NGC1667 | 72.1549 | -6.3198 | [19] | [19] | |||
| NGC1961 | 85.5200 | 69.3787 | [19] | [19] | |||
| NGC2179 | 92.0092 | -21.7467 | [19] | [19] | |||
| NGC2273 | 102.5361 | 60.8457 | [43] | [17] | |||
| NGC2787 | 139.8268 | 69.2033 | [43] | [17] | |||
| NGC2911 | 143.4421 | 10.1525 | [19] | [19] | |||
| NGC2960 | 145.1516 | 3.5770 | [43] | [17] | |||
| NGC2974 | 145.6386 | -3.6989 | [19] | [19] | |||
| NGC3079 | 150.4917 | 55.6800 | [19] | [19] | |||
| NGC3081 | 149.8730 | -22.8263 | [19] | [19] | |||
| NGC3115 | 151.3081 | -7.7185 | [43] | [17] | |||
| NGC3227 | 155.8775 | 19.8650 | [43] | [17] | |||
| NGC3368 | 161.6904 | 11.8199 | [43] | [17] | |||
| NGC3379 | 161.9567 | 12.5816 | [43] | [17] | |||
| NGC3393 | 162.0977 | -25.1620 | [43] | [17] | |||
| NGC3414 | 162.8176 | 27.9750 | [19] | [19] | |||
| NGC3489 | 165.0774 | 13.9012 | [43] | [17] | |||
| NGC3504 | 165.7968 | 27.9723 | [44] | [44] | |||
| NGC3801 | 175.0707 | 17.7279 | [19] | [19] | |||
| NGC3992 | 179.3999 | 53.3745 | [19] | [19] | |||
| NGC3998 | 179.4839 | 55.4536 | [43] | [17] | |||
| NGC4151 | 182.6360 | 39.4058 | [19] | [19] | |||
| NGC4203 | 183.7709 | 33.1973 | [19] | [19] | |||
| NGC4258 | 184.7399 | 47.3039 | [43] | [17] | |||
| NGC4303 | 185.4784 | 4.4738 | [19] | [19] | |||
| NGC4388 | 186.4448 | 12.6621 | [43] | [17] | |||
| NGC4472 | 187.4445 | 7.9997 | [43] | [17] | |||
| NGC4501 | 187.9971 | 14.4200 | [43] | [43] | |||
| NGC4507 | 188.9026 | -39.9093 | [19] | [19] | |||
| NGC4594 | 189.9977 | -11.6230 | [43] | [17] | |||
| NGC4636 | 190.7070 | 2.6887 | [19] | [19] | |||
| NGC4699 | 192.2591 | -8.6643 | [43] | [43] | |||
| NGC4736 | 192.7212 | 41.1203 | [43] | [17] | |||
| NGC4826 | 194.1820 | 21.6821 | [43] | [17] | |||
| NGC4945 | 196.3638 | -49.4679 | [17] | [17] | |||
| NGC5005 | 197.7345 | 37.0590 | [19] | [19] | |||
| NGC5018 | 198.2542 | -19.5182 | [43] | [43] | |||
| NGC5055 | 198.9554 | 42.0293 | [19] | [19] | |||
| NGC5127 | 200.9373 | 31.5656 | [19] | [19] | |||
| NGC5248 | 204.3834 | 8.8852 | [19] | [19] | |||
| NGC5252 | 204.5660 | 4.5426 | [19] | [19] | |||
| NGC5495 | 213.0974 | -27.1081 | [19] | [19] | |||
| NGC5695 | 219.3422 | 36.5678 | [19] | [19] | |||
| NGC5728 | 220.5995 | -17.2530 | [19] | [19] | |||
| NGC0584 | 22.8364 | -6.8681 | [45] | [45] | |||
| NGC5846 | 226.6219 | 1.6062 | [19] | [19] | |||
| NGC6240(S) | 253.2453 | 2.4010 | [19] | [19] | |||
| NGC7331 | 339.2673 | 34.4156 | [19] | [19] | |||
| NGC7332 | 339.3521 | 23.7983 | [19] | [19] | |||
| NGC7582 | 349.5962 | -42.3697 | [43] | [17] | |||
| UGC3789 | 109.8787 | 59.3551 | [43] | [17] |
| HI-detected Galaxy sample | All Galaxy sample | BH sample | |
|---|---|---|---|
| k | |||
| b |
| sSFR | Variance(%) | |||||
|---|---|---|---|---|---|---|
| -/- | -0.36/-0.40 | -0.39/-0.65 | -0.25/-0.46 | -0.18/-0.70 | 64.0/63.2 | |
| -0.09/-0.15 | -/- | -0.32/-0.65 | -0.11/-0.33 | -0.47/-0.62 | 7.1/8.2 | |
| -0.39/0.15 | -0.46/-0.40 | -/- | -0.43/-0.29 | -0.27/-0.58 | 13.2/8.3 | |
| -0.11/-0.11 | -0.21/-0.32 | -0.27/-0.49 | -/- | -0.28/-0.55 | 15.7/20.3 | |
| sSFR | 0.42/0.34 | 0.57/0.28 | 0.50/0.56 | 0.54/0.25 | -/- | -/- |
-
The second to fifth columns show the partial correlation coefficients between and each parameter in the first column by controlling the parameters in the first row. The last column shows the variance contribution to in each parameter from PLS Regression between , , , and . The first and second values are for the BH and galaxy sample, respectively.
References
- [1] Ho, L. C. Nuclear activity in nearby galaxies. ARA&A 46, 475–539 (2008). 0803.2268.
- [2] Di Matteo, T., Springel, V. & Hernquist, L. Energy input from quasars regulates the growth and activity of black holes and their host galaxies. Nature 433, 604–607 (2005). astro-ph/0502199.
- [3] Silk, J. & Rees, M. J. Quasars and galaxy formation. A&A 331, L1–L4 (1998). arXiv:astro-ph/9801013.
- [4] Balogh, M. L., Pearce, F. R., Bower, R. G. & Kay, S. T. Revisiting the cosmic cooling crisis. MNRAS 326, 1228–1234 (2001). astro-ph/0104041.
- [5] Cattaneo, A. et al. The role of black holes in galaxy formation and evolution. Nature 460, 213–219 (2009). 0907.1608.
- [6] Fabian, A. C. Observational Evidence of Active Galactic Nuclei Feedback. ARA&A 50, 455–489 (2012). 1204.4114.
- [7] Bîrzan, L., Rafferty, D. A., McNamara, B. R., Wise, M. W. & Nulsen, P. E. J. A Systematic Study of Radio-induced X-Ray Cavities in Clusters, Groups, and Galaxies. ApJ 607, 800–809 (2004). astro-ph/0402348.
- [8] Harrison, C. M. et al. AGN outflows and feedback twenty years on. Nature Astronomy 2, 198–205 (2018). 1802.10306.
- [9] Rosario, D. J. et al. LLAMA: normal star formation efficiencies of molecular gas in the centres of luminous Seyfert galaxies. MNRAS 473, 5658–5679 (2018). 1710.04224.
- [10] Silverman, J. D. et al. The Molecular Gas Content and Fuel Efficiency of Starbursts at z 1.6 with ALMA. ApJ 867, 92 (2018). 1810.01596.
- [11] Shangguan, J., Ho, L. C., Bauer, F. E., Wang, R. & Treister, E. AGN Feedback and Star Formation of Quasar Host Galaxies: Insights from the Molecular Gas. ApJ 899, 112 (2020). 2007.11286.
- [12] Koss, M. J. et al. BAT AGN Spectroscopic Survey. XX. Molecular Gas in Nearby Hard-X-Ray-selected AGN Galaxies. ApJS 252, 29 (2021). 2010.15849.
- [13] Terrazas, B. A. et al. Quiescence Correlates Strongly with Directly Measured Black Hole Mass in Central Galaxies. ApJ 830, L12 (2016). 1609.07141.
- [14] Terrazas, B. A., Bell, E. F., Woo, J. & Henriques, B. M. B. Supermassive Black Holes as the Regulators of Star Formation in Central Galaxies. ApJ 844, 170 (2017). 1707.01097.
- [15] Piotrowska, J. M., Bluck, A. F. L., Maiolino, R. & Peng, Y. On the quenching of star formation in observed and simulated central galaxies: evidence for the role of integrated AGN feedback. MNRAS 512, 1052–1090 (2022). 2112.07672.
- [16] Bluck, A. F. L. et al. The quenching of galaxies, bulges, and disks since cosmic noon. A machine learning approach for identifying causality in astronomical data. A&A 659, A160 (2022). 2201.07814.
- [17] Kormendy, J. & Ho, L. C. Coevolution (Or Not) of Supermassive Black Holes and Host Galaxies. ARA&A 51, 511–653 (2013). 1304.7762.
- [18] Saglia, R. P. et al. The SINFONI Black Hole Survey: The Black Hole Fundamental Plane Revisited and the Paths of (Co)evolution of Supermassive Black Holes and Bulges. ApJ 818, 47 (2016). 1601.00974.
- [19] van den Bosch, R. C. E. Unification of the fundamental plane and Super Massive Black Hole Masses. ApJ 831, 134 (2016). 1606.01246.
- [20] Catinella, B. et al. xGASS: total cold gas scaling relations and molecular-to-atomic gas ratios of galaxies in the local Universe. MNRAS 476, 875–895 (2018). 1802.02373.
- [21] Stark, D. V. et al. H I-MaNGA: tracing the physics of the neutral and ionized ISM with the second data release. MNRAS 503, 1345–1366 (2021). 2101.12680.
- [22] Wang, K., Peng, Y. & Chen, Y. Dissect two-halo galactic conformity effect for central galaxies: the dependence of star formation activities on the large-scale environment. MNRAS 523, 1268–1279 (2023). 2304.06886.
- [23] Saintonge, A. & Catinella, B. The Cold Interstellar Medium of Galaxies in the Local Universe. ARA&A 60, 319–361 (2022). 2202.00690.
- [24] Shi, Y. et al. A universal relationship between stellar masses and binding energies of galaxies. MNRAS 507, 2423–2431 (2021). 2109.00114.
- [25] Chen, Z. et al. Quenching as a Contest between Galaxy Halos and Their Central Black Holes. ApJ 897, 102 (2020). 1909.10817.
- [26] Bell, E. F. et al. What Turns Galaxies Off? The Different Morphologies of Star-forming and Quiescent Galaxies since z ~2 from CANDELS. ApJ 753, 167 (2012). 1110.3786.
- [27] Wang, T. et al. CANDELS: Correlations of Spectral Energy Distributions and Morphologies with Star formation Status for Massive Galaxies at z ~2. ApJ 752, 134 (2012). 1204.4194.
- [28] Chabrier, G. Galactic Stellar and Substellar Initial Mass Function. PASP 115, 763–795 (2003). arXiv:astro-ph/0304382.
- [29] Salpeter, E. E. The Luminosity Function and Stellar Evolution. ApJ 121, 161–+ (1955).
- [30] Lu, Y. et al. Galaxy Groups in the 2Mass Redshift Survey. ApJ 832, 39 (2016). 1607.03982.
- [31] Makarov, D., Prugniel, P., Terekhova, N., Courtois, H. & Vauglin, I. HyperLEDA. III. The catalogue of extragalactic distances. A&A 570, A13 (2014). 1408.3476.
- [32] Masters, K. L. et al. H I-MaNGA: H I follow-up for the MaNGA survey. MNRAS 488, 3396–3405 (2019). 1901.05579.
- [33] Yang, X. et al. Galaxy Groups in the SDSS DR4. I. The Catalog and Basic Properties. ApJ 671, 153–170 (2007). 0707.4640.
- [34] Janowiecki, S. et al. xGASS: gas-rich central galaxies in small groups and their connections to cosmic web gas feeding. MNRAS 466, 4795–4812 (2017). 1701.01754.
- [35] Brinchmann, J. et al. The physical properties of star-forming galaxies in the low-redshift Universe. MNRAS 351, 1151–1179 (2004). astro-ph/0311060.
- [36] Bohn, T., Canalizo, G., Satyapal, S. & Pfeifle, R. W. The Discovery of a Hidden Broad-line AGN in a Bulgeless Galaxy: Keck NIR Spectroscopic Observations of SDSS J085153.64+392611.76. ApJ 899, 82 (2020). 2007.08525.
- [37] Simard, L., Trevor Mendel, J., Patton, D. R., Ellison, S. L. & McConnachie, A. W. VizieR Online Data Catalog: Bulge+disk decompositions of SDSS galaxies (Simard+, 2011). VizieR Online Data Catalog J/ApJS/196/11 (2011).
- [38] Cappellari, M. et al. The ATLAS3D project - XV. Benchmark for early-type galaxies scaling relations from 260 dynamical models: mass-to-light ratio, dark matter, Fundamental Plane and Mass Plane. MNRAS 432, 1709–1741 (2013). 1208.3522.
- [39] Pedregosa, F. et al. Scikit-learn: Machine learning in python (2018). 1201.0490.
- [40] Lindgren, F., Geladi, P. & Wold, S. The kernel algorithm for pls. Journal of Chemometrics (1993).
- [41] Oh, S. et al. The SAMI Galaxy Survey: the difference between ionized gas and stellar velocity dispersions. MNRAS 512, 1765–1780 (2022). 2202.10469.
- [42] Westfall, K. B. et al. The Data Analysis Pipeline for the SDSS-IV MaNGA IFU Galaxy Survey: Overview. AJ 158, 231 (2019). 1901.00856.
- [43] Saglia, R. P. et al. The SINFONI Black Hole Survey: The Black Hole Fundamental Plane Revisited and the Paths of (Co)evolution of Supermassive Black Holes and Bulges. ApJ 818, 47 (2016). 1601.00974.
- [44] Nguyen, D. D. et al. The MBHBM⋆ Project. I. Measurement of the Central Black Hole Mass in Spiral Galaxy NGC 3504 Using Molecular Gas Kinematics. ApJ 892, 68 (2020). 1902.03813.
- [45] Thater, S. et al. Six new supermassive black hole mass determinations from adaptive-optics assisted SINFONI observations. A&A 625, A62 (2019). 1902.10175.
- [46] Makarov, D., Prugniel, P., Terekhova, N., Courtois, H. & Vauglin, I. HyperLEDA. III. The catalogue of extragalactic distances. A&A 570, A13 (2014).
T.W. acknowledges support by National Natural Science Foundation of China (Project No. 12173017, and Key Project No. 12141301), and the China Manned Space Project with No. CMS-CSST-2021-A07.
T.W. initiated the study, led the first discoveries and authored the majority of the text. K.X. enlarged the sample and consolidated the results with more in-depth analysis under the supervision of T.W.. Y.W. helps construct the initial sample. Y.S., D.E., L.H., Z.Z., Q.G., Y.W., C.S., F.Y., X.X. and K.W. contributed to the overall interpretation of the results and various aspects of the analysis.
The authors declare no competing interests.
All data used in this paper are publicly available and we summarize the key physical parameters of the BH sample in Extended Data Table.
All codes used in the paper are publicly available.