A persistent ultraviolet outflow from an accreting neutron star transient
All disc-accreting astrophysical objects produce powerful outflows. In binaries containing neutron stars (NS) or black holes, accretion often takes place during violent outbursts. The main disc wind signatures during these eruptions are blue-shifted X-ray absorption lines, which are preferentially seen in disc-dominated "soft states"[1, 2]. By contrast, optical wind-formed lines have recently been detected in "hard states", when a hot corona dominates the luminosity[3]. The relationship between these signatures is unknown, and no erupting system has revealed wind-formed lines between the X-ray and optical bands yet, despite the many strong resonance transitions in this ultraviolet (UV) region[4]. Here, we show that the transient NS binary Swift J1858.60814 exhibits wind-formed, blue-shifted absorption associated with C iv, N v and He ii in time-resolved UV spectroscopy during a luminous hard state. This represents the first evidence for a warm, moderately ionized outflow component in this state. Simultaneously observed optical lines also display transient blue-shifted absorption. Decomposing the UV data into constant and variable components, the blue-shifted absorption is associated with the former. This implies that the outflow is not connect to the luminous flares in the data. The joint presence of UV and optical wind features reveals a multi-phase and/or stratified outflow from the outer disc[5]. This type of persistent mass loss across all accretion states has been predicted by radiation-hydrodynamic simulations[6] and helps to explain the shorter-than-expected outbursts duration[7].
On October 2018, the Neil Gehrels Swift Observatory (Swift[8]) detected a bright new X-ray binary transient, Swift J1858.60814 (hereafter J1858)[9]. Multi-wavelength observations quickly led to the discovery of radio, optical and near-ultraviolet (UV) counterparts[10, 11, 12]. The detection of thermonuclear runaway explosions in X-rays (Type I X-ray bursts) established that the accreting object is a neutron star located at a distance of about kpc[13]. The system was also found to undergo eclipses, implying a nearly edge-on viewing angle with respect to the disc () and revealing the orbital period to be h[14].
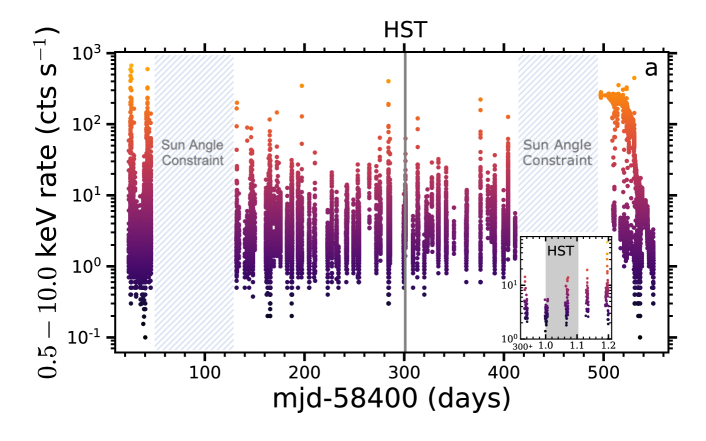
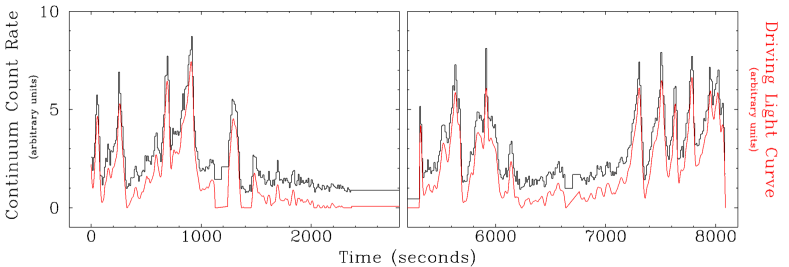
J1858 displayed extreme variability during its outburst in all energy bands, with the X-ray luminosity changing by 1–2 orders of magnitude on time-scales of seconds (see Figure 1-a)[14, 11]. The X-ray spectrum consisted of a heavily absorbed thermal accretion disc component plus a very shallow non-thermal power law tail (photon flux , with ) [15]. Both the peculiar X-ray spectrum and spectacular variability are reminiscent of those seen during the outbursts of the well-studied black-hole X-ray binaries V404 Cyg and V4641 Sgr, which are thought to be a consequence of accretion at super-Eddington rates[16, 17].
In order to shed light on the accretion and outflow processes associated with the outburst, we carried out strictly simultaneous, time-resolved observations across the electromagnetic spectrum on August 6, 2019 around 00 (UTC). One of our primary goals was to search for outflow signatures in the far-ultraviolet (far-UV) band, since this region contains several strong resonance lines that are very sensitive to the presence of warm, moderately-ionized intervening material.Therefore, the timing of this campaign was centered on far-UV spectroscopic observations with the Hubble Space Telescope (HST). Simultaneous optical spectroscopy was obtained at both the Very Large Telescope (VLT) array and the Gran Telescopio de Canarias (GTC). Additional information about the campaign is provided in the Extended Data section.
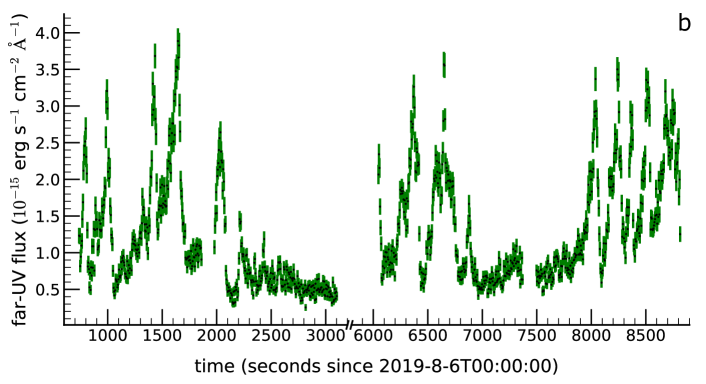
In line with data obtained at other wavelengths[11, 18], the far-UV light curve exhibits dramatic flaring activity (Figure 1-b). The X-ray, far-UV and optical variability are clearly correlated, with any lags between these time series being s (Vincentelli et al. in prep). In agreement with previously reported X-ray light curves[13, 14], there is no evidence of thermonuclear runaway events during the campaign. This suggests that the multi-wavelength flaring is driven by a variable central X-ray source.
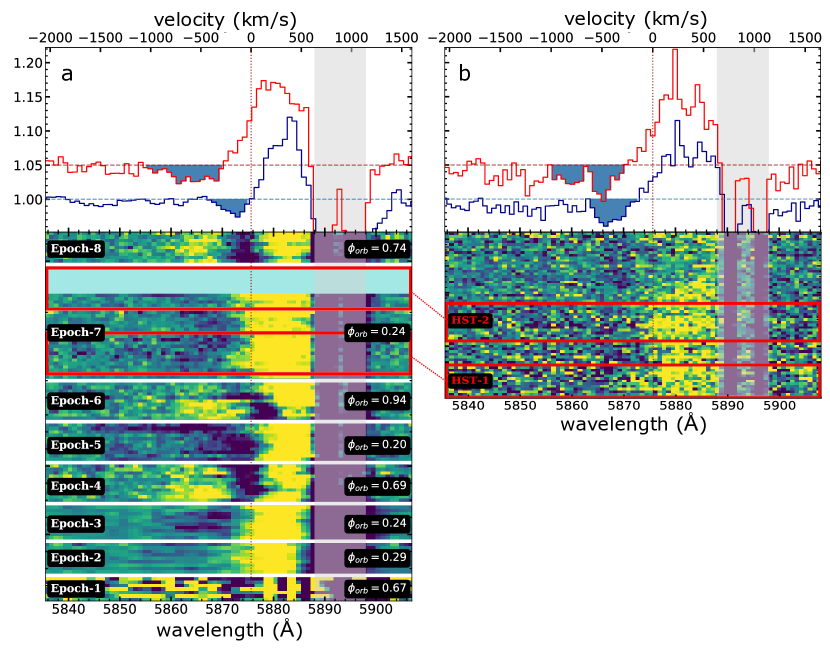
The presence of a large, strongly irradiated accretion disc is the key requirement for a thermally-driven outflow [19, 20, 21], while high inclinations tend to strengthen wind-formed absorption features [1, 6]. All of this makes J1858 an ideal candidate for displaying clear observational outflow signatures. As summarised in the Methods section, X-ray spectroscopy of the source obtained earlier in the same outburst already found tentative evidence for an outflow[22]. Time-resolved optical spectroscopy also revealed clear, but highly variable P Cygni wind features in H and He i 5876 Å during the bright hard state [3] (Figure 2).
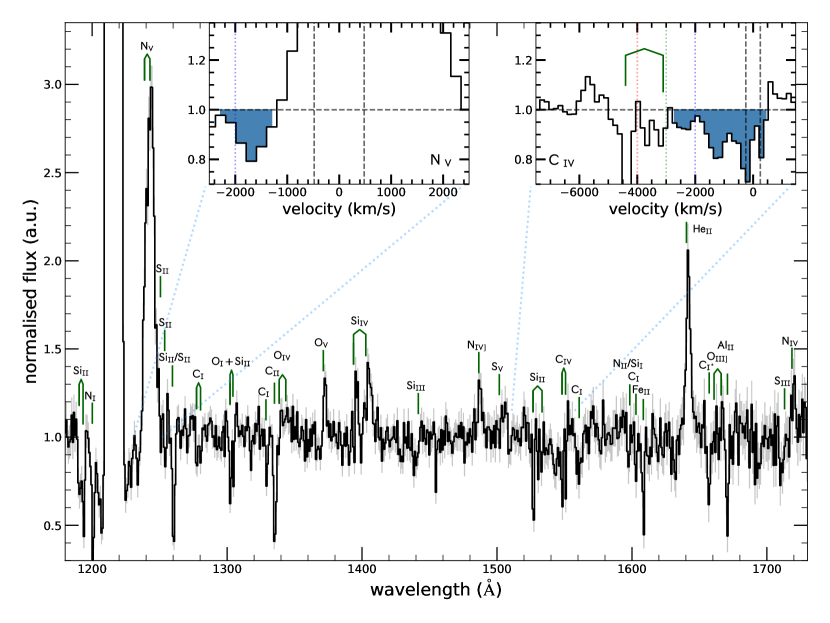
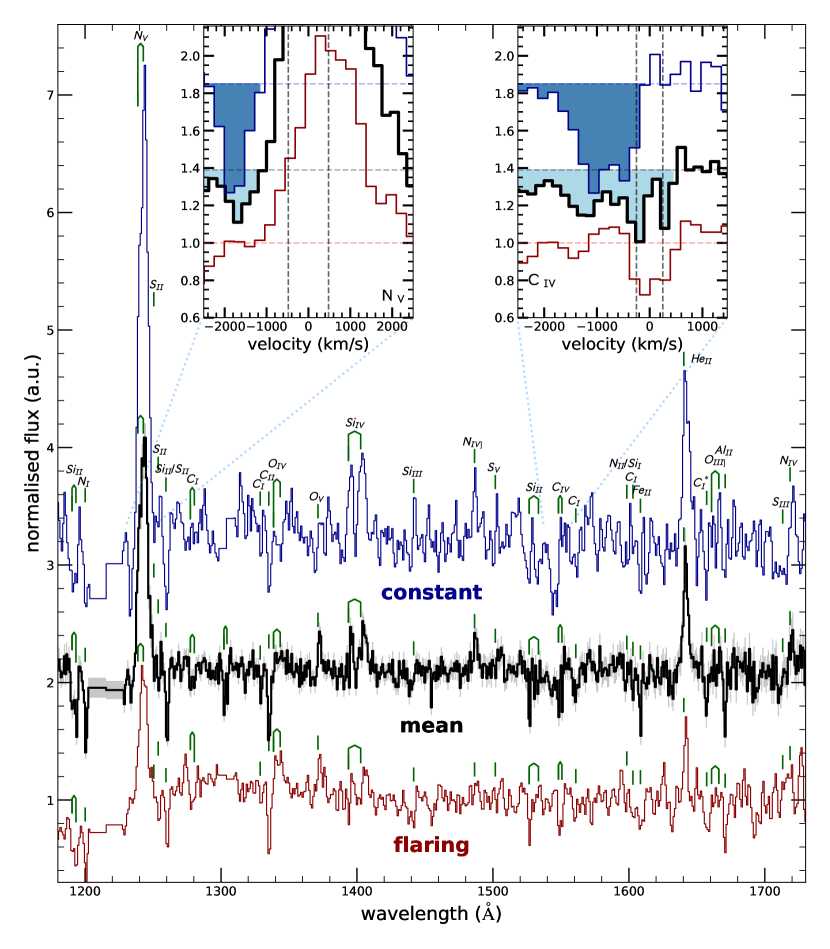
Figure 3 shows the time-averaged far-UV spectrum we obtained with HST in the hard state. The spectrum is rich in both absorption and emission lines that span a wide range of ionization states. Most of the low-ionization absorption lines are centered at or near the rest wavelength of the relevant transition, with most of these lines not being intrinsic to the system but rather due to interstellar absorption along the line of sight. However, at least two emission lines – N v 1240 Å and C iv 1550 Å – show clear evidence for associated blue-shifted absorption. Since these species are associated with temperatures of K, their presence unambiguously establishes the existence of a warm and moderately ionized outflowing component.
Several other transitions – e.g. O v 1370 Å and Si iii 1440 Å – also show tentative evidence for blue-shifted absorption. Moreover, all strong emission lines in the spectrum – which includes the Si iv 1400Å doublet resonance line and the He ii 1640 Å recombination feature – show evidence for a slight red-shift or a red-skew, suggesting that they are also affected by blue-shifted wind absorption.
As shown in the insets of Figure 3, the blue edges of the far-UV absorption features extend up to , similar to the wind speed inferred from the optical data. However, the far-UV absorption troughs are considerably deeper than those in the optical, which rarely fall below of the continuum. This is likely because most of the strong far-UV lines are associated with strongly scattering resonance transitions, whereas the optical features are associated with recombination lines that connect two excited levels. Very high (column) densities are required in order for such recombination lines to produce absorption. On the other hand, sensitivity of far-UV resonance lines to intervening material makes this waveband particularly valuable for studying outflows.
It is important to establish if the far-UV wind signatures are always present or are instead associated with the strong flaring events in the light curve. We have therefore carried out a maximum likelihood linear decomposition of the time-resolved spectroscopy into a constant and a flaring (variable) component. The spectra inferred for the two components are shown in Figure 4; details regarding the decomposition technique are provided in the Methods section. In both N v 1240 Å and C iv 1550 Å, the blue-shifted absorption signature is clearly associated with the constant component. This suggests that either our line of sight to the emitting region responsible for the flaring component does not pass through the warm outflow or that the ionization state of the outflow changes significantly during the flares. Perhaps more importantly, it also suggests that the outflow is, in fact, always present, but that its signatures may sometimes be swamped by the flaring component (in which these signatures are absent). The same effect may be responsible for the transience of the blue-shifted absorption seen in the optical data, especially considering how weak these features are (c.f. Figure 2).
The presence of detectable blue-shifted absorption associated with the UV resonance lines (e.g. N v 1240 Å, C iv 1550 Å) implies that the optical depth in these transitions must be significant. This, in turn, requires minimum column densities for the relevant ions, which can be cast as approximate lower limits on the mass-loss rate carried away by the outflow (see Methods for details). Conservatively assuming ionization fractions of for both and , these limits are for N v 1240 Å and for C iv 1550 Å. The actual ionization fractions may be considerably lower, and the mass-loss rate correspondingly higher.
The apparent time-averaged X-ray luminosity during the flaring hard state in which we observed J1858 was , although individual flares appear to have reached super-Eddington levels [13]. Taken at face value, this corresponds to an average accretion rate in this state of . In this case, , suggesting that the wind is dynamically important and could significantly affect the accretion flow [23, 24], but also see [25]. However, it is also possible that the intrinsic luminosity was much higher throughout this state, with time-variable obscuration being responsible for the reduction in the time-averaged flux (and perhaps also the flaring activity). Such obscuration need not necessarily be associated with the disk wind itself (see Methods)
In the extreme case that , the constraint on the wind efficiency is .
The discovery of optical, UV and (probably) X-ray outflow signatures in the luminous hard state of J1858 suggests that disc winds may always be present in transient X-ray binaries, not just in disc-dominated soft states. Our identification of the constant (non-flaring) spectral component as the carrier of these signatures in the far-UV strongly supports this idea. X-ray and far-UV wind signatures have also been observed in some persistent soft-state X-ray binaries,[26, 27], i.e. systems in which the disc is not subject to the instability that drives the outbursts of transient accretors [28].
The emerging physical picture of disc winds being an integral part of the accretion flows in X-ray binaries is consistent with theoretical modeling of outburst light curves[28, 7]. It is also in line with radiation-hydrodynamical modeling of thermally-driven outflows from X-ray binary discs[29, 30, 6]. These simulations confirm that strong mass loss is inevitable in any systems with a sufficiently large disc subject to strong irradiation, regardless of accretion state[6]. These conditions are met in J1858 (see Methods). A key test of the thermally-driven wind scenario will be to check that wind signatures are absent in systems where these conditions are not met[31].
Regardless of the driving mechanism, two key outstanding questions are where and how these outflows manage to sustain a sufficiently low ionization state to allow the formation of optical and UV lines. The most likely answers are that self-shielding, probably coupled with clumping, protects parts of the dense base of the wind above the outermost disc regions from over-ionization. Indeed, recent hydrodynamical simulations of irradiated discs in active galactic nuclei predict the existence of clumpy, thermally unstable, multi-phase outflows[5]. This mechanism might also be at work in X-ray binaries, but new radiation-hydrodynamic simulations will be needed to confirm this.
References
- [1] Ponti, G. et al. Ubiquitous equatorial accretion disc winds in black hole soft states. \JournalTitleMNRAS 422, L11–L15, DOI: 10.1111/j.1745-3933.2012.01224.x (2012). 1201.4172.
- [2] Homan, J. et al. Evidence for Simultaneous Jets and Disk Winds in Luminous Low-mass X-Ray Binaries. \JournalTitleApJ 830, L5, DOI: 10.3847/2041-8205/830/1/L5 (2016). 1606.07954.
- [3] Muñoz-Darias, T. et al. The Changing-look Optical Wind of the Flaring X-Ray Transient Swift J1858.6-0814. \JournalTitleApJ 893, L19, DOI: 10.3847/2041-8213/ab8381 (2020). 2003.12073.
- [4] Long, K. S. & Knigge, C. Modeling the Spectral Signatures of Accretion Disk Winds: A New Monte Carlo Approach. \JournalTitleApJ 579, 725–740, DOI: 10.1086/342879 (2002). astro-ph/0208011.
- [5] Waters, T., Proga, D. & Dannen, R. Multiphase AGN Winds from X-Ray-irradiated Disk Atmospheres. \JournalTitleApJ 914, 62, DOI: 10.3847/1538-4357/abfbe6 (2021). 2101.09273.
- [6] Higginbottom, N. et al. Thermal and radiation driving can produce observable disc winds in hard-state X-ray binaries. \JournalTitleMNRAS 492, 5271–5279, DOI: 10.1093/mnras/staa209 (2020). 2001.08547.
- [7] Tetarenko, B. E., Lasota, J. P., Heinke, C. O., Dubus, G. & Sivakoff, G. R. Strong disk winds traced throughout outbursts in black-hole X-ray binaries. \JournalTitleNature 554, 69–72, DOI: 10.1038/nature25159 (2018). 1801.07203.
- [8] Gehrels, N. et al. The Swift Gamma-Ray Burst Mission. \JournalTitleApJ 611, 1005–1020, DOI: 10.1086/422091 (2004). astro-ph/0405233.
- [9] Krimm, H. A. et al. Swift reports the detection of a new galactic transient source Swift J1858.6-0814. \JournalTitleThe Astronomer’s Telegram 12151, 1 (2018).
- [10] Bright, J. et al. AMI-LA radio observations of the galactic X-ray transient Swift J1858.6-0814. \JournalTitleThe Astronomer’s Telegram 12184, 1 (2018).
- [11] Vasilopoulos, G., Bailyn, C. & Milburn, J. Swift J1858.6-0814: Localization and variability of the optical counterpart. \JournalTitleThe Astronomer’s Telegram 12164, 1 (2018).
- [12] Kennea, J. A. & Krimm, H. A. Swift J1858.6-0814: Swift XRT and UVOT localization. \JournalTitleThe Astronomer’s Telegram 12160, 1 (2018).
- [13] Buisson, D. J. K. et al. Discovery of thermonuclear (Type I) X-ray bursts in the X-ray binary Swift J1858.6-0814 observed with NICER and NuSTAR. \JournalTitleMNRAS 499, 793–803, DOI: 10.1093/mnras/staa2749 (2020). 2009.03334.
- [14] Buisson, D. J. K. et al. Dips and eclipses in the X-ray binary Swift J1858.6-0814 observed with NICER. \JournalTitleMNRAS 503, 5600–5610, DOI: 10.1093/mnras/stab863 (2021). 2103.12787.
- [15] Ludlam, R. M. et al. Initial NICER observation of the new X-ray transient Swift J1858.6-0814. \JournalTitleThe Astronomer’s Telegram 12158, 1 (2018).
- [16] Motta, S. E. et al. Swift observations of V404 Cyg during the 2015 outburst: X-ray outflows from super-Eddington accretion. \JournalTitleMNRAS 471, 1797–1818, DOI: 10.1093/mnras/stx1699 (2017). 1707.01076.
- [17] Hare, J. et al. NuSTAR Observations of the Transient Galactic Black Hole Binary Candidate Swift J1858.6?0814: A New Sibling of V404 Cyg and V4641 Sgr? \JournalTitleApJ 890, 57, DOI: 10.3847/1538-4357/ab6a12 (2020). 2001.03214.
- [18] van den Eijnden, J. et al. The variable radio counterpart of Swift J1858.6-0814. \JournalTitleMNRAS 496, 4127–4140, DOI: 10.1093/mnras/staa1704 (2020). 2006.06425.
- [19] Begelman, M. C., McKee, C. F. & Shields, G. A. Compton heated winds and coronae above accretion disks. I. Dynamics. \JournalTitleApJ 271, 70–88, DOI: 10.1086/161178 (1983).
- [20] Done, C., Gierliński, M. & Kubota, A. Modelling the behaviour of accretion flows in X-ray binaries. Everything you always wanted to know about accretion but were afraid to ask. \JournalTitleA&ARev 15, 1–66, DOI: 10.1007/s00159-007-0006-1 (2007). 0708.0148.
- [21] Higginbottom, N. & Proga, D. Coronae and Winds from Irradiated Disks in X-Ray Binaries. \JournalTitleApJ 807, 107, DOI: 10.1088/0004-637X/807/1/107 (2015). 1504.03328.
- [22] Buisson, D. J. K. et al. Soft X-ray emission lines in the X-ray binary Swift J1858.6-0814 observed with XMM-Newton Reflection Grating Spectrometer: disc atmosphere or wind? \JournalTitleMNRAS 498, 68–76, DOI: 10.1093/mnras/staa2258 (2020). 2007.14407.
- [23] Muñoz-Darias, T. et al. Regulation of black-hole accretion by a disk wind during a violent outburst of V404 Cygni. \JournalTitleNature 534, 75–78, DOI: 10.1038/nature17446 (2016). 1605.02358.
- [24] Shields, G. A., McKee, C. F., Lin, D. N. C. & Begelman, M. C. Compton-heated Winds and Coronae above Accretion Disks. III. Instability and Oscillations. \JournalTitleApJ 306, 90, DOI: 10.1086/164322 (1986).
- [25] Ganguly, S. & Proga, D. On the Wind-driven Relaxation Cycle in Accretion Disks. \JournalTitleApJ 890, 54, DOI: 10.3847/1538-4357/ab6aa0 (2020). 2001.03791.
- [26] Ioannou, Z. et al. Understanding the LMXB X2127+119 in M 15. II. The UV data. \JournalTitleA&A 399, 211–218, DOI: 10.1051/0004-6361:20021578 (2003). astro-ph/0212127.
- [27] Neilsen, J. et al. A NICER View of a Highly Absorbed Flare in GRS 1915+105. \JournalTitleApJ 902, 152, DOI: 10.3847/1538-4357/abb598 (2020). 2010.14512.
- [28] Dubus, G., Done, C., Tetarenko, B. E. & Hameury, J.-M. The impact of thermal winds on the outburst lightcurves of black hole X-ray binaries. \JournalTitleA&A 632, A40, DOI: 10.1051/0004-6361/201936333 (2019). 1909.13601.
- [29] Luketic, S., Proga, D., Kallman, T. R., Raymond, J. C. & Miller, J. M. On the Properties of Thermal Disk Winds in X-ray Transient Sources: A Case Study of GRO J1655-40. \JournalTitleApJ 719, 515–522, DOI: 10.1088/0004-637X/719/1/515 (2010). 1003.3264.
- [30] Done, C., Tomaru, R. & Takahashi, T. Thermal winds in stellar mass black hole and neutron star binary systems. \JournalTitleMNRAS 473, 838–848, DOI: 10.1093/mnras/stx2400 (2018). 1612.09377.
- [31] Charles, P. et al. Hot, dense He II outflows during the 2017 outburst of the X-ray transient Swift J1357.2-0933. \JournalTitleMNRAS 489, L47–L52, DOI: 10.1093/mnrasl/slz120 (2019). 1908.00320.
Acknowledgments
NCS & CK acknowledge support by the Science and Technology Facilities Council (STFC), and from STFC grant ST/M001326/1. Partial support for KSL’s effort on the project was provided by NASA through grant numbers HST-GO-15984 and HST-GO-16066 from the Space Telescope Science Institute, which is operated by AURA, Inc., under NASA contract NAS 5-26555. NCS thanks Tricia Royle for helping coordinate the time-critical observations in this article. ND acknowledges support from a Vidi grant for the Netherlands Organization for Scientific Research (NWO). JVHS acknowledges support from STFC grant ST/R000824/1. MAP, JC, FJI and TMD acknowledge support from the grant AYA2017-83216-P and PID2020-120323GB-I00. TMD also acknowledges RYC-2015-18148 and EUR2021-122010. TMD and MAP acknowledge support from grants with references ProID2020010104 and ProID2021010132. JM acknowledges a Herchel Smith Fellowship at Cambridge. TDR acknowledge financial contribution from the agreement ASI-INAF n.2017-14-H.0. JvdE is supported by a Lee Hysan Junior Research Fellowship from St Hilda’s College, Oxford. GV acknowledges support by NASA Grants 80NSSC20K1107, 80NSSC20K0803 and 80NSSC21K0213. MÖA acknowledges support from the Newton International Fellowship program from Royal Society. JAC acknowledge from grants PICT-2017-2865 (ANPCyT), PID2019-105510GB-C32/AEI/10.13039/501100011033, FQM-322, as well as FEDER funds.
Author contributions statement
NCS and CK wrote the original proposal, performed the data analysis and wrote the paper with significant feedback from KSL, DA, FMV, SdP, JM and MM. MAP JC FJI and TMD provided the GTC data. JVHS reduced the X-Shooter data and assisted in designing the observations. DJKB and DA provided the X-ray data. DAHB, JAC, VAC, NDD, SdP, MDT, RF, CG, JVHS, MP, MÖA, LR, TDR, JvdE, FMV and PW assisted in proposing and planning the MW observations. All authors contributed to the original proposal, discussed the results and commented on the manuscript.
Author information
Reprints and permissions information is available at www.nature.com/reprints. The authors declare no competing financial interests. All correspondence should be addressed to N.C.S. (N.Castro-Segura@Soton.ac.uk)
Methods
Previous X-ray Spectroscopy
Swift J1858.60814 was observed by XMM–Newton with the Reflection Grating Spectrometer (RGS) during March/April of 2019, a few months before the multi-wavelength campaign discussed in the present paper. A detailed analysis of XMM–Newton/RGS observations has already been presented elsewhere[22], so here we just briefly summarize some relevant results.
As during our campaign, Swift J1858.60814 was in a hard spectral state at the time of the XMM–Newton/RGS observations. In fact, there is no significant difference in the X-ray hardness ratios between the two epochs as seen by the all sky monitoring telescopes MAXI and Swift/BAT.
A search for wind signatures in the X-ray spectrum obtained with the RGS did not reveal any clear blue-shifted absorption features, which would be the "smoking gun" for the presence of outflowing material. However, the N vii emission line is significantly redshifted, which suggests that photons in the blue wing might be scattered out of our line of sight by an outflow. Thus, there is tentative evidence for an X-ray processing wind in the hard state from these observations. Assuming a neutron star with typical mass of , the velocity dispersion observed in this narrow line indicates that the bulk of the emission is originated at from the central source, consistent with the wind being thermally driven discussed bellow.
Finally, the absorbing column density inferred during its soft state is , similar to the galactic extinction in the line of sight[13].
Ultraviolet Spectroscopy
Observations
Swift J1858.60814 was observed under the program GO/DD 15984 with N. Castro Segura as PI on Aug 5, 2019 23:49:20 UT. A total of exposure was obtained in the far-UV with the Cosmic Origin Spectrograph (COS[1]) and the G140L grating using the primary science aperture (PSA). This configuration provides a spectral resolution of . All the observations were obtained in TIME-TAG mode, yielding a stream of detected events at a time resolution of .
Data analysis
We reduced the far-UV data using the HST calcos pipeline111Provided by The Space Telescope Science Institute (https://github.com/spacetelescope). One-dimensional spectra were extracted using the twozone algorithm, which sums over the cross-dispersion direction such that 99% of the flux is extracted at each wavelength. Errors are estimated from Poisson statistics, and the background is modeled with a smooth polynomial and subtracted from the target spectrum. We extracted light curves from the time-tag event files using the same regions defined by the pipeline, except that empirical background correction was directly applied. Regions affected by geocoronal airglow emission associated with ( Å) and O ii ( Å) were masked when extracting the light curves.
Spectral decomposition
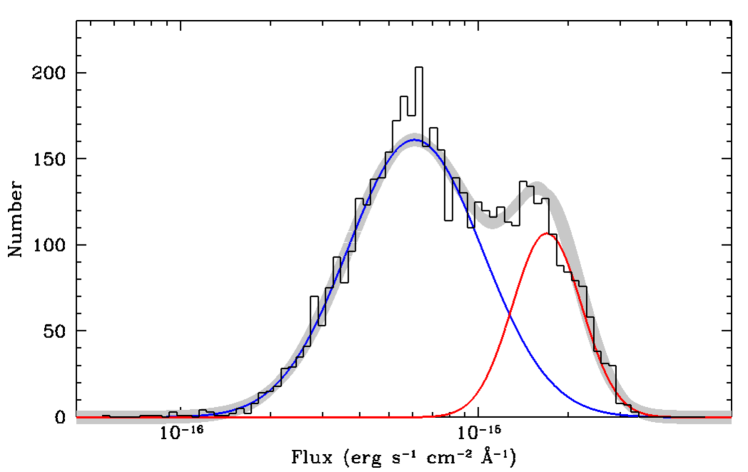
The highly variable far-UV luminosity during our observations gives rise to a strongly bimodal logarithmic flux distribution (Extended Data Figure 1). This is in line with the visual impression from the far-UV light curve that the dominant variability is due to "shots" or "flares" superposed on a roughly constant background (Figure 1-b).
We have isolated the spectra associated with these two components by carrying out a simple linear decomposition of our time-resolved spectroscopic data into a constant and a flaring (variable) component. Following Eracleous & Horne (1996)[2], we assume that the flux density at wavelength and time can be written as
| (1) |
where and are the spectra of the constant and flaring components, respectively. The function is the driving light curve of the flaring component.
In order to estimate , we constructed a far-UV continuum light curve at 10 s time resolution. We then estimated the underlying constant level in this light curve and created a normalized driving light curve from which this estimate was removed. We finally smooth the resulting time series with a 5-point, second-order Savitzky-Golay filter to obtain our estimate of . The result is shown as the red curve in Extended Data Figure 2.
With fixed, the decomposition described by Equation 1 becomes just a series of 2-parameter fits, where is the number of wavelength bins being considered. Since HST/COS uses a photon-counting far-UV detector, the data set actually consists of a time- and wavelength-tagged event stream. Our decomposition is therefore based an unbinned (in time) maximum likelihood fit to the data at the individual photon-event level, since this maximizes the signal-to-noise ratio of the inferred spectral components. The log-likelihood for this model can be derived from Poisson statistics and turns out to be
| (2) |
Here, and are now the count-rates associated with the constant and variable components, and is the total number of photons predicted by the model. We obtain best-fit estimates of and by maximising Equation 2. The flux-calibrated spectra described as constant and flaring components in Figure 4 are then constructed in the usual way, by multiplying by the wavelength-dependent inverse sensitivity curve. Detector regions dominated by background and/or geo-coronal emission are excluded from the fit.
Optical spectroscopy
During the HST visit, strictly simultaneous observations of Swift J1858.60814 were carried out with X-Shooter[3] (program ID 2103.D-5052(A)) and OSIRIS[4] spectrographs (program ID GTC23-19A), mounted on the VLT UT2-Kueyen telescope in Paranal Observatory and in GTC at Roque de los Muchachos Observatory, respectively. X-Shoooter yielded time-resolved optical/NIR spectra covering the range . With this instrument we obtained a total of 58 individual exposures with integration times of , for a total exposure time of . We used slit widths of 0.9 and 1.0 arcsec in the UVB and visible (VIS), respectively, yielding corresponding velocity resolutions of . The data set was reduced using the standard ESO pipeline EsoReflex[5] version 3.3.5. Calibration frames were taken every 1 h and additionally during the occultation of HST by the Earth. A total of 20 science exposures of five minutes long were gathered with GTC/OSIRIS, covering the first two hours of the campaign, using the grism R2500R (5575 – 7685 Å) and one with R1000B (4200 – 7400 Å), delivering a velocity resolution of and respectively. Further details on the data reduction of these observation are given in Muñoz-Darias et al. (2020)[3].
Outflow diagnostics
The presence of blue-shifted absorption associated with far-UV and optical lines implies a significant column density of material in the lower level of the relevant atomic transition. This, in turn, can be used to set a rough lower limit on the mass-loss rate of the outflow.
Following [6], we approximate the outflow as spherical and adopt a simple Hubble-like velocity law. Combining the expression for the Sobolev optical depth with the continuity equation, the characteristic optical depth presented by such an outflow at velocity in a given line can be written as
| (3) |
Here, and are the oscillator strength and wavelength of the line, respectively, is the abundance of the relevant element, is the fraction of those atoms in the correct ionization level, is the mass-loss rate of the outflow, and is the radius where velocity is reached in the wind.
The reference values adopted for , and in Equation 3 are representative of the C iv resonance line (treated as a singlet). The reference velocity, , is chosen based on the location of the blue-shifted absorption trough in the far-UV line profiles (cf Figure 4). Our adopted value of corresponds to the radius in the disc beyond which a thermally driven outflow is expected to be launched (see below); it is also roughly the radius where . Finally, by taking , we ensure that our estimate of is a lower limit (modulo uncertainties in the other parameters).
Based on the depth of the absorption features in the far-UV line profiles, we expect that for both N v and C iv. The estimated lower limits on the mass-loss rates are then from N v and from C iv. The larger of these numbers corresponds to a Hydrogen column density of cm-2, if we adopt the same quasi-spherical wind model with an inner radius of cm. For comparison, a total column of cm-2 is required for the electron-scattering optical depth to reach , as might be expected if the observed flaring is driven by time-dependent obscuration.
A thermally driven disc wind in Swift J1858.60814 ?
The accretion discs in luminous X-ray binaries are subject to strong irradiation. As a result, the upper layers of the atmosphere can be heated to the inverse Compton temperature, which depends only on the spectral energy distribution of the radiation field. The X-ray spectrum of Swift J1858.60814 in the hard state can be approximated as a power law with photon index and an exponential cut off at keV[22]. For such a spectrum, the Compton temperature is approximately [7], which gives K for Swift J1858.60814 .
Mass loss from these heated layers is inevitable at radii where the characteristic thermal speed of the ions, exceeds the local escape velocity, . Discs larger than the so-called Compton radius, , are therefore expected to produce thermally driven outflows. For Swift J1858.60814 , we obtain cm. In reality, the radius at which this mechanism turns on is typically [8, 9, 30]. In our mass-loss rate calculation above, we have adopted a characteristic radius for the line-forming region in the outflow.
The disc in Swift J1858.60814 is certainly large enough to drive such an outflow. The orbital period of the system is h [14]. From Kepler’s third law, and assuming that , the binary separation is cm. If the disc is tidally limited, its outer radius will be roughly , where is the Roche-lobe radius of the neutron star [10]. The outer disc radius is therefore expected to be – much larger than , let alone .
The final condition for strong thermally driven mass loss is that the irradiating luminosity should be sufficiently strong, [19]. This is comparable to the time-averaged luminosity in the flaring hard state of Swift J1858.60814 [17]. It is therefore likely that the system was luminous enough to drive a powerful thermal disc wind.
References
- [1] Green, J. C. et al. The Cosmic Origins Spectrograph. \JournalTitleApJ 744, 60, DOI: 10.1088/0004-637X/744/1/60 (2012). 1110.0462.
- [2] Eracleous, M. & Horne, K. The Speedy Magnetic Propeller in the Cataclysmic Variable AE Aquarii. \JournalTitleApJ 471, 427, DOI: 10.1086/177979 (1996).
- [3] Vernet, J. et al. X-shooter, the new wide band intermediate resolution spectrograph at the ESO Very Large Telescope. \JournalTitleA&A 536, A105, DOI: 10.1051/0004-6361/201117752 (2011). 1110.1944.
- [4] Cepa, J. et al. OSIRIS tunable imager and spectrograph. In Iye, M. & Moorwood, A. F. (eds.) Optical and IR Telescope Instrumentation and Detectors, vol. 4008 of Society of Photo-Optical Instrumentation Engineers (SPIE) Conference Series, 623–631, DOI: 10.1117/12.395520 (2000).
- [5] Freudling, W. et al. Automated data reduction workflows for astronomy. The ESO Reflex environment. \JournalTitleA&A 559, A96, DOI: 10.1051/0004-6361/201322494 (2013). 1311.5411.
- [6] Drew, J. E. Inclination and orbital-phase-dependent resonance line-profile calculations applied to cataclysmic variable winds. \JournalTitleMNRAS 224, 595–632, DOI: 10.1093/mnras/224.3.595 (1987).
- [7] Done, C. Observational characteristics of accretion onto black holes. \JournalTitlearXiv e-prints arXiv:1008.2287 (2010). 1008.2287.
- [8] Woods, D. T., Klein, R. I., Castor, J. I., McKee, C. F. & Bell, J. B. X-Ray–heated Coronae and Winds from Accretion Disks: Time-dependent Two-dimensional Hydrodynamics with Adaptive Mesh Refinement. \JournalTitleApJ 461, 767, DOI: 10.1086/177101 (1996).
- [9] Proga, D. & Kallman, T. R. On the Role of the Ultraviolet and X-Ray Radiation in Driving a Disk Wind in X-Ray Binaries. \JournalTitleApJ 565, 455–470, DOI: 10.1086/324534 (2002). astro-ph/0109064.
- [10] Frank, J., King, A. & Raine, D. J. Accretion Power in Astrophysics: Third Edition (2002).
- [11] Ashman, K. M., Bird, C. M. & Zepf, S. E. Detecting Bimodality in Astrometrical Datasets. \JournalTitleAJ 108, 2348, DOI: 10.1086/117248 (1994). astro-ph/9408030.
Code availability
Codes used for the analysis are available from the corresponding author upon reasonable request.
Data availability
The data underlying this article are publicly available in: https://archive.stsci.edu/hst/search.php program ID 15984 for HST/FUV data. http://archive.eso.org/cms.html program 190ID 2103.D-5052(A) for VLT/X-Shooter and https://gtc.sdc.cab.inta-csic.es/gtc/ program ID GTC23-19A for GTC/OSIRIS. X-ray data from NICER used all the OBSIDs starting with 120040, 220040,320040 and 359201 accessible from HIESARC (https://heasarc.gsfc.nasa.gov/docs/nicer/nicer_archive.html).