The Swift Gamma-Ray Burst Mission
Abstract
The Swift mission, scheduled for launch in early 2004, is a multiwavelength observatory for gamma-ray burst (GRB) astronomy. It is the first-of-its-kind autonomous rapid-slewing satellite for transient astronomy and pioneers the way for future rapid-reaction and multiwavelength missions. It will be far more powerful than any previous GRB mission, observing more than 100 bursts per year and performing detailed X-ray and UV/optical afterglow observations spanning timescales from 1 minute to several days after the burst. The objectives are to: 1) determine the origin of GRBs; 2) classify GRBs and search for new types; 3) study the interaction of the ultra-relativistic outflows of GRBs with their surrounding medium; and 4) use GRBs to study the early universe out to . The mission is being developed by a NASA-led international collaboration. It will carry three instruments: a new-generation wide-field gamma-ray (15-150 keV) detector that will detect bursts, calculate 1-4 arcmin positions, and trigger autonomous spacecraft slews; a narrow-field X-ray telescope that will give 5 arcsec positions and perform spectroscopy in the 0.2 to 10 keV band; and a narrow-field UV/optical telescope that will operate in the 170-600 nm band and provide 0.3 arcsec positions and optical finding charts. Redshift determinations will be made for most bursts. In addition to the primary GRB science, the mission will perform a hard X-ray survey to a sensitivity of mCrab ( erg cm-2 s-1 in the 15-150 keV band), more than an order of magnitude better than HEAO A-4. A flexible data and operations system will allow rapid follow-up observations of all types of high-energy transients, with rapid data downlink and uplink available through the NASA TDRSS system. Swift transient data will be rapidly distributed to the astronomical community and all interested observers are encouraged to participate in follow-up measurements. A Guest Investigator program for the mission will provide funding for community involvement. Innovations from the Swift program applicable to the future include: 1) a large-area gamma-ray detector using the new CdZnTe detectors; 2) an autonomous rapid slewing spacecraft; 3) a multiwavelength payload combining optical, X-ray, and gamma-ray instruments; 4) an observing program coordinated with other ground-based and space-based observatories; and 5) immediate multiwavelength data flow to the community. The mission is currently funded for 2 years of operations and the spacecraft will have a lifetime to orbital decay of years.
1 Introduction
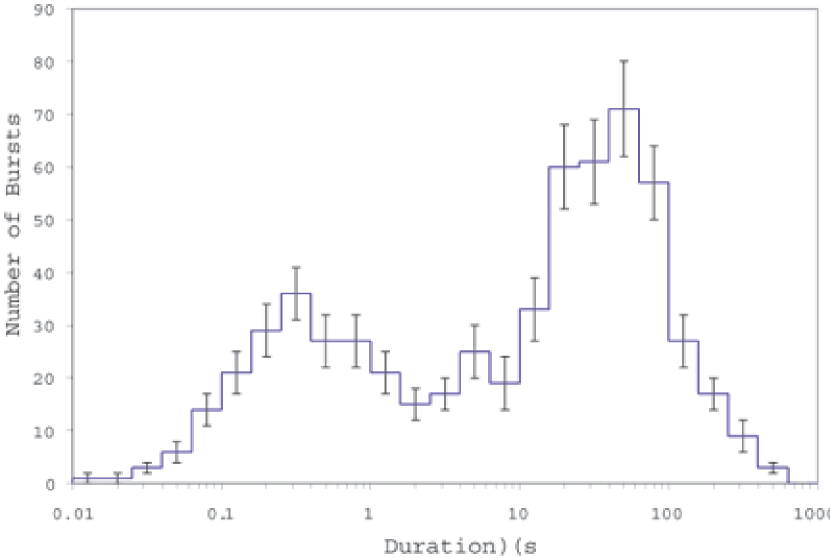
Gamma-ray bursts (GRBs) were discovered in the late 1960s in data from the Vela satellites (Klebesadel, Strong, & Olson, 1973). Tremendous progress has been made in their understanding over the past thirty years and particularly since 1997. We know that they are bright (few photons cm-2 s-1 flux in the 50-300 keV band) flashes of gamma rays that are observable at Earth approximately once per day. The BATSE instrument on the Compton Gamma-Ray Observatory showed that they are distributed isotropically over the sky (Briggs, 1996) and show a deficit of very faint bursts (Paciesas et al., 1999). GRBs have durations ranging from milliseconds to tens of minutes, with a bimodal distribution showing clustering at second (short bursts) and seconds (long bursts) as shown in Figure 1. For long bursts, the discovery by BeppoSAX (Costa et al., 1997) and ground-based observers (van Paradijs et al., 1997; Frail et al., 1997) of X-ray through radio afterglow allowed redshifts to be measured and host galaxies to be found, proving a cosmological origin. In contrast, little is known about the short bursts and their afterglows (Hurley et al., 2002). With typical redshifts of , the gamma-ray flash corresponds to a huge instantaneous energy release of ergs (assuming the radiation is beamed into steradian). GRBs are probably related to black hole formation, possibly related to endpoints of stellar evolution, and definitely bright beacons from the high redshift universe (see van Paradijs et al. (2000) for a review). The recent afterglow discoveries have illustrated that multiwavelength studies are the key to our further understanding of GRBs. Swift is designed specifically to study GRBs and their afterglow in multiple wavebands. It will perform sensitive X-ray and optical afterglow observations of hundreds of GRBs on all timescales, from a minute after the burst detection to hours and days later. Since afterglows fade quickly, typically as or , Swift’s rapid minute response will allow observations when the emissions are orders of magnitude brighter than the current few-hour response capabilities.
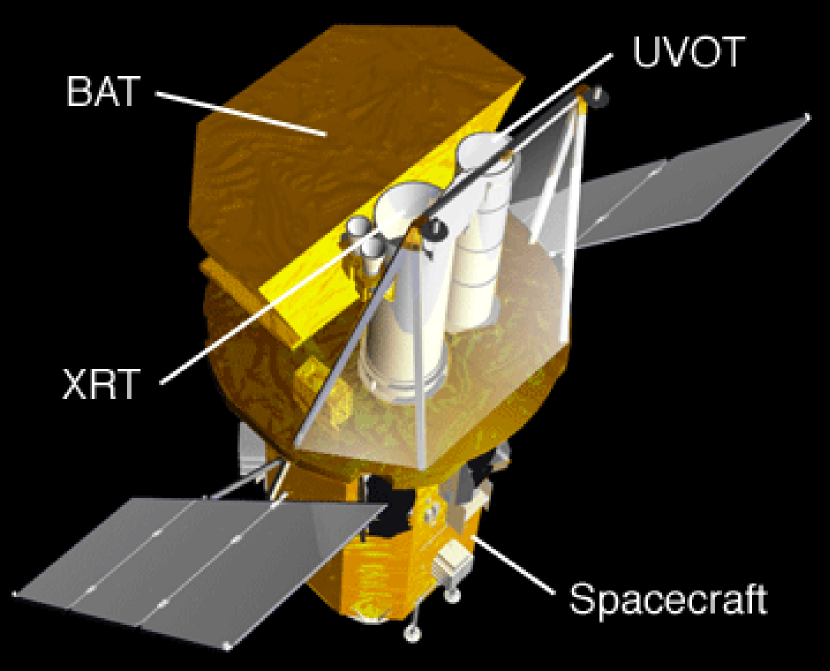
Swift is a medium-sized explorer (MIDEX) mission selected by NASA for launch in early 2004. The hardware is being developed by an international team from the USA, the United Kingdom, and Italy, with additional scientific involvement in France, Japan, Germany, Denmark, Spain and South Africa. The primary scientific objectives are to determine the origin of GRBs and to pioneer their usage as probes of the early universe. Swift’s Burst Alert Telescope (BAT), will search the sky for new GRBs and, upon discovery, will trigger an autonomous spacecraft slew to bring the burst into the X-Ray Telescope (XRT) and Ultraviolet/Optical Telescope (UVOT) fields of view (FOVs). Such autonomy will allow Swift to perform X-ray and UV/optical observations of bursts per year within 20-70 seconds of a burst detection. Figure 2 shows a drawing of the Swift spacecraft, and Table 1 summarizes Swift’s mission characteristics. Tables 2, 3, and 4 list the parameters of the three instruments.
2 Key Science
The Swift mission provides the capability to answer four key GRB science questions: What are the progenitors of GRBs? Are there different classes of bursts with unique physical processes at work? How does the blastwave evolve and interact with its surroundings? What can GRBs tell us about the early Universe? In addition, the mission will carry out a broad program of non-GRB science.
2.1 GRB Progenitors
Three parameters are necessary for the determination of GRB progenitors: the total energy released, the nature of the host galaxy (if one exists), and the location of the burst within the host galaxy. The angular resolution of the XRT and UVOT allows precise location of the BAT-discovered bursts, yielding measurements of these parameters for hundreds of bursts.
To measure the total energetics of a burst, reliable redshifts are needed. Ideally, this should be done independently for the afterglow and proposed host galaxy to rule out a chance juxtaposition (Hogg & Fruchter, 1999). Swift’s UV grisms and filters can make redshift determinations by searching for the Ly- cutoff in the UV and eliminate the deadband of current observations during the early phase of the afterglow. For GRBs with afterglow optical brightness of , the UVOT grism will perform spectroscopy between 170 and 600 nm with resolution. In addition, illumination of the immediate (100 pc) environment by the initial burst is expected to cause time varying optical, UV and X-ray lines and edges within the first hour (Perna & Loeb, 1998; Mészáros & Rees, 1998), evolving at later times to give abundance information on the circumstellar medium (Reeves et al., 2002; Butler et al., 2003). Swift’s rapid response will allow a search for the expected X-ray lines and, thereby also provide a direct redshift measure from the X-ray afterglow.
The UVOT will provide positions of arcsec accuracy by using background stars to register the field. This position will give unique host galaxy identifications and allow later comparison with HST fields to determine the burst’s position within the galaxy.
In some events, there may be no optical afterglow visible due to dust extinction surrounding the GRB site (Lamb, 2003) or Lyman cutoff of a high redshift event. This is not likely to occur often with UVOT observing to sensitivities of 24th magnitude immediately following the burst, as described below, but when it does occur it will indicate a high priority GRB. In such cases, the XRT 5.0 arcsec positions will be crucial, allowing unique identification of the candidate galaxy down to and rapid ground-based IR follow-up. Observations with Chandra made within a couple of days for a selection of these events will give sub-arcsec positions within the Swift 5.0 arcsec error circle.
2.2 Blastwave Interaction
The GRB afterglow is thought to be produced by the interaction of an ultra-relativistic blastwave with the interstellar medium (ISM) or intergalactic medium (IGM). The blastwave model (Rees & Mészáros, 1992) predicts a series of stages as the wave slows. A key prediction is a break in the spectrum that moves from the gamma to optical band, and is responsible for the power law decay of the source flux (Mészáros & Rees, 1997). This break moves through the X-ray band in a few seconds, but takes up to 1000 s to reach the optical; thus, observations within the first 1000 s in the optical and UV are critical. While it now seems likely that all the long GRBs have X-ray afterglows, not all have bright optical or radio afterglow (at least after several hours). While this may be due to optical extinction, it is possible that in some cases the optical (and X-ray) afterglow is present but decays much more rapidly (Groot et al., 1998; Pandey et al., 2003), perhaps as a function of the density of the local environment (Piran, 1998). Prompt high-quality X-ray, UV, and optical observations over the first minutes to hours of the afterglow are crucial to resolving this question. Continuous monitoring is important since model-constraining flares can occur in the decaying emission.
Swift’s capability to detect X-ray spectral lines and edges will provide a wealth of information about the afterglow mechanism and sites, including density, ionization, elemental abundance, and outflow characteristics. Swift will enable the observation of lines during the early bright phase of the afterglow, during which they are best detected.
Star forming regions are embedded in large columns of neutral gas and dust. The presence of extinction can be readily determined by multiband photometry in the optical and IR. The simultaneous detection of high X-ray absorption, coupled with photometric E (B V) measurements with Swift, will determine whether dust and gas are present. Continuous monitoring over the first few hours to days will indicate whether dust is building up (due to condensation out of an expanding hot wind) or disappearing (due to ablation and evaporation).
2.3 Classes of GRB
By determining the redshift, location, and afterglow properties of many hundreds of bursts, Swift will determine whether or not sub-classes of GRBs exist and what physical differences cause the classes. The current evidence for sub-classes is a bimodal distribution of burst duration, a possible correlation between hardness and - shape, the consistency of the of some short bursts with a Euclidean distribution, the detection of X-ray rich events, the non-detection of optical emission from “dark” bursts and a possible separate population of long-lag, low-luminosity GRBs. However, it is not clear whether these differences are real or artifacts of the distribution function of GRB properties such as beaming angle, density of the local medium or initial energy injection. The main reason for current confusion is that no standard candle exists for GRBs, although recent work shows that when collimation angles are taken into account the total energy seems to be more narrowly distributed than the fluence (Panaitescu & Kumar, 2001; Frail et al., 2001). Swift will remedy this confusion by directly measuring distance through redshift, thereby giving an exact determination of the GRB luminosity function.
Since BeppoSAX was not able to accurately locate bursts shorter than second and because short bursts tend to have hard spectra to which HETE-2 is not sensitive, we have little data on the nature of afterglow for the short class of GRBs (see Figure 1). Swift will be sensitive to the shortest events, so will provide better coverage of these events than has been possible with current missions.
Should Swift discover GRBs with no X-ray or UV/optical afterglow, the BAT will still provide positions of 1-4 arcmin, which is sufficient to look for radio or IR counterparts. Only the rapid response of Swift will be able to identify such a new and elusive subclass of GRB event.
There is growing evidence of an association of GRBs with supernova explosions (Bloom et al., 1999; Woosley, Eastman, & Schmidt, 1999; Galama et al., 1998; Germany et al., 2000; Reichart, 1999; Dado, Dar, & De Rujula, 2002; Stanek et al., 2003; Hjorth et al., 2003; Della Valle et al., 2003). For such associations, the UVOT will provide unique and unprecedented coverage of the optical and UV light curve during the early stage.
2.4 GRBs as Astrophysical Tools
Since the lifetime of massive star progenitors is short compared to the age of the universe at , the cosmic GRB rate should be approximately proportional to the star formation rate. The cosmic rate of massive star formation is at present controversial. Estimates that star formation peaks at 1-2 and declines sharply at high redshifts have been reported (Madau et al., 1996). However, IR (Blain et al., 1999; Rowan-Robinson et al., 1997) and X-ray cluster (Mushotzky & Lowenstein, 1997) results show a considerably higher rate in dust enshrouded galaxies at higher redshifts. Swift, by obtaining a large sample of GRBs over a wide range of fluences and redshifts, will provide valuable information on the evolution of star formation in the Universe (Lamb & Reichart, 2000; Bromm & Loeb, 2002; Lloyd-Ronning, Fryer, & Ramirez-Ruiz, 2002). Also, because the X-ray flux does not depend greatly on the line of sight column, these results will be independent of absorption. The star formation rates in the Swift-selected host galaxies can independently be estimated, for example using sub-millimeter and radio observations (Barnard et al., 2003; Berger et al., 2003).
GRBs are the most luminous objects we know of in the Universe, and, as such, provide a unique opportunity to probe the IGM and ISM of the host galaxies via measurement of absorption along the line of sight (Lamb & Reichart, 2000; Fiore et al., 2000). Depending on evolution, GRBs might originate from redshifts up to and have a median redshift , larger than that of any other observable population. By rapidly providing both accurate positions and optical brightness, Swift will enable the immediate follow-up of those GRBs bright enough for high resolution optical absorption line spectroscopy at redshifts high enough to study the reionization of the IGM (Miralda-Escudé, 1998). This information on the high-z Ly- forest will be unique because there are currently no known bright () galaxies or quasars at (Fan et al., 2001; Lamb & Reichart, 2000).
2.5 Non-GRB Science
2.5.1 Hard X-ray Survey
The BAT will produce the most sensitive hard X-ray survey ever made. Since no all-sky survey is planned by INTEGRAL, Swift’s survey will be unmatched. Assuming uniform coverage to estimate sensitivities, the BAT instrument will provide an exposure of cm2 s for each sky pixel yielding a statistical sensitivity of 200 mCrab in the 15-150 keV band. In this energy range, our experiencewith coded mask instruments suggests that such deep exposures will be systematics limited. Although 2D coded apertures generally have better systematics than the alternatives (modulation collimators, Fourier grids, etc.), we estimate BAT detection sensitivity to be systematics limited at mCrab at high galactic latitude ( °) and mCrab when strong galactic sources are in the FOV. These correspond to limits in the 15-150 keV band of erg cm-2 s-1 for high latitudes and erg cm-2 s-1 for low latitudes. Such levels correspond to to in a statistical sense. Swift’s survey will be 17 times more sensitive for one third of the sky and 5 times more sensitive for the rest than the best complete hard X-ray survey to date by HEAO A-4, complete to 17 mCrab (Levine et al., 1984).
2.5.2 Active Galactic Nuclei
Recent studies with ASCA, Ginga, and BeppoSAX have shown the existence of a large population of highly absorbed Seyfert 2 galaxies with line-of-sight column densities cm-2. The large column makes the nuclei of these objects essentially invisible at optical and soft X-ray wavelengths. Detailed models (Madau, Ghisellini, & Fabian, 1994; Hasinger & Zamorani, 1997) show such a population of highly absorbed AGN is needed to produce the observed 30 keV bump in the hard X-ray background and that it comprises about half of all AGN. The only known method of detecting such objects is an unbiased sky survey in the E keV band of sufficient sensitivity to detect a large population.
The number of AGN observed at mCrab in the 2-10 keV range is (Piccinotti et al., 1982), but AGN spectra are harder than that of the Crab, so this corresponds to 200-300 sources at mCrab in the 10-100 keV band. The factor for highly absorbed AGN raises this total to 400-600 sources. These estimates are consistent with scaling from the 6 AGN in the HEAO A-4 survey. Using 400 sources, we expect Swift to detect AGN brighter than 1 mCrab within 45°of the Galactic poles and AGN brighter than 3 mCrab in the rest of the sky. More than half will not have been identified in the ROSAT survey. At this time, only AGN have quality detections at energies keV (Dermer & Gehrels, 1995; Macomb & Gehrels, 1999).
2.5.3 Soft Gamma Repeaters
The BAT will be sensitive to soft gamma repeaters (SGRs) because of its capable short-burst trigger. While the SGR bursts are shorter than the Swift slew time, XRT and UVOT will perform sensitive searches immediately after an SGR burst for X-ray and optical counterparts and will likely be on-target when subsequent bursts occur. Swift will not only study existing SGRs, but will be able to discover new ones to help complete the galactic SGR census.
2.5.4 Rapid Reaction Science
The rapid reaction capability of the Swift observatory, using the TDRSS uplink, will provide the unique ability to respond rapidly (within hour) with sensitive gamma-ray, X-ray, UV, and optical observations to most events on the sky. This includes targets of opportunity (ToOs) for AGN flares, X-ray transients, pulsar glitches, outbursts from dwarf novae, and stellar flares. Highly variable black-hole binaries such as GX 339-4 will be excellent targets for simultaneous high time resolution multiwavelength observations for understanding the complex accretion-outflow physics (Smith et al., 1999). The BAT is times more sensitive as a monitor than BATSE and will initiate many of the targets of opportunity. Triggers from external sources will also be possible. There has never been a facility that can provide such rapid multiwavelength follow-up to unpredictable events. As with any new observation capability, the potential for serendipitous science return is high.
3 Swift Mission
The Swift mission was selected for Phase A study in January 1999 and selected for flight in October 1999. Swift’s science payload consists of three instruments mounted onto an optical bench. These instruments, the Burst Alert Telescope (BAT), X-Ray Telescope (XRT) and UltraViolet/Optical Telescope (UVOT), are shown on the spacecraft in Figure 2, and their characteristics are listed in Tables 2-4.
The spacecraft is provided by Spectrum Astro, based on their flight-proven SA-200 bus. The launch will be on a Delta 7320-10 in early 2004 to a 22°-inclination, 600-km altitude orbit. Swift has a nominal lifetime of 2 years with a goal of 5 years and an orbital lifetime of years.
Normal data will be downlinked in several passes each day over the Italian Space Agency (ASI) ground station at Malindi, Kenya. TDRSS will be used to send burst alert messages to the ground. Similarly, information about bursts observed by other spacecraft will be uplinked through TDRSS for evaluation by Swift’s on-board figure-of-merit (FoM) software (see Section 4.1).
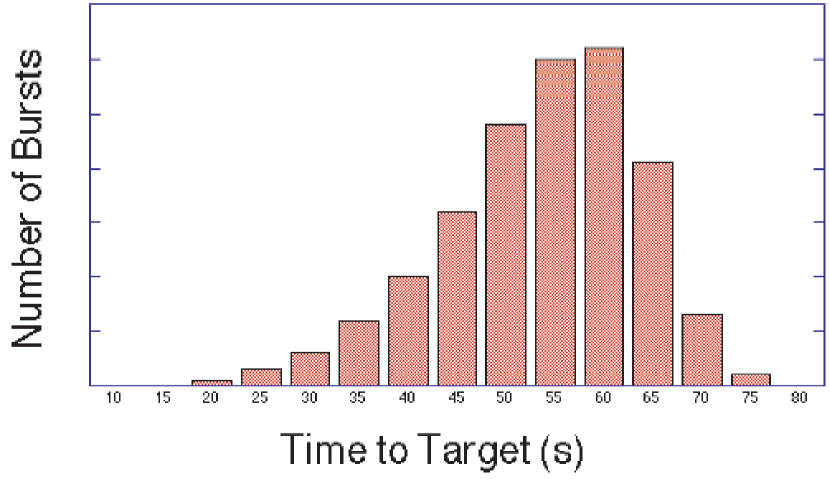
There will be no on-board propulsion system. Pointing will be provided by momentum wheels with momentum unloaded by magnetic torquers. Pointing knowledge will be through the gyroscopes, star trackers, sun sensors, and magnetometers. The simulated distribution of Swift reaction times is shown in Figure 3.
The observation strategy for the early phases of the mission will be for the XRT and UVOT to be almost constantly observing positions of bursts previously detected by the BAT. The most recently detected burst will have priority (although this can be adjusted as science dictates). Typically 2 to 4 sources will be observed each orbit. When a burst is detected, an automated series of XRT and UVOT observations will be performed lasting 20,000 s in exposure. Following that time, additional observations will be scheduled via ground planning. For at least the first months of the mission, all GRBs detected/imaged by BAT and within allowed pointing constraints of the spacecraft will be slewed to. Also, priority will be given to GRB observations in this period with no time specifically spent on secondary science; although, serendipitous science such as the BAT sky survey and transient monitoring will occur automatically as BAT awaits the next GRB trigger.
4 Burst Alert Telescope
The Burst Alert Telescope (BAT) is a highly sensitive, large FOV instrument designed to provide critical GRB triggers and 4-arcmin positions. It is a coded-mask instrument with a 1.4 steradian field-of-view (half coded). The energy range is 15-150 keV for imaging with a non-coded response up to 500 keV. Within the first seconds of detecting a burst, the BAT will calculate an initial position, decide whether the burst merits a spacecraft slew and, if worthy, send the position to the spacecraft.
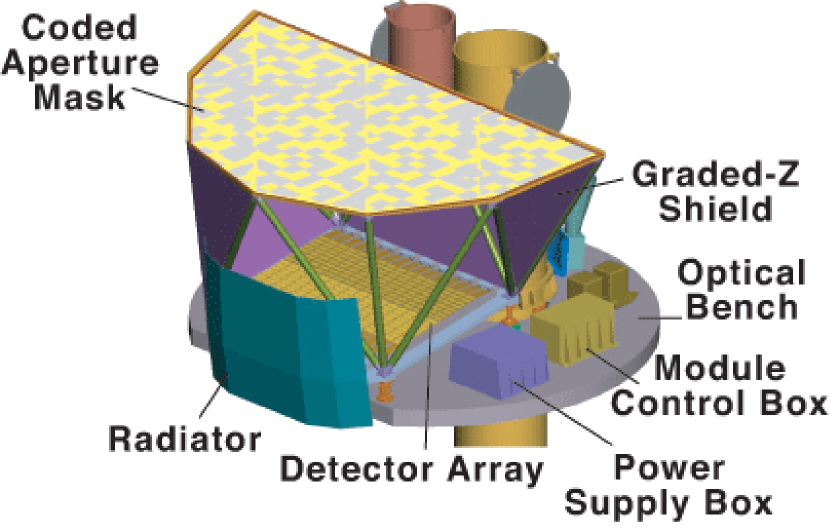
In order to study bursts with a variety of intensities, durations, and temporal structures, the BAT must have a large dynamical range and trigger capabilities. The BAT uses a two-dimensional coded mask and a large area solid state detector array to detect weak bursts and has a large FOV to detect a good fraction of bright bursts. Since the BAT coded FOV always includes the XRT and UVOT fields-of-view, long duration gamma-ray emission from the burst can be studied simultaneously with the X-ray and UV/optical emission. The data from the BAT will also produce a sensitive hard X-ray all-sky survey over the course of Swift’s two year mission (see 2.5.1). Figure 4 shows a cut-away drawing of the BAT, and Table 2 lists the BAT’s parameters. Further information on the BAT is given by Barthelmy (2003).
4.1 Technical Description
The BAT’s 32,768 pieces of mm CdZnTe (CZT) form a m sensitive area in the detector plane. The detector configuration is similar to that of the CdTe detectors on INTEGRAL, with about twice the area of the INTEGRAL array. Groups of 128 detector elements are assembled into arrays, each connected to 128-channel readout Application Specific Integrated Circuits (ASICs; the XA1s, which are designed and produced by Integrated Detector and Electronics of Norway). Detector modules, each containing two such arrays, are further grouped by eights into blocks. This hierarchical structure, along with the forgiving nature of the coded-aperture technique, means that the BAT can tolerate the loss of individual pixels, individual detector modules, and even whole blocks without losing the ability to detect bursts and determine locations. The CZT array will have a nominal operating temperature of 20°C, and its thermal gradients (temporal and spatial) will be kept to within °C. The typical bias voltage is V, with a maximum of V. The detectors will be calibrated in flight with an electronic pulsar and an 241Am tagged source.
The BAT has a D-shaped coded mask, made of lead tiles ( mm) mounted on a 5 cm thick composite honeycomb panel, which is mounted by composite fiber struts 1 meter above the detector plane. Because the large FOV requires the aperture to be much larger than the detector plane and the detector plane is not uniform due to gaps between the detector modules, the BAT coded mask uses a completely random, 50% open-50% closed pattern, rather than the commonly used Uniformly Redundant Array pattern. The mask has an area of 2.7 m2, yielding a half-coded FOV of 100° 60°, or 1.4 steradians.
A graded-Z fringe shield, located both under the detector plane and surrounding the mask and detector plane, will reduce background from the isotropic cosmic diffuse flux and the anisotropic Earth-albedo flux by %. The shield is composed of layers of Pb, Ta, Sn, and Cu, which are thicker toward the bottom nearest the detector plane and thinner near the mask.
An FoM algorithm resides within the BAT flight software and decides if a burst detected by the BAT is worth requesting a slew maneuver by the spacecraft. If the new burst has more “merit” than the pre-programmed observations, a slew request is sent to the spacecraft. Uploaded rapid-reaction positions are processed exactly the same as events discovered by the BAT. The FoM is implemented entirely in software and can be changed either by adjusting the parameters of the current criteria or by adding new criteria.
4.2 BAT Operations
The BAT runs in two modes: Burst Mode, which produces burst positions, and Survey Mode, which produces hard X-ray survey data. In the Survey Mode the instrument collects count-rate data in 5 minute time bins for 18 energy intervals. When a burst occurs it switches into a photon-by-photon mode with a round-robin buffer to save pre-burst information.
4.2.1 Burst Detection
The burst trigger algorithm looks for excesses in the detector count rate above expected background and constant sources. It is based on algorithms developed for the HETE-2 GRB observatory, upgraded based on HETE-2 experience. The algorithm continuously applies a large number of criteria that specify the pre-burst background intervals, the order of the extrapolation of the background rate, the duration of the burst emission test interval, the region of the detector plane illuminated, and the energy range. The BAT processor will continuously track hundreds of these criteria sets simultaneously. The table of criteria can be adjusted after launch. The burst trigger threshold is commandable, ranging from to above background noise with a typical value of . A key feature of the BAT instrument for burst detection is its imaging capability. Following the burst trigger the on-board software will check for and require that the trigger corresponds to a point source, thereby eliminating many sources of background such as magnetospheric particle events and flickering in bright galactic sources. Time stamping of events within the BAT has a relative accuracy of 100 s and an absolute accuracy from the spacecraft clock of s (after ground analysis). When a burst is detected, the sky location and intensity will be immediately sent to the ground and distributed to the community through the Gamma-Ray Burst Coordinates Network (GCN) (Barthelmy et al., 2000).
4.2.2 Hard X-ray Survey
While searching for bursts, the BAT will perform an all-sky hard X-ray survey and monitor for hard X-ray transients. The survey is described in Section 2.5.1. For on-board transient detection, 1-minute and 5-minute detector plane count-rate maps and -minute long average maps are accumulated in 4 energy bandpasses. Sources found in these images are compared against an on-board catalog of sources. Those sources either not listed in the catalog or showing large variability are deemed transients. A subclass of long smooth GRBs that are not detected by the burst trigger algorithm may be detected with this process. All hard X-ray transients will be distributed to the world community through the internet, just like the bursts.
4.3 Detector Performance
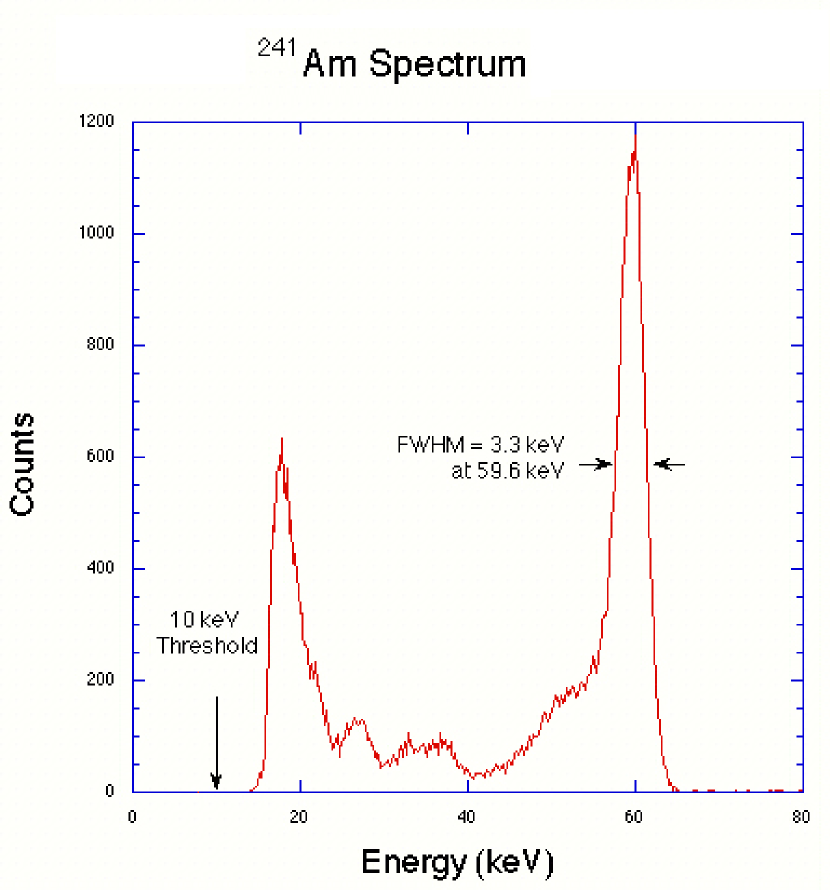
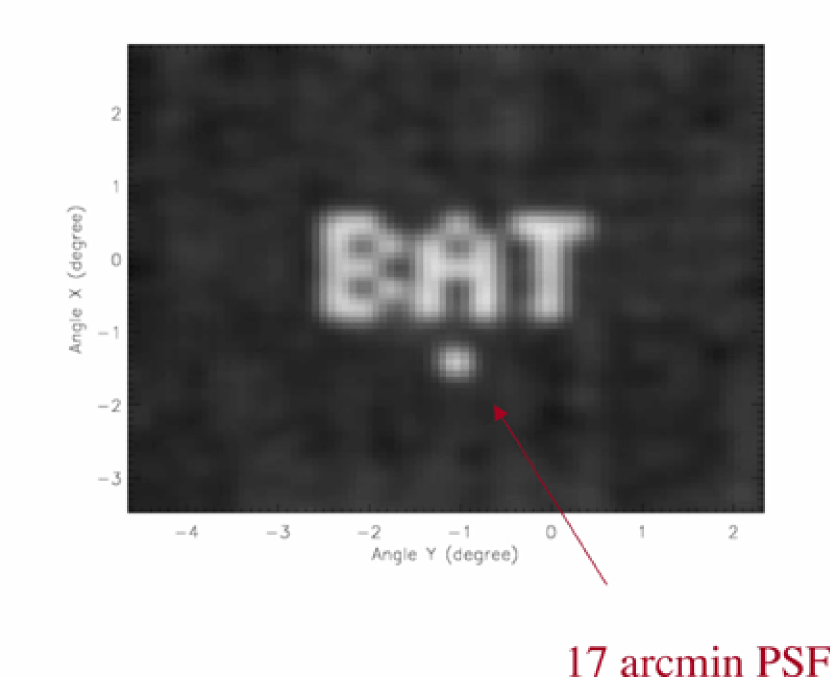
A typical spectrum of the 60 keV gamma-ray line from an 241Am radioactive source for an individual pixel is shown in Figure 5. It has a full-width-half maximum (FWHM) at 60 keV of 3.3 keV (), which is typical of CZT detectors. A composite image made with a 133Ba radioactive calibration source is shown in Figure 6. The source was positioned 3 meters above the detectors and moved to several locations to spell out “BAT”. The FWHM spread of the individual images, when corrected to infinite distance, is 17 arcmin, which is consistent with the predicted instrument PSF of arcmin. Simulations have calculated an average BAT background event rate of 17,000 events s-1, with orbital variations of a factor of two around this value. This yields a GRB sensitivity of erg cm-2 s-1, 5 times better than BATSE. The combination of the 4 mm square CZT pieces, plus the 5 mm square mask cells and the 1-m detector-to-mask separation gives an instrumental angular resolution of 20 arcmin FWHM, yielding a conservative 4 arcmin centroiding capability for bursts and steady-state sources given an burst threshold.
5 X-Ray Telescope
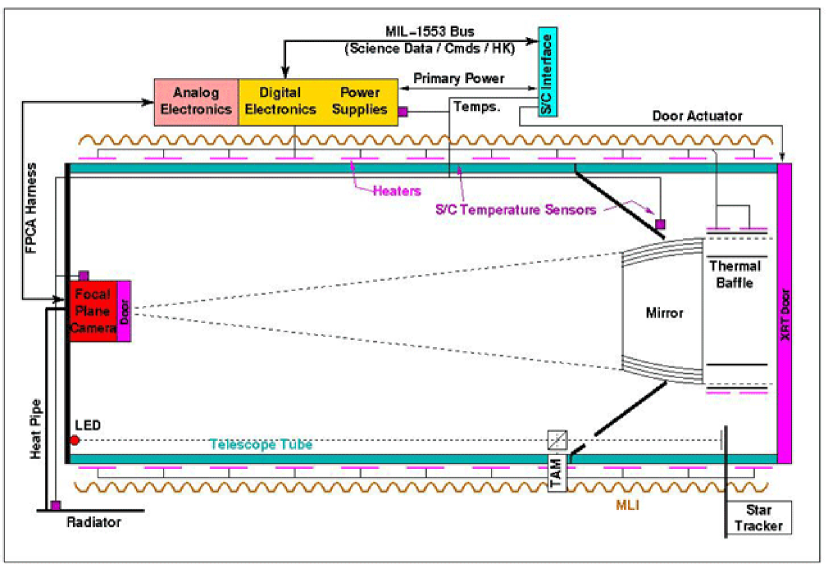
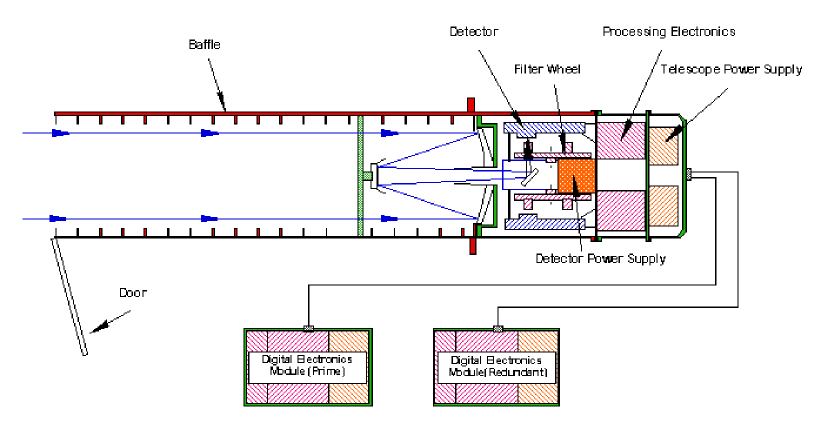
Swift’s X-Ray Telescope (XRT) is designed to measure the fluxes, spectra, and lightcurves of GRBs and afterglows over a wide dynamic range covering more than 7 orders of magnitude in flux. The XRT will pinpoint GRBs to 5-arcsec accuracy within 10 seconds of target acquisition for a typical GRB and will study the X-ray counterparts of GRBs beginning 20-70 seconds from burst discovery and continuing for days to weeks. Figure 7 shows a schematic of the XRT, and Table 3 summarizes XRT parameters. Further information on the XRT is given by Burrows et al. (2003).
5.1 Technical Description
The XRT is a focusing X-ray telescope with a 110 cm2 effective area, 23 arcmin FOV, 18 arcsec resolution (half-power diameter), and 0.2-10 keV energy range.
The XRT uses a grazing incidence Wolter 1 telescope to focus X-rays onto a state-of-the-art CCD. The complete mirror module for the XRT consists of the X-ray mirrors, thermal baffle, a mirror collar, and an electron deflector. The X-ray mirrors are the FM3 units built, qualified and calibrated as flight spares for the JET-X instrument on the Spectrum X mission (Citterio et al., 1996; Wells et al., 1992, 1997). To prevent on-orbit degradation of the mirror module’s performance, it will be maintained at °C with gradients of °C by an actively controlled thermal baffle similar to the one used for JET-X.
A composite telescope tube holds the focal plane camera, containing a single CCD-22 detector. The CCD-22 detector, designed for the EPIC MOS instruments on the XMM-Newton mission, is a three-phase frame-transfer device, using high resistivity silicon and an open-electrode structure (Holland et al., 1996) to achieve a useful bandpass of 0.2-10 keV (Short, Keay, & Turner, 1998). The CCD consists of an image area with pixels ( mm) and a storage region of pixels ( mm). The FWHM energy resolution of the CCD decreases from eV at 10 keV to eV at 0.1 keV, where below keV the effects of charge trapping and loss to surface states become significant. A special “open-gate” electrode structure gives the CCD-22 excellent low energy quantum efficiency (QE) while high resistivity silicon provides a depletion depth of 30 to 35 mm to give good QE at high energies. The detectors will operate at approximately K to ensure low dark current and to reduce the CCD’s sensitivity to irradiation by protons (which can create electron traps which ultimately affect the detector’s spectroscopy).
5.2 Operation and Control
The XRT supports three readout modes to enable it to cover the dynamic range and rapid variability expected from GRB afterglows, and autonomously determines which readout mode to use. In order of bright flux capability (and the order that would normally be used following a GRB), the modes are as follows. Imaging Mode produces an integrated image measuring the total energy deposited per pixel and does not permit spectroscopy. It will only be used to position bright sources up to erg cm-2 s-1 (37 Crab). Windowed Timing Mode sacrifices position information to achieve high time resolution (2.2 ms) and bright source spectroscopy through rapid CCD readouts. It is most useful for sources with flux below erg cm-2 s-1 (5 Crab). Photon-counting Mode uses sub-array windows to permit full spectral and spatial information to be obtained for source fluxes ranging from to erg cm-2 s-1 (1 mCrab to 45 mCrab). The upper limit is set by when pulse pile-up becomes important ().
5.3 Instrument Performance
The instrument point spread function has a 18 arcsec half-energy width, and, given sufficient photons, the centroid of a point source image can be determined to sub-arcsec accuracy in detector coordinates. Based on BeppoSAX and RXTE observations, it is expected that a typical X-ray afterglow will have a flux of 0.5-5 Crabs in the 0.2-10 keV band immediately after the burst. This flux should allow the XRT to obtain source positions to better than 1 arcsec in detector coordinates, which will increase to arcsec when projected back into the sky due to alignment uncertainty between the star tracker and the XRT.
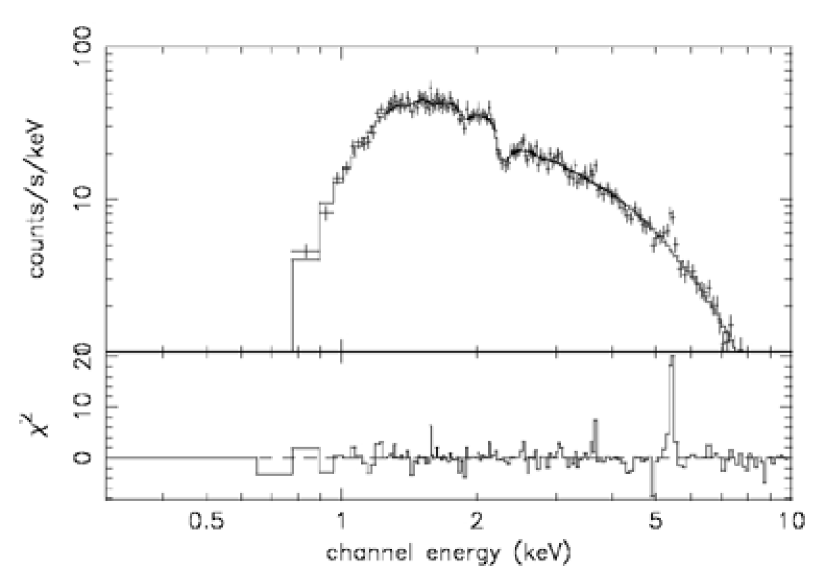
The XRT energy resolution at launch will be eV at 6 keV, with spectra similar to that shown in Figure 8. Fe emission lines, if detected, will provide a redshift measurement accurate to about 10%. The resolution will degrade during the mission, but will remain above 300 eV at the end of the mission life for a worst-case environment. Photometric accuracy will be good to 10% or better for source fluxes from the XRT’s sensitivity limit of erg cm-2 s-1 to erg cm-2 s-1 (about 2 times brighter than the brightest X-ray burst observed to date).
6 Ultra-Violet/Optical Telescope
The Ultra-Violet/Optical Telescope (UVOT) design is based on the Optical Monitor (OM) on-board ESA’s XMM-Newton mission (see Mason et al. (1996, 2001) for a discussion of the XMM-OM). UVOT is co-aligned with the XRT and carries an 11-position filter wheel, which allows low-resolution grism spectra of bright GRBs, and broadband UV/visible photometry. There is also a field expander (magnifier) that delivers diffraction limited sampling of the central portion of the telescope FOV. Photons register on the microchannel plate intensified CCD (MIC). Figure 9 shows a schematic of the UVOT, and Table 4 summarizes the UVOT parameters. Further information on the UVOT is given by Roming et al. (2003).
6.1 Technical Description
The UVOT’s optical train consists of a 30 cm clear aperture Ritchey-Chr tien telescope with a primary f-ratio of f/2.0 increasing to f/12.72 after the secondary. The baffle system consists of an external baffle, which extends beyond the secondary mirror; an internal baffle, which lines the telescope tube between the primary and secondary mirrors; and primary/secondary baffles, which surround the secondary mirror and the hole at the center of the secondary mirror. An INVAR structure that is intrinsically thermally stable is used between the mirrors and maintains the focus. Fine adjustment to the focus is achieved by activating heaters on the secondary mirror support structure and on the INVAR metering rods that separate the primary and secondary mirrors.
The UVOT carries two redundant photon-counting detectors that are selected by a steerable mirror mechanism. Each detector has a filter wheel mounted in front of it carrying the following elements: a blocked position for detector safety; a white light filter; a field expander; two grisms; U, B, and V filters; and three broadband UV filters centered on 190, 220 and 260 nm. One grism on each wheel is optimized for the UV, the other for optical light, and both offer a spectral resolution of nm/pixel. Diffraction-limited images can be obtained with the field expander (magnifier); however, because of the limits of the transmission optics, the magnifier does not work at UV wavelengths. The UVOT operates as a photon-counting instrument. The two detectors are MICs incorporating CCDs with pixels, of which are usable for science observations. Each pixel corresponds to arcsec on the sky, providing a arcmin FOV. Photon detection is performed by reading out the CCD at a high frame rate and determining the photon splash’s position using a centroiding algorithm. The detector achieves a large format through this centroiding technique, sub sampling the CCD pixels each into virtual pixels, leading to an array of virtual pixels with a size of arcsec on the sky. The frame rate for the UVOT detectors is 10.8 ms. These detectors have very low dark current, which usually can be ignored when compared to other background sources. In addition, they have few hot or dead pixels and show little global variation in quantum efficiency.
6.2 Operating Scenarios
There are six observing scenarios for the UVOT: slewing, settling, finding chart, automated targets, pre-planned targets, and safe pointing targets.
Slewing. As the spacecraft slews to a new target, the UVOT does not observe in order to protect itself from bright sources slewing across its FOV and damaging the detector.
Settling. After notification from the spacecraft that the intended object is within ten arcminutes of the target, the UVOT begins observing. During this phase pointing errors are off-nominal, i.e., the target is moving rapidly across the FOV as the spacecraft settles. The positional accuracy is only known to a few arcmin based on the BAT s centroided position.
Finding Chart. If the intended target is a new GRB and the spacecraft is sufficiently settled, i.e., the pointing errors are small, the UVOT begins a 100 second exposure in the V filter to produce a finding chart. The finding chart is to aid ground-based observers in localizing the GRB. The positional accuracy of the finding chart will be approximately 0.3 arcsec relative to the background stars in the FOV. It is anticipated that for most bursts the XRT will have reported a better than 5-arcsec position for the target before the end of the finding chart observation.
Automated Targets. Once a finding chart has been produced, an automated sequence of exposures, which uses a combination of filters, is executed. The sequence is based on the optical decay profile of the GRB afterglow and time since the initial burst. Currently, two automated sequences will be launched: bright and dim GRB sequences. Although only two sequences will be loaded at launch, new sequences can be added and existing ones modified as GRB afterglows become better understood.
Pre-Planned Targets. When there are no automated targets, observation of planned targets (which have been uploaded to the spacecraft) begins. Follow-up of previous automated targets, targets-of-opportunity, and survey targets are included as planned targets.
Safe Pointing Targets. When observing constraints do not allow observations of automated or pre-planned targets the spacecraft points to predetermined locations on the sky that are observationally safe for the UVOT.
There are two data collection modes for the UVOT: Event and Imaging, which can be run at the same time if desired. In Event Mode, the UVOT stores time-tagged photon events in memory as they arrive. The timing resolution is equal to the CCD frame time ( ms). In Imaging Mode, photon events are summed into an image for a time period known as the tracking frame time ( s). These tracking frame images are shifted to compensate for spacecraft pointing drift and added in memory, using the bright stars within the FOV as fiducial points. The advantage of Imaging Mode is that it minimizes the telemetry requirements when the photon rate is high, but at the expense of timing information. The area of the sky over which data are stored can be windowed in each mode, again allowing the optimum utilization of telemetry. In general it is anticipated that a large window will be used during the initial phases of the burst when the uncertainty in its position on the detector is higher, and that the window size will be reduced when the burst is positioned more accurately.
Besides the science data collection modes, the UVOT also supports a number of engineering modes to monitor on-orbit performance and aid instrument testing and integration.
6.3 Instrument Performance
The top-level UVOT observational capabilities are to provide information on the short-term UV/optical behavior of GRBs, a finding chart for ground-based observers, and GRB follow-up observations. The UVOT must also be able to protect itself autonomously from bright sources that could damage the detectors.
The 100 second parameterized finding chart is used to construct an image on the ground and provide a arcsec position for the burst relative to the field stars close to the GRB. Redshifts can be obtained for brighter GRBs with grism spectra. For fainter GRBs, light curves positions, and photometric redshifts will be obtained by cycling through the 6 broadband filters. Event Mode data will allow monitoring of source variability on short timescales. Centroided positions accurate to 0.3 arcsec will be determined, allowing the UVOT to accurately position the burst relative to any host galaxy it may be associated with. The UVOT will have a sensitivity to a limiting magnitude of in 1000 s using the white light filter.
The UVOT provides for its own detector safety to a greater extent than OM, as it must autonomously and quickly respond to new burst detections. If the detector is in danger of being overexposed, this can be rapidly sensed by circuitry in the camera head, which signals the instrument control unit (ICU) to drop the voltage on the detector photocathode, rendering it insensitive. A catalog of bright sources will be included in the ICU. This will be consulted whenever a slew is triggered to anticipate the presence of known objects in the new FOV that might damage the detector and limit the exposure to a safe value.
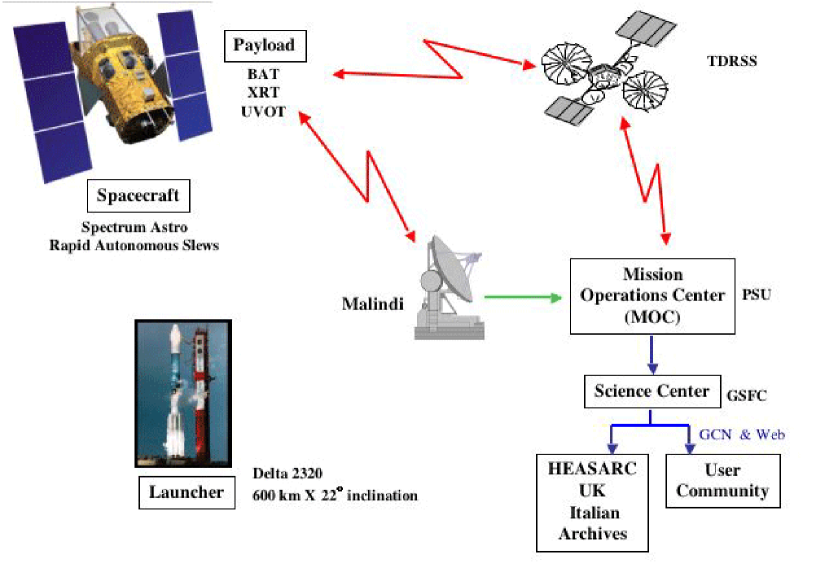
7 Ground System
Swift’s ground system has been designed for speed and flexibility both in distributing burst alerts and data and in receiving scientific input for mission planning. The Swift ground system consists of Penn State University’s (PSU’s) Mission Operation Center (MOC), the Swift Science Center (SSC) and Swift Data Center (SDC) at GSFC, the UK Swift Science Data Center (UKSSDC) at the University of Leicester, the Italian Swift Archive Center (ISAC), the Italian Space Agency’s (ASI) ground station at Malindi, Kenya, the NASA TDRSS data relay satellites, and communications networks interfacing the various elements. The overall mission architecture is shown in Figure 10.
Swift burst alerts and burst characteristics are transmitted almost instantaneously through a TDRSS link to the GCN for rapid distribution to the astronomical community. A TDRSS uplink also permits rapid response to ToOs, such as GRBs detected by other missions.
The Malindi ground station in Kenya provides the primary communications support. There, telemetry frames are timestamped and sorted by channel. Real-time data are forwarded immediately to the MOC. The remainder of the telemetry is stored temporarily and later sent to the MOC. Malindi is also the primary station for forwarding commands from the MOC to the spacecraft.
The MOC, located near the PSU campus in State College PA, provides real-time command and control of the spacecraft and monitors the observatory. In addition, the MOC takes care of science and mission planning, ToO handling and data capture and accounting.
The SDC is part of the Astrophysics Data Facility in the Space Science Data Operations Office at GSFC. It makes Level 0, 1, 2, and 3 data products, and then provides the data to the High Energy Astrophysics Science Archive Research Center (HEASARC), ISAC and UKSSDC. The HEASARC, which is part of the Laboratory for High Energy Astrophysics (LHEA) at GSFC, is responsible for making the data available to the astronomical community and for the long-term archive of the data. The data centers in the UK and Italy distribute data to their respective communities.
The SSC supports the science community in the use of Swift data with documentation and advice. The SSC is also responsible for developing the data analysis tools for the UVOT and takes the lead role in integrating the entire suite of science analysis tools for Swift data. Data analysis tools for the XRT and BAT data will be developed by the ISAC and BAT instrument teams respectively.
8 Follow-Up Team
An essential aspect of the Swift mission is the ability to make hundreds of burst positions, as well as the positions of transient sources detected during the sky survey, available to the wide community for ground- and space-based multiwavelength follow-up studies. Up to now, such studies have been conducted largely on a ToO basis, since only bursts per year have had their positions determined well enough to observe with large telescopes. This will change when Swift flies, because the number of positions will be sufficient to propose a routine counterpart observing program, with the assurance that whenever observing time is granted, there will be an interesting, recent event to observe.
We will encourage both ToO and routine observations by distributing precise positions in near-real-time via the GCN and any other means that are in use during the mission. As is the case today, observers will have completely free access to the public data. In order to maximize the routine use of the most sensitive multiwavelength and non-electromagnetic detectors over the widest possible geographic range, we have formed a team of over 30 scientists (see Table 5) who will collaborate closely with the project on follow-up observations. They have, or will request, access to instruments, including the world s largest telescopes, to carry out high-resolution spectroscopy, optical, IR and radio monitoring of light curves, and morphological studies of host galaxies, for example. We will encourage all observers to make their data public by posting it to a web-accessible database, which we will maintain, and which will centralize all known observations of each burst.
9 Guest Investigator Program
It is anticipated that there will be substantial interest and involvement of the astronomical community in the Swift mission, particularly in the areas of GRB and other transient-source science. The data from the mission will be made public as soon as they are processed to allow as many researchers as possible to participate. Also, the near-real-time distribution of alerts for GRBs and other transients through the GCN will facilitate prompt follow-up observations by ground and space instruments.
Support for community involvement will be provided by a NASA Guest Investigator (GI) program. Proposals will be solicited through the Research Opportunities for Space Science (ROSS) yearly solicitation. The program will be open to investigations with US principal investigators. Areas of research solicited in the first year of the program will be the following:
-
•
Correlative observations of GRBs with non-Swift instruments and observatories
-
•
New GRB projects not duplicative of Swift team key projects and not requiring GI-specified observatory pointings
-
•
Theoretical investigations that advance the mission science return in the area of GRBs
The program may be expanded in year 2 and later to include areas of research in non-GRB science and may include GI-specified pointings, depending on the experience gained from year 1 of the mission.
For year 1, GI proposals were due in fall 2003 with investigations starting 4.5 months after launch. There will be approximately 30 investigations selected.
10 Swift Data Processing and Multiwavelength Analysis
When Swift telemetry is received from the MOC at the SDC, it triggers a run of the Swift processing pipeline – a detailed script of tasks that produce Flexible Image Transportation System (FITS) files from raw telemetry, calibrated event lists and cleaned images, and higher level science products such as light curves and spectra for all Swift instruments. Initial data products appear on the Swift Quick Look Data public Web site. When processing is complete, the products are delivered to the HEASARC archive. All pipeline software will be FITS Tools (FTOOLs), that will also be distributed to Swift users. This way, users can then reprocess/reanalyze data when new calibration information is made available, instead of needing to wait for eventual reprocessing.
Software tools specific to the BAT, XRT and UVOT will apply instrument-specific calibration information and filtering criteria in the pipeline to arrive at calibrated images and screened event lists.
10.1 UVOT pipeline
The UVOT instrument produces a finding chart which arrives via TDRSS, and event and image data taken through any one of six broadband filters or two grism filters. During an observation, the size and location of the window can change, as can the on-chip binning. The pipeline will produce cleaned, calibrated event list files, calibrated image files and standard products for each observation. This includes, e.g., high signal-to-noise images of the field generated by combining all individual images obtained using the same filter. Exposure maps are constructed for each combined image. Source lists are derived from the combined images. Provided an optical counterpart to the target has been identified, light curves for each available filter are extracted from all available image and event data.
Grism spectra of the candidate counterpart are obtained from each available grism image. Grism source event tables will be generated, containing the wavelength of each photon, screened according to a spatial mask so that only those events likely to be associated with the candidate counterpart remain. A response matrix will be generated to facilitate the analysis of grism data within the XSPEC software package. A ”response matrix” will also be provided so that broad-band fluxes through the standard filters can be fit simultaneously with XRT and BAT data.
10.2 XRT Pipeline
The XRT instrument has several readout modes to cover the large dynamic range and rapid variability expected from GRB afterglows, and is capable of autonomously changing the readout mode when the source flux changes appropriately. For all XRT data modes, the XRT pipeline will produce cleaned, calibrated event list files and standard products for each observation.
The standard event screening criteria for XRT will rely on event grade, detector temperature, and spacecraft attitude information. XRT standard products – spectra, images and light curves – will be produced in the pipeline, as well as Ancillary Response File (ARF) files for spectroscopy, an exposure map appropriate for converting counts in an image to flux.
Computation of an appropriate exposure map for images will result in the net exposure time per pixel taking into account attitude reconstruction, spatial quantum efficiency, filter transmission, vignetting and FOV. For spectra, a Redistribution Matrix File (RMF) that specifies the channel probability distribution for a photon of a given energy and an ARF specifying telescope effective area and window absorption will be calculated in the pipeline.
10.3 BAT Pipeline
The BAT instrument produces event files for each BAT event data type (long, short, long calibration, short calibration), as well as rate files for the entire BAT array, mask-tagged light curves for each of three mask-tagged sources, and light curves of GRBs. The BAT also produces Detector Plane Histograms (DPHs) in survey mode. The pipeline produces standard Burst Mode data products: burst spectra on various time scales, response matrices, light curves, and images. Raw BAT DPHs are used to generate the BAT survey products. Some survey products are produced for a single DPH, and others result from summing all DPHs in a given pointing. Light curves are generated for survey sources applying a source detection algorithm, the mask pattern and a cleaning algorithm to eliminate confusing sources.
For the entire BAT array, a one-second light curve will be produced, while light curves with 64 ms time resolution are produced for entire BAT blocks. Light curves with 1.6-s time resolution in four energy ranges are produced for each array quadrant. Light curves with 8-s time resolution in four energy bands record the maximum count rate in each of nine array regions, on 5 time scales. Mask-tagged light curves with 1.6-s time resolution are generated for each of three mask-tagged sources. Light curves of GRBs derived from event data and five-minute light curves derived from the survey data for each source detected by the BAT are also generated in the pipeline.
The pipeline produces BAT event files and Detector Plane Images (DPIs), needed to generate sky images. DPIs are histogram images of calibrated events, and must be deconvolved with the mask to produce useable sky images. Event files are rebinned to produce burst light curves and spectra. Photon spectra may be derived by fitting count spectra and can be corrected for the effects of partial coding and the reduced off-axis response. Detector response matrices are also calculated in the pipeline.
For BAT survey data, count spectra and response matrices will be produced and archived for sources found in the survey. During burst mode, count spectra and response matrices will be generated for bursts before, during and after the slew. Photon spectra before, during and after the slew may also be produced during burst mode. The pipeline will produce deconvolved sky images containing data from entire snapshots. Images will be available in four energy bands as well as a broadband image.
10.4 Multi-wavelength Analysis
Swift s unique purpose of observing a GRB in progress and its afterglow across the spectrum demands that spectral data from the three instruments be analyzed together. With this goal in mind, UVOT spectra are prepared with the associated response matrices and calibration information to allow them to be input into XSPEC (as well as the more traditional UV-optical spectral analysis tools, such as IRAF). Assuming a well-understood cross calibration of the instruments, such functionality will allow users to fit various spectral models for bursts, search for the energy range of spectral breaks, and accurately measure the Ly- cut-off (and hence the redshift) for the afterglow.
11 Mission Implementation
Swift is being developed by an international collaboration with primary hardware responsibilities at GSFC, Penn State, Mullard Space Science Laboratory, University of Leicester, Osservatorio Astronomico di Brera and the ASI Science Data Center. Other institutions that have made significant contributions to the mission are Los Alamos National Laboratory (LANL), Sonoma State University, Max Planck Institut f r Extraterrestriche Physik, and Institute of Space and Astronautical Science in Japan.
The mission is managed at GSFC. Swift’s BAT instrument is being developed at GSFC with flight software from LANL. The XRT is a collaboration between Penn State University, University of Leicester and Osservatorio Astronomico di Brera. Groups at Mullard Space Science Laboratory and Penn State University have developed the UVOT. The Follow-up Team has been formed under leadership at UC Berkeley to perform follow-up observations of Swift-detected GRBs at other observatories. An Education and Public Outreach (EPO) team is in place under the direction of Sonoma State University. The responsibilities of the various institutions involved in the Swift mission are listed in Table 6.
The mission team successfully completed the Critical Design Review (CDR) in July 2001 and the Mission Operations Review (MOR) in August 2002. Instrument deliveries will complete by February 2004. Launch is scheduled for mid 2004.
Following launch, the first 45 days in orbit will be the observatory activation and checkout phase during which time the instruments and spacecraft are turned on and tested. The spacecraft slew testing will occur starting at approximately 14 days and the doors of the XRT and UVOT will be opened at approximately 25 days. After the activation and checkout phase, the next 3 months will be the verification phase during which time the observatory performance and data products will be verified and the instruments calibrated. The Swift team anticipates that BAT GRB alerts will be distributed to the community over the GCN starting after the activation and checkout phase. The initial alerts will be sent out several hours after the GRB onset to allow ground verification of the data. By the end of the verification phase, the observatory will be up to full performance with GRB data from all instruments rapidly distributed via the GCN.
12 Education and Public Outreach
The science from the Swift mission appeals to students of all ages, who are naturally excited about GRBs and black holes. The Swift EPO program capitalizes on that existing interest to teach basic physical science (e.g., the electro-magnetic spectrum, gravity, and the cycles of energy and matter) as well as more advanced Swift science (e.g., GRBs, black holes, and cosmology.)
The Swift EPO program includes partners from the US, Italy, Germany and the UK. It is divided into 5 basic program elements: Swift web site, printed materials, educator training, informal education and program evaluation. In addition, a unique element of the Swift outreach program is that a song has been written and recorded about the science and mission that can be heard at the Swift main web site (http://swift.gsfc.nasa.gov) or the EPO web site give below.
Swift EPO Web Site. The EPO website (http://swift.sonoma.edu) contains an overview of the Swift mission and the EPO program, as well as downloadable versions of all Swift educational materials. It is updated frequently, and is linked to the sites of the international EPO partners.
Printed Materials. The Swift EPO effort has already produced several printed products, including posters outlining Newton s three laws, booklets with classroom activities based on the electromagnetic spectrum and waves, and a deck of cards designed to teach students scientific notation. A major product is the Great Explorations in Math and Science (GEMS) guide titled The Invisible Universe: the Electromagnetic Spectrum from Radio Waves to Gamma-rays. This well-tested classroom workbook contains a series of five hands-on activities that use the mystery of gamma-ray bursts to teach the electromagnetic spectrum. It was developed in partnership with the GEMS group at the Lawrence Hall of Science.
Educator Training. The Swift EPO team has held several teacher workshops at various national and local venues, training teachers to use the Swift educational materials. Workshops will be held throughout the duration of the Swift mission, using new materials as they are developed. Swift materials are featured in a yearly summer school held at the Pennsylvania State University, which includes many teachers from rural, under-represented schools. Recently, two Swift Education Ambassadors (EAs) were appointed to help develop, evaluate and disseminate Swift educational materials. These award-winning educators were selected in a national search, joining an ever-growing contingent of EAs that are supporting other NASA missions.
Informal Education. Swift materials are being incorporated as part of the Cosmic Questions museum exhibit being developed by the NASA s Structure and Evolution of the Universe Education Forum and in an exhibit at the British National Space Science Center. Swift also sponsors news briefs on the television show What s in the News? This show reaches millions of middle school students each year, airing through the Penn State public television network, WPSX. Three or four segments each year feature the science and technology of the Swift mission, as well as interviews with Swift scientists.
Program Evaluation. The Swift educational materials are being thoroughly assessed to ensure they are interesting, effective, widely disseminated and aligned with the National Science and Mathematics Education Standards. The Swift Education Committee a team comprised of Swift scientists and master educators and the EAs formatively evaluate the materials as they are developed, while WestEd performs the summative external program assessment, surveying workshop participants and providing written analyses of the effectiveness of all materials and workshops.
13 Conclusion
Swift is an innovative mission for gamma-ray burst study that will carry three instruments to perform multiwavelength, simultaneous observations of GRBs in gamma-ray, X-ray, and UV/optical wavelengths. The Swift spacecraft will be capable of rapid, autonomous slewing to capture afterglows in the first minutes following a GRB. New technology will allow an advanced gamma-ray detector to image GRBs at 5 times better sensitivity than BATSE. Data will be rapidly distributed throughout the scientific community, and participation by observers around the world is encouraged.
References
- Barnard et al. (2003) Barnard, V. E. et al., 2003, MNRAS, 338, 1
- Barthelmy et al. (2000) Barthelmy, S. D. et al. (2000) in “Gamma-Ray Bursts”, eds. R. M. Kippen, R. S. Mallozzi and G. J. Fishman (AIP, New York), p. 731
- Barthelmy (2003) Barthelmy, S. D. (2003) Proc. SPIE, 5165, in press
- Berger et al. (2003) Berger, E. et al., 2003, ApJ, 588, 99
- Blain et al. (1999) Blain, A. W., Smail, I., Ivison, R. J., and Kneib, J.-P. (1999) MNRAS, 302, 632
- Bloom et al. (1999) Bloom, J. S., et al. (1999) Nature, 401, 453
- Briggs (1996) Briggs, M. S. (1996) ApJ, 459, 40
- Bromm & Loeb (2002) Bromm, V. and Loeb, A. (2002) ApJ, 575, 111
- Burrows et al. (2003) Burrows, D. N. et al. (2003) Proc. SPIE, 5165, in press
- Butler et al. (2003) Butler, N. R. et al. (2003) ApJ, submitted (astro-ph/0303539)
- Citterio et al. (1996) Citterio, O. et al. (1996) Proc. SPIE, 2805, 56
- Costa et al. (1997) Costa, E. et al. (1997) Nature, 387, 783
- Dado, Dar, & De Rujula (2002) Dado, S., Dar, A., and De Rujula, A. (2002) A&A, 388, 1079
- Della Valle et al. (2003) Della Valle, M. et al. (2003) A&A, 406, L33
- Dermer & Gehrels (1995) Dermer, C. D., and Gehrels, N. (1995) ApJ, 447, 103
- Fan et al. (2001) Fan, X. et al. (2001) AJ122, 2883
- Fiore et al. (2000) Fiore, F. et al. (2000) ApJ, 544, L7
- Frail et al. (1997) Frail, D. A. et al. (1997) Nature, 389, 261
- Frail et al. (2001) Frail, D. A. et al. (2001) ApJ, 562, L55
- Galama et al. (1998) Galama, T. J. et al. (1998) Nature, 395, 670
- Germany et al. (2000) Germany, L. M. et al. (2000) ApJ, 533, 320
- Groot et al. (1998) Groot, P. J., et al. (1998) ApJ, 502, L123
- Hasinger & Zamorani (1997) Hasinger, G., and Zamorani, G. (1997) Festschrift for R. Giacconi’s 65th birthday, World Scientific Publishing Co., H. Gursky, R. Ruffini, L. Stella eds.
- Hjorth et al. (2003) Hjorth, J. et al. (2003) Nature, 423, 847
- Hogg & Fruchter (1999) Hogg, D. W., and Fruchter, A. S. (1999) ApJ, 520, 54
- Holland et al. (1996) Holland, A. D., Turner, M. J., Abbey, A. F., and Pool, P. J. (1996) Proc. SPIE, 2808, 414
- Hurley et al. (2002) Hurley, K. et al. (2002) ApJ, 567, 447
- Klebesadel, Strong, & Olson (1973) Klebesadel, R. W., Strong, I. B., and Olson, R. A. (1973) ApJ, 182, L85
- Lamb & Reichart (2000) Lamb, D. Q., and Reichart, D. E. (2000) ApJ, 536, 1
- Lamb (2003) Lamb, D. Q. (2003) in “Gamma-ray Burst and Afterglow Astronomy 2001”, eds. G. R. Ricker and R. K. Vanderspek (AIP, New York), p. 415
- Levine et al. (1984) Levine, A. M. et al. (1984) ApJS, 54, 581
- Lloyd-Ronning, Fryer, & Ramirez-Ruiz (2002) Lloyd-Ronning, N. M., Fryer, C. L., and Ramirez-Ruiz, E. (2002) ApJ574, 554
- Macau, Ghisellini, & Fabian (1994) Macau, P., Ghisellini, G., and Fabian, A. C. (1994) MNRAS, 270, L17
- Macomb & Gehrels (1999) Macomb, D. J., and Gehrels, N. (1999) ApJS120, 335
- Madau, Ghisellini, & Fabian (1994) Madau, P., Ghisellini, G., and Fabian, A. C. (1994) MNRAS, 270, L17
- Madau et al. (1996) Madau, P., et al. (1996) MNRAS, 283, 1388
- Mason et al. (1996) Mason, K. O., et al. (1996) Proc. SPIE, 2808, 438
- Mason et al. (2001) Mason, K. O., et al. (2001) A&A, 365, L36
- Meegan et al. (1996) Meegan, C. A. et al. (1996) ApJS, 106, 65
- Mészáros & Rees (1997) Mészáros, P., and Rees, M. J. (1997) ApJ, 476, 232
- Mészáros & Rees (1998) Mészáros, P., and Rees, M. J. (1998) ApJ, 502, L105
- Miralda-Escudé (1998) Miralda-Escudé, J. (1998) ApJ, 501, 15
- Mushotzky & Lowenstein (1997) Mushotzky, R. F. and Lowenstein, M. (1997) ApJ, 481, L63
- Paciesas et al. (1999) Paciesas, W. S., et al. (1999) ApJS, 122, 465
- Panaitescu & Kumar (2001) Panaitescu, A. and Kumar, P. (2001) ApJ, 554, 667
- Pandey et al. (2003) Pandey, S. B., et al. (2003) A&A, submitted
- Perna & Loeb (1998) Perna, R., and Loeb, A. (1998) ApJ, 501, 467
- Piccinotti et al. (1982) Piccinotti, G. et al. (1982) ApJ, 253, 485
- Piran (1998) Piran, T. (1998) “Gamma-Ray Bursts–The Second Revolution”, Frontiers Science Series 23: Black Holes and High Energy Astrophysics, 217
- Rees & Mészáros (1992) Rees and Mészáros, P. (1992) MNRAS, 258, 41P
- Reeves et al. (2002) Reeves, J. N. et al. (2002) Nature, 416, 512
- Reichart (1999) Reichart, D. E. (1999) ApJ, 521, L111
- Roming et al. (2003) Roming, P. W. A. et al. (2003) Proc. SPIE, 5165, in press
- Rowan-Robinson et al. (1997) Rowan-Robinson, M., et al. (1997) MNRAS, 289, 490
- Short, Keay, & Turner (1998) Short, A. D., Keay, A., and Turner, M. J. (1998) Proc. SPIE, 3445, 13
- Smith et al. (1999) Smith, I. A., et al. (1999) ApJ, 519, 762
- Stanek et al. (2003) Stanek, K. Z., et al. (2003) ApJ, 591, L17
- van Paradijs et al. (1997) van Paradijs, J., et al. (1997) Nature, 386, 686
- van Paradijs et al. (2000) van Paradijs, J., Kouveliotou, C., and Wijers, R. A. M. J. (2000) A&A Rev., 38, 379
- Wells et al. (1992) Wells, A., et al. (1992) Proc. SPIE, 1546, 205
- Wells et al. (1997) Wells, A., et al. (1997) Proc. SPIE, 3114, 392
- Woosley, Eastman, & Schmidt (1999) Woosley, S. E., Eastman, R. G., and Schmidt, B. P. (1999) ApJ, 516, 788
| Mission Parameter | Value |
|---|---|
| Slew Rate | 50°in s |
| Orbit | Low Earth, 600 km altitude |
| Inclination | 22° |
| Launch Vehicle | Delta 7320-10 with 3 meter fairing |
| Mass | 1450 kg |
| Power | 1040 W |
| Launch Date | early 2004 |
| BAT Parameter | Value |
|---|---|
| Energy Range | 15-150 keV |
| Energy Resolution | keV |
| Aperture | Coded mask, random pattern, 50% open |
| Detection Area | 5240 cm2 |
| Detector Material | CdZnTe (CZT) |
| Detector Operation | Photon counting |
| Field of View (FOV) | 1.4 sr (half-coded) |
| Detector Elements | 256 modules of 128 elements/module |
| Detector Element Size | mm3 |
| Coded-Mask Cell Size | mm3 Pb tiles |
| Telescope PSF | |
| Source Position and Determination | 1-4 arcmin |
| Sensitivity | erg cm-2 s-1 |
| Number of Bursts Detected | yr-1 |
| XRT Parameter | Value |
|---|---|
| Energy Range | 0.2-10 keV |
| Telescope | JET-X Wolter 1 |
| Detector | E2V CCD-22 |
| Effective Area | 110 cm2 @ 1.5 keV |
| Detector Operation | Photon counting, integrated imaging, and timing |
| Field of View (FOV) | arcmin |
| Detection Elements | pixels |
| Pixel Scale | 2.36 arcsec |
| Telescope PSF | 18 arcsec HPD @ 1.5 keV |
| Sensitivity | erg cm-2 s-1 (1 mCrab) in 104 s |
| UVOT Parameter | Value |
|---|---|
| Wavelength Range | 170-600 nm |
| Telescope | Modified Ritchey-Chrétien |
| Aperture | 30 cm diameter |
| F-number | 12.7 |
| Detector | Intensified CCD |
| Detector Operation | Photon counting |
| Field of View (FOV) | arcmin |
| Detection Elements | pixels |
| Telescope PSF | 0.9 arcsec FWHM @ 350 nm |
| Colors | 6 |
| Sensitivity | B = 24 in white light in 1000 s |
| Pixel Scale | 0.5 arcsec |
| Member | Institution | Facility of Expertise |
|---|---|---|
| Antonelli, Angelo | Osservatorio Astronomico di Roma | VLT, REM, FAME |
| Boër, Michel | CESR Toulouse | TAROT |
| Buckley, David | South Africa Astronomical Obs. | SALT |
| Busby, Michael | Tennessee State University | TSU telescopes |
| Canterna, Ron | U. Wyoming | WIRO |
| Cimatti, Andrea | Osservatorio Arcetri, Florence | LBT |
| Coe, Malcolm | U. Southampton | Tenerife, IRTF, SAAO |
| Courvoisier, Thierry | INTEGRAL Science Data Centre | INTEGRAL |
| Covino, Stefano | Osservatorio Astronomico di Brera | VLT, REM |
| Della Valle, Massimo | Osservatorio Arcetri, Florence | La Silla, Paranal |
| Dingus, Brenda | Los Alamos National Laboratory | Milagro, VERITAS |
| Fillippenko, Alex | UC Berkeley | KAIT, Keck |
| Finn, Sam | Penn State University | LIGO |
| Fiore, Fabrizio | Osservatorio Astronomico di Roma | ESO |
| Fruchter, Andy | STScI | HST |
| Ghisellini, Gabriele | Osservatorio Astronomico di Brera | VLT |
| Gilmozzi, Roberto | European Southern Observatory | VLT |
| Kawai, Nobuyuki | RIKEN | Okayama Observatory |
| Kulkarni, Shri | Caltech | Keck |
| Margon, Bruce | STScI | HST |
| Mundell, Carol | John Moores U. | Liverpool Telescope |
| Park, Hye-Sook | Lawrence Livermore National Lab. | Super-LOTIS |
| Pederson, Holger | Copenhagen University Observatory | NOT La Palma |
| Rhoads, James | STScI | KPNO, CTIO, IRTF |
| Schaefer, Brad | U. Texas Austin | McDonald, WIYN |
| Schneider, Don | Penn State University | HET |
| Skinner, Mark | Boeing | AEOS |
| Smith, Ian | Rice University | IR & sub-mm, AEOS |
| Stubbs, Chris | U. Washington | ARC |
| Thompson, Chris | CITA | SOAR |
| Vrba, Fred | US Naval Observatory | USNO telescopes |
| Walton, Nic | Institute of Astronomy, Cambridge | INT |
| Wheatley, Peter | U. Leicester | WASP, Faulkes |
| Zerbi, Filippo | Osservatorio Astronomico di Brera | REM |
| Responsibilities | Lead Institution††Abbreviations used in table: ASI = Italian Space Agency; GSFC = Goddard Space Flight Center; LANL = Los Alamos National Laboratory; MPE = Max Planck Institude f r Extraterrestrische Physik; MSSL = Mullard Space Science Laboratory; OAB = Osservatorio Astronomico di Brera; PSU = Penn State University; SSU = Sonoma State University; UCB = University of California, Berkeley; UL = University of Leicester |
|---|---|
| Principal Investigator, Mission Management | GSFC |
| Spacecraft | Spectrum Astro |
| BAT Instrument | |
| Management, Hardware | GSFC |
| On-board GRB Software | LANL |
| XTR Instrument | |
| Management, Electronics, Science Software | PSU |
| Detector System | UL |
| Mirrors | OAB |
| Calibration | MPE |
| UVOT Instrument | |
| Management, Electronics | PSU |
| Instrument Development | MSSL |
| Mission Integration and Test | Spectrum Astro/GSFC |
| Ground System Management | GSFC |
| Ground Station | ASI |
| Mission Operations Center | PSU |
| Science Center | GSFC |
| Data Centers | GSFC, ASI/OAB, LU |
| GRB Follow-up | UCB |
| Education/Public Outreach | SSU |