A planet-forming circumbinary disc in a polar configuration
Abstract
The circumbinary planets found to date by the transit method have orbits that are well-aligned with the binary orbital plane [1, 2, 3]. Misaligned circumbinary planets could exist and remain undiscovered because they are much harder to detect [4, 5]. The gas and dust rich discs in which planets form are initially present around nearly all young stars, but there has previously been no evidence of circumbinary discs that could form misaligned planets. Here we report the discovery of a strongly misaligned circumbinary disc that has properties similar to other planet-forming discs. Torques from the binary have forced this disc to a polar configuration that is stable [6], providing the first evidence that misaligned circumbinary discs in this configuration exist and can survive long enough to form misaligned planets. The existence of planets on polar orbits could mean that that the occurrence rate of circumbinary planets is higher than for single stars.
Department of Physics and Centre for Exoplanets and Habitability, University of Warwick, Gibbet Hill Road, Coventry CV4 7AL, UK
Harvard-Smithsonian Center for Astrophysics, 60 Garden Street, Cambridge, MA 02138, USA
Max-Planck-Institut für Extraterrestrische Physik, Giessenbachstrasse 1, D-85748 Garching, Germany
European Southern Observatory (ESO), Alonso de Córdova 3107, Vitacura, Santiago, Chile
School of Physics & Astronomy, University of Leeds, Woodhouse Lane, Leeds, LS2 9JT, UK
Monash Centre for Astrophysics (MoCA) and School of Physics and Astronomy, Monash University, Clayton, Vic 3800, Australia
Institute of Astronomy, University of Cambridge, Madingley Rd, Cambridge CB3 0HA, UK
Do not read this, it is the original submitted version, which is different to the accepted version.
The accepted version can be viewed for free at: https://rdcu.be/bgNSO.
To date, eleven circumbinary planets have been discovered by the transit method in nine eclipsing binary systems that have semi-major axes of between 0.08 and 0.23 astronomical units [7, 3]. The strongest bias that this discovery technique introduces is an almost total inability to discover planets whose orbital planes are not closely aligned with that of the binary [4, 5]. Despite this bias, the occurrence rate of aligned circumbinary planets is comparable to the frequency of equivalent planets around single stars, albeit with considerable uncertainties because of the small numbers involved [4, 5]. If unseen misaligned planets also exist, circumbinary planet formation might be more successful than around single stars.
While direct imaging surveys for circumbinary planets also exist, and find consistent overall binary and single-star occurrence rates (albeit with only 1-2 detections) [8], they cannot currently draw conclusions related to alignment because the planet orbital periods are too long to derive orbits [9].
A quirk of the dynamics means that planet formation in misaligned circumbinary discs could be successful. For small misalignments the angular momentum vector of circumbinary orbits precesses about the binary angular momentum (a ‘coplanar’ family of orbits), but for larger misalignments precesses about a vector in the binary’s pericentre direction (a ‘polar’ family)[10]. Because planet-forming discs are gas-rich and hence dissipative, an initially misaligned circumbinary disc will generally evolve to an end state that belongs to one of these two families [6, 11, 12]. While the circumbinary debris disc 99 Herculis is thought to have a polar configuration [13], this disc is four times larger than Neptune’s orbit, and with an age similar to the Solar system does not provide evidence that misaligned circumbinary discs exist at the epoch of planet formation.
Here, we report that the circumbinary disc in the young HD 98800 system is strongly misaligned with the binary orbital plane. We infer that the disc is in the polar configuration by simulating the disc dynamics. We further show that despite this misalignment, the disc otherwise shows physical properties similar to discs seen around young single stars. Because a large fraction of single stars are known to host planets, we may infer that single-star discs are in general successful at forming planets, and therefore that similar processes are probably ongoing in the circumbinary disc in the HD 98800 system.
The HD 98800 system is a well known hierarchical quadruple star system 44.9 parsecs from Earth [14], and a member of the 10 Myr-old TW Hydrae Association [15, 16]. It consists of two pairs of binaries (called ‘A’ and ‘B’, or equally ‘AaAb’ and ‘BaBb’) with semi-major axes of about 1 astronomical unit (au), which themselves orbit each other with a semi-major axis of 54 au. The binary BaBb is well characterized, with an eccentricity of , ascending node of anti-clockwise from North, and inclination of [17]. Using the new data presented here we derive a new orbit for AB (see Methods), which has an eccentricity of and a period of years, with an ascending node of and inclination of . These orbits as projected on the sky plane are shown in Figure 1. The AaAb orbit is less certain, but the details do not affect our conclusions.
The Northern pair known as HD 98800BaBb has been known to host a bright circumbinary disc since discovery in the 1980s [18, 19, 20]. The disc is thought to be influenced by the stellar system [21], with the inner edge of the disc truncated by the inner binary BaBb, and the outer edge externally truncated by A [22]. The orientation of the disc was initially thought to be coplanar with the inner binary [22], but higher resolution observations suggest a different orientation [23] (see Methods for a comparison with our results). Whether the disc harbours a significant mass of gas has been unclear, meaning that it has been interpreted as both a gas-rich ‘planet-forming’ disc [24, 23], and a gas-poor ‘debris’ disc [25, 26]. Detection of oxygen towards the system [27], and molecular hydrogen emission towards B [28], suggests that this pair is accreting from a gas-rich disc, favouring the former interpretation.
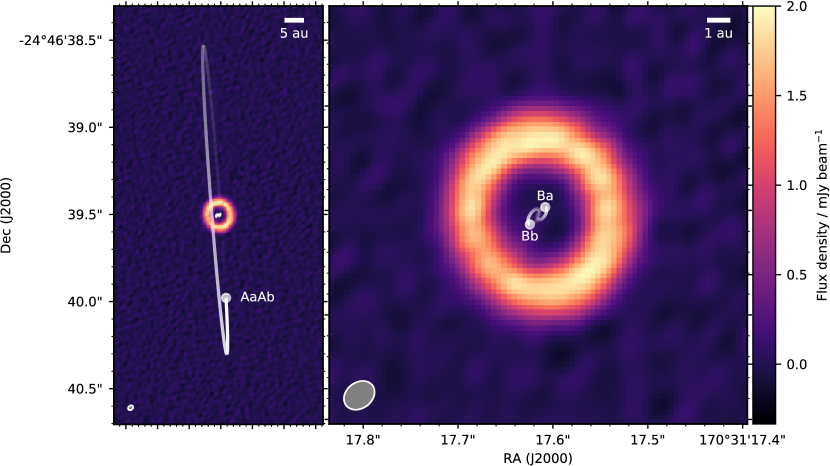

To ascertain the disc orientation, size, structure, and evolutionary status we observed the HD 98800 system with the Atacama Large Millimeter/sub-millimeter Array (ALMA, see Methods). Data were taken at 230GHz (1.3 mm), to image dust continuum emission and the carbon monoxide (CO) J=2-1 rotational transition, and both are strongly detected (Figures 1 and 2). By modelling these data as a disc that lies between inner and outer radii with a power-law surface brightness prescription, we find that the inner edges of the dust and CO are at and au respectively, while the outer edges are at and au (see Methods). These models show that the dust and CO components are consistent with having the same orientation; the disc has a position angle of (measured anti-clockwise from North) and is inclined by either 26 or 154∘ (1∘) from the sky plane. While the Doppler shifts seen in CO show that the North side of the disc is rotating towards us (Fig. 2), thus constraining the ascending node to be North of the star, the inclination remains ambiguous because the disc could be rotating either clockwise or anti-clockwise as projected on the sky. That is, these observations do not distinguish whether the East or West side of the disc is closer to Earth.

Of the two possible disc orientations, the 154∘ case is only four degrees away from the polar configuration (i.e. is perpendicular to both the BaBb orbital plane and the BaBb pericentre direction), while the 26∘ case is inclined 48∘ from the BaBb binary plane (which we refer to as the ‘moderately’ misaligned case). Given the small chance that a randomly chosen orientation should appear to be in the polar configuration that it is expected based on the dynamics and models discussed above, this configuration is by far the most likely interpretation, and a sketch is shown in Figure 3.
To further test this hypothesis, we simulated the response of the disc to perturbations from the stellar orbits using both gas-free ‘-body’, and fluid-based smoothed particle hydrodynamics, simulations (see Methods). The main conclusion from the -body simulations is that test particles placed on circular orbits at the observed 2.5-4.6 au radial location of the dust are generally ejected within less than a million years, regardless of the disc orientation. Independent of the disc orientation we therefore conclude that the dust observed with ALMA is embedded within a more massive gas disc, which acts to stabilize the disc against both interior and exterior stellar perturbations. Our estimates of the gas and dust mass in the disc are consistent with this picture, but do not confirm it because they have large systematic uncertainties (see Methods). The -body dynamics, in concert with the detection of oxygen and hydrogen gas, therefore suggest that HD 988000BaBb almost certainly harbours a long-lived gas-rich protoplanetary disc.
Our fluid based simulations find that torques from the inner binary re-orient a gas disc in the moderately misaligned configuration to the polar configuration in several hundred years. In contrast, the polar configuration is stable and remains in the observed state for at least 500 BaBb orbits (430 years). We therefore conclude that the disc is in the polar configuration, as the moderately misaligned configuration is reoriented on a timescale that is very short relative to the ten million-year old age of the system. The relatively fast realignment time also suggests that the disc has been in this configuration for most of its lifetime. Given that most stars disperse their discs well within ten million years [29], the HD 98800BaBb disc has had ample opportunity to form planets on polar orbits.
While we cannot currently detect planets within the HD 98800 disc (the high optical depth and small angular scale hamper imaging, and radial velocity precision is limited for young binaries), the probable high dust and CO optical depths are characteristics shared by all protoplanetary disks. The physical conditions, which successfully lead to planet formation around single stars, are therefore likely to be similar for HD 98800. This system may therefore show the same key signature of the first stages of planet formation observed in discs around other stars; gas is commonly seen to extend farther from the star than dust, which is thought to be caused by inward radial drift of dust particles that have grown beyond microns in size, and/or the in-situ growth of dust to sizes large enough that their mm-wave emission is fainter at larger distances [30, 31]. Evidence of dust growth in the outer disc may be present in our ALMA observations, as our models find that the gas is more extended than the bulk of the dust (see also Fig. 2). While the derived edge locations reflect the sensitivity of the observations to some degree, these models account for all of the CO surface brightness, and for 99% of the dust. The dust surface brightness is a factor of a hundred lower at 5.5au compared to 3.5au, which is much larger than the factor of two expected if the dust emission scaled with the brightness of the gas emission over this distance. Our models therefore show probable evidence of the effects of grain growth on radial disc structure, and therefore the same evidence of the first steps towards planet formation seen in equivalent discs around single stars.
While the formation of circumbinary planets on polar orbits therefore seems generally possible, the long-term prognosis for any planets that form around HD 98800 is mixed. The gas currently protects solid bodies orbiting within the disc from external perturbations from A, but as shown by our gas-free simulations this protection will largely disappear when the gas is dispersed. To survive, any planets that formed in this specific system must either reside just outside 4 au or near 6 au, and even these locations do not provide a sure refuge. More likely, any planets are destined to be consumed upon colliding with one of the systems’ stars, or to float through space after ejection from the system.
How did this system form? Simulations suggest that such outcomes may be a natural result of the chaotic nature of star formation [32]. One possibility is that two initially separate binary systems became gravitationally bound, and misaligned HD 98800BaBb’s disc in the process (and perhaps destroyed any disc around A). However, simulations show that formation from molecular cloud material with a range of angular momenta can result in misaligned discs in isolated systems [32], and indeed such systems are observed [33], so it does not appear that the presence of an exterior companion is a necessary condition for forming misaligned circumbinary discs, or that formed planets will necessarily be ejected later by perturbations from such companions. The IRS 43 system, with a circumbinary disk misaligned by about 60∘ [33], is a possible example of what systems such as HD 98800 could look like earlier in their evolution before binary torques re-orient the disk (albeit on a scale of tens of au, rather than a few au).
Our results imply that circumbinary planets may be more common than currently thought. Assuming discs that are initially randomly oriented relative to the binary orbital plane, that are not massive enough to affect the binary orbit, and that binary eccentricities are uniformly distributed up to [34], the fraction of discs that should evolve to a polar configuration is about 45% (see Methods). The most eccentric binaries are the most likely to have polar disc configurations and it is therefore not surprising that the known transiting circumbinary planets are all in systems with , with 8/9 having [7, 3]. While our population estimate is simple, it shows that polar discs and planets may be a common outcome of circumbinary disc formation.
0.1 Observations and Data Processing
HD 98800 was observed by ALMA in Band 6 (1.3 mm) in two observing blocks on 2017 November 15 and 19, 49 antennas were used in the first block and 45 in the second. The shortest and longest baselines were 92 m and 11.8 km. The correlator configuration used three broad continuum windows with 2GHz bandwidth, and one centred on the CO J=2-1 line with a spectral resolution of 488kHz (0.73km s-1 velocity resolution). Each block comprised observations of HD 98800, interspersed with observations of phase calibrator J1104-2431. J1127-1857 was used as the bandpass and flux calibrator. The time on-source was 34 minutes for each block. The raw data were calibrated using the observatory pipeline with CASA v5.1.
The data were further processed using one cycle of phase self-calibration (self-cal) to improve the signal to noise ratio (s/n). All spectral windows were combined, and the averaging time (‘solint’) was chosen to be relatively long (20-40min) to avoid flagging antennas due to low s/n, thereby retaining maximal spatial resolution. The rms variation measured in clean images before self-cal with Briggs weighting (robust=0.5) was 27 and 32 Jy beam-1 for the first and second observations. After self-cal these were 20 and 18 Jy beam-1. Attempts at further self-cal did not improve the s/n.
Following calibration the two observations were concatenated into a single set of visibilities for imaging and modelling. This combination was verified to be reasonable by modelling the continuum of each observation separately (as described below), which found that the sky offsets of the disc were consistent to within 0.0002 arcsec (0.01au). The difference in integrated flux densities was consistent to within 1%. In the final Briggs-weighted clean image the beam size is mas, the rms is 14 Jy beam-1, and the peak s/n is 280. In a naturally weighted image the beam size is mas, the rms is 13 Jy beam-1, and the peak s/n is 450. In a uniformly weighted image the beam size is mas, the rms is 43 Jy beam-1, and the peak s/n is 46.
For continuum modelling a single spectral window from the combined observations was used (the first, centred at 1.311 mm) with the 2GHz bandwidth averaged into four channels. While more data could have been used, the continuum s/n is easily sufficient to obtain stringent modelling constraints with one spectral window. Visibility data were time averaged into 20s chunks, and then exported to a text file and modelled as outlined below. The weights associated with each visibility were divided by a re-weighting factor such that a null model produces a value of 1, based on the expectation that each individual visibility measurement has negligible s/n [35]. The re-weighting factor was 5.8 (which is decreased to 2.6 if the CASA statwt task is run first).
For gas modelling the window centred on the CO J=2-1 line was used. The continuum was subtracted using the CASA uvcontsub task, the two observations merged using the mstransform task, and 40 channels near the CO line extracted to a series of text files containing the visibilities at each frequency (or equivalently, velocity). A re-weighting factor was again used, which was within a few percent of one. A naturally-weighted clean CO cube has a beam size of mas, an rms of 0.8 mJy beam-1 in each 0.73 km s-1 channel, and typical peak s/n of 4 to 6 depending on the channel.
HD 98800 has been observed at millimetre wavelengths many times in the past with single-dish telescopes. These show a considerable degree of scatter, with ref [36] measuring mJy and mJy at 1.3mm with the CSO and IRAM respectively. Our modelling below yields a total disc flux of mJy. Including an absolute calibration uncertainty of 10% yields a final flux measurement of mJy. Our value is not significantly below the previous single dish measurements, so it is unlikely that we have resolved out significant flux.
The phase centre of the observations is not perfectly centred on either AaAb, BaBb, nor the system photocentre, no doubt caused by some uncertainty in the actual position of the system components and their relative motions as derived by Hipparcos [14]. As another output of the modelling, assuming that the BaBb barycentre is at the centre of the disc, at the time of the observation (2017.874) we find that BaBb is centred at 22 05.17437, 46 39.5043 (170.52155986∘, -24.77764009∘). The positional uncertainty from the modelling is arcsec, but the true uncertainty is limited by ALMA’s pointing accuracy, which the Technical Handbook suggests is about 0.03 arcsec.
0.2 Visibility Modelling
Modelling of the continuum and CO data was done in the visibility plane using an optically thin line of sight integration code. While the dust is likely optically thick, the use of a radiative transfer code would make little difference here because the disc is close to face-on, and we are therefore simply modelling the surface brightness of the disc as a function of radius. A function specifies the three-dimensional disc density in spherical polar coordinates, which is mapped into a 3d cartesian volume using two or three rotations (the position angle , the inclination , and the argument of pericentre where necessary). Two axes of this cube represent the sky plane and the third the line of sight, and the final continuum image of a given model is created by summing the cube along the line of sight axis. Velocity cubes of the model are created by first computing the radial velocity at each location in the cube. Layers in the velocity cube are again the sum along the line of sight axis, but only including pixels from the cube that are within the velocity range for a given layer.
The range of models that are consistent with the data are found using the Markov-Chain Monte-Carlo (MCMC) package emcee [37]. The log likelihood of each model is computed given the visibility data using GALARIO [38]. GALARIO also computes the pixel size and image extent necessary for sufficient resolution when the images are transformed into visibilities, which are 4.6 milli arcseconds per pixel and 2048 pixels.
The strongest signal in the continuum image in Figure 1 is a narrow ring of dust emission, so we model this ring to derive constraints on structure and reveal any lower-level emission. For both continuum and CO we use a simple power-law density model, where the dust or gas lies between two limiting radii and and where the volume density is a power law function of radius . The density is specified in a given pixel in the cube, and the vertical scale height is a fixed fraction of the radial distance, so the surface density is . The vertical density structure is Gaussian with the scale height fixed to for all models, as for a nearly face-on disc this parameter is poorly constrained. For the continuum model we found that the fit was significantly improved if the disc inner edge has a small eccentricity , which was implemented by varying as a function of azimuth. Further parameters are the sky offsets and , the disc position angle East of North and inclination , and the argument of pericentre . The images are scaled by the total flux (in the 2d image for continuum, or the 3d cube for CO). There are therefore eight parameters for the continuum model (, , , , , , , , , and ). The density is multiplied by an emission function that mimics the Rayleigh-Jeans tail of a blackbody (i.e. ). The radial dependence of this function is largely arbitrary as it is degenerate with , and while it is a reasonable approximation for the dust seen in the continuum, the temperature dependence for CO may be different. For the CO model the eccentric inner edge parameters and are not necessary as the s/n is much lower, but an additional parameter, the systemic velocity of HD 98800 BaBb, , is needed. We assume the CO orbits a single point mass with the combined mass of HD 98800BaBb of 1.28 [17].
While it is likely that the CO and dust are optically thick we found that our models were sufficient to reproduce the data. We tried modelling the data with a simple optical depth prescription where the observed surface brightness in the model sky images was attenuated by a further free parameter via (i.e. is the surface brightness at which the emission becomes optically thick), but we found that these models were consistent with (and the other parameters unchanged) and therefore that this additional complication is not necessary to obtain constraints on the disc extent and spatial orientation.
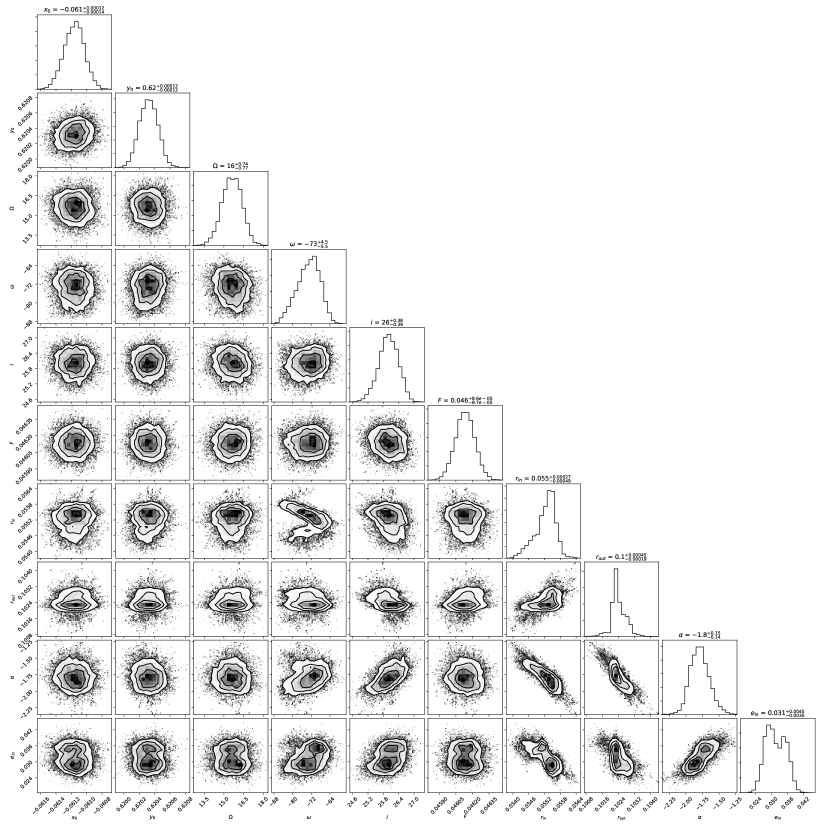
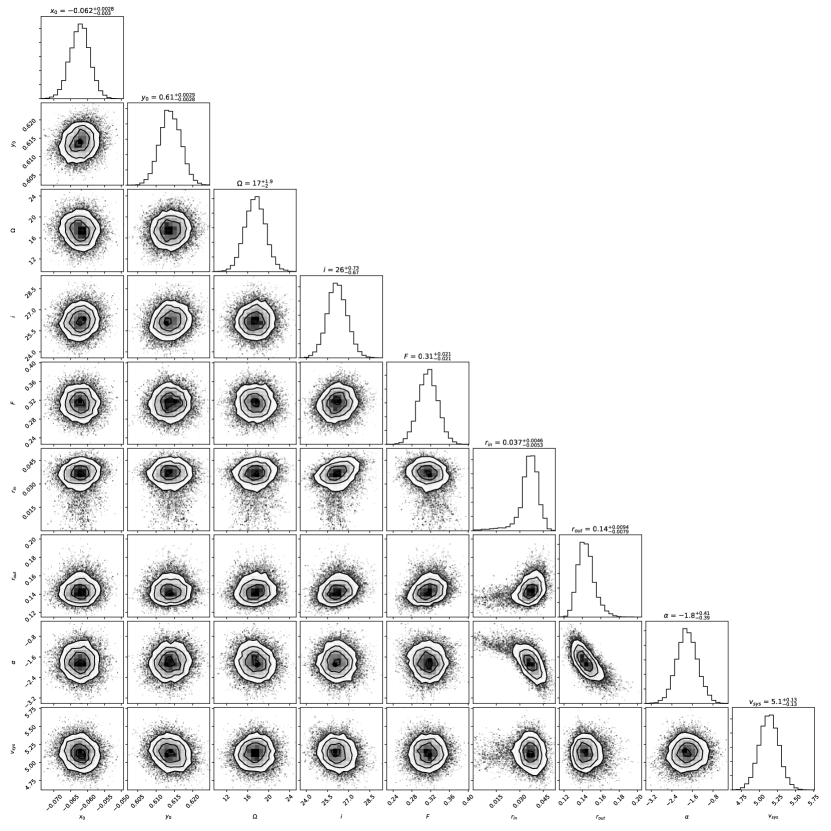
Continuum modelling results: The best fitting continuum model was found using 64 ‘walkers’ (parallel MCMC chains) run for 1000 steps (having discarded a prior ‘burn-in’ run of 1000 steps). The posterior distributions and their correlations are shown in Figure 4. The y offset is relatively large because the observation phase centre is offset from BaBb as described above. The main parameters of interest here are the disc orientation and , and the dust extent from to , which are discussed in the main text.
The flux density from the ring of 46 mJy can be converted to a dust mass, if the emission is assumed to be optically thin. Using equation 5 of ref [39] (which assumes an opacity of 1.7 cm2 g-1) and assuming a dust temperature of 160K derived from photometry over a range of wavelengths [20], the result is . Whether the dust ring is actually optically thick, and therefore whether the dust mass is underestimated, is uncertain; the flux expected from a ring of uniform surface brightness extending from 2.5 to 4.5au at a constant temperature of 160K is 130 mJy. This estimate does not mean the dust is optically thin however, as the surface density profile is found to be decreasing with radius. The bulk of the dust emission may therefore be concentrated in an optically thick region that is narrower than the best-fit 2au width, an issue that can be resolved with higher spatial resolution observations.
Initial attempts to model the continuum with axisymmetric models left asymmetric residuals suggestive of an offset near the inner disc edge, which motivated the use of an eccentric inner disc edge. While this parameterisation may not be representative of the true structure (which could for example be similar to the simulations shown in Figure 10), our finding that the best-fit is significantly greater than zero shows that the disc is not axisymmetric, and that this asymmetry lies near the inner disc edge. The position angle of the pericentre is given by the parameter ; as it is measured from the ascending node the best-fit value of means that the disc is closest to the binary towards the North-West (i.e. a position angle of approximately ). It is likely that the preference for a non-zero inner edge eccentricity results from perturbations from the inner binary, and the structure may be characterized in more detail with higher resolution imaging.
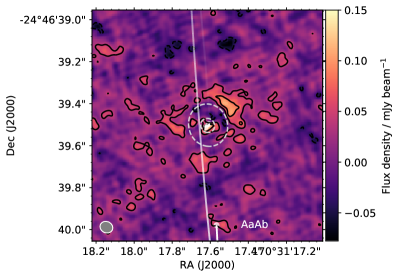
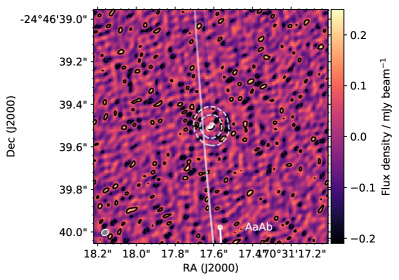
Residual images are shown in Figure 5, which shows that our model reproduces nearly all of the observed continuum structure. The peak s/n in the original naturally weighted continuum image for the same spectral window is 300, meaning that the residuals are at most only 1% of the peak. Some emission remains beyond the bright ring at 2-4, suggestive of low-level dust emission that might be recovered more strongly in lower resolution images. Some residual emission is also seen interior to the ring, which might arise from dust entrained in gas that is flowing towards and accreting onto the inner binary, and be related to our finding that the inner disc edge is asymmetric. Accreting material may provide an explanation for the facts that HD 98800 was reported to be photometrically variable by Hipparcos [40], and that HD 98800B suffers significantly more dust extinction than A [40, 41, 17, 21].


CO modelling results: Channel maps near the systemic velocity of HD 98800BaBb are shown in the left panel of Figure 6. The best fitting CO velocity model was found using 64 walkers run for 1000 steps, where 1000 prior steps were discarded as a burn-in. The posterior distributions and their correlations are shown in Figure 7. The residuals after subtraction of the best-fitting model are shown in the right panel of Figure 6. The CO disc orientation is consistent with the continuum model results shown in Figure 4, but the CO disc covers a greater radial extent, from 1.6 to 6.4au compared to 2.5 to 4.6au.
The peak level of channel emission in Figure 6 is approximately 5 mJy beam-1, which we find is consistent with that expected from optically thick CO at an excitation temperature of 70K. A lower excitation temperature would yield a lower flux than observed, while a higher excitation temperature would yield a higher flux, or could originate from optically thin CO.
We can estimate a minimum CO mass by assuming that the CO emission is marginally optically thick () with an excitation temperature of 70K (i.e. this mass estimate only applies if ). The best-fit total CO flux of 0.31 Jy km s-1 is then equivalent to a mass of . If we assume that the disc is primordial and has a standard H2/12CO ratio of 104, then the total gas mass is roughly 0.28, similar to the dust mass.
In terms of the dust to gas mass ratio, the empirical evidence for which dominates remains uncertain because i) even if both are optically thick, the dust optical depth could be much greater than the CO optical depth and thus the dust mass greater than the gas mass (or vice versa), ii) the CO excitation temperature may be higher than our 70K estimate, in which case the gas would be optically thin and the mass lower than our minimal estimate, and iii) the ratio of molecular hydrogen to CO could be different to our assumed value, in which cas the total gas mass could be higher or lower than our estimate, even if the CO mass is correct. Further observations that target other 12CO transitions, and optically thinner lines such as 13CO and C18O, are needed to provide further information on the disc optical depth and gas temperature.
0.3 Comparison with VLA
Ribas et al. (ref [23]) imaged the HD 98800B disk with the Karl G. Jansky Vary Large Array (VLA), and derived constraints on the continuum disk size and orientation (they did not detect CO). They report a disk inclination of 40-45∘ at a position angle of 0-10∘, but do not quote formal confidence intervals, and do not discuss how this orientation compares to the binary orbital planes.111The original version posted to arXiv had PA=90-100∘, but we verified with the authors that this is a typo. We modelled the VLA image using the model described above (though with fixed in the range -1 to 0, as the s/n is much lower), and find a disk extent consistent with that derived from ALMA, and an inclination of and position angle , also consistent with our results.
0.4 Orbits
Ref [42] find that the systemic velocity of AaAb (12.75 km s-1) was more positive than BaBb (5.73 km s-1) in the early 1990s, when A and B were near maximum elongation. Thus, at that time BaBb was moving towards Earth relative to the system centre of mass. The ascending node of the AB orbit (measured East of North) as reported in previous literature is therefore incorrect and should be near 4.2∘, not 184.2∘ [42, 43]. Thus, as indicated in the figures, AaAb will go behind the disc in 2026. AaAb being a binary, time-series photometry may reveal further details about the disc structure and AaAb orbit in a manner similar to KH 15D [44, 45].
Using the current best-fit visual orbit for AB [43], the radial velocity of BaBb should be higher at the epoch of our ALMA observations (2017.874) than in the last few decades, because it is now closer to AaAb and moving more slowly towards Earth. However, the velocity of 5.1 km s-1 at epoch 2017.874 is lower than 5.73 km s-1 at 1991.96 found for BaBb by ref [42]. That is, relative to the system centre of mass BaBb is moving towards Earth more rapidly now than it was in the 1990s. A possible reason is that the orbit is more eccentric than the best-fit visual orbit suggests.
To derive an updated orbit, we obtained previous observations of the AB separation and position angle from the Washington Double Star catalogue (WDS) [46]. The system does not appear in Gaia DR2, presumably because of the multiple nature of the system. These data extend back to the early 1900s, and all observations before 2009 have no uncertainties. Based on the scatter from fitting results, we estimated pre-1950 observations to have position angle uncertainties of 2∘, 1950-2009 observations to have uncertainties of 1∘, and all pre-2009 separations to have uncertainties of 0.1”. Post-2009 position angle uncertainties were assumed to be 0.5∘, the estimated systematic uncertainty [43], and separation uncertainties were used as given. Two further observations are the km s-1 difference between the radial velocity of A and B at epoch 1991.96, and the -0.61 km s-1 difference between the 1991.96 and 2017.874 velocities for B, which assumes that the radial velocity of B is the same as the systemic velocity derived from the CO modelling.
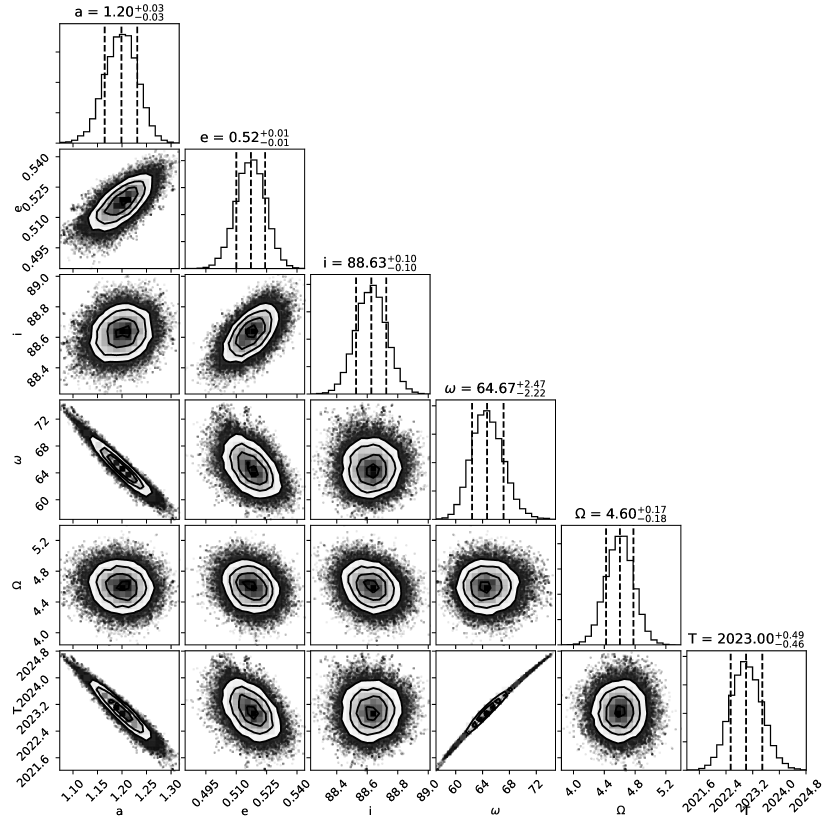
To fit an orbit to these data we compute the position angles, separations, and 1991.96 and 2017.874 radial velocities, from which we derive a . As with the visibility modelling described above we use the python emcee package to find the best-fitting orbits, and the results are shown in Figure 8. The fitted parameters are the semi-major axis , the eccentricity , the inclination , the argument of pericentre , the ascending node (measured anti-clockwise from North), the time of pericentre passage , and the mass of A . The mass of A is estimated as [47, 21], and is included as a parameter in the fitting with a prior reflecting this uncertainty. We assumed a mass of 1.28 for B, which is well constrained [17].
Introduction of the additional radial velocity constraint changes the orbital parameters compared to the most recent published orbit [43], which is similar to the most recent orbit derived by A. Tokovinin (and which has been updated with the correct ascending node, http://www.ctio.noao.edu/atokovin/stars). The main difference relative to these previous orbits are an increased orbital period (251 vs. 206 years) and eccentricity (0.52 vs. 0.43), and that uncertainties can now be assigned to each parameter; currently the AB orbit is graded ‘5’ in the 6th Orbit Catalog [48], meaning that the orbital elements ‘may not even be approximately correct’ (however the proximity to our updated solution suggests that in hindsight a higher grade could have been assigned). There remain small systematic offsets in the residual separations and position angles, so it is possible that the orbit will change somewhat with further monitoring. We use our best-fit values for the AB orbit in the -body simulations below.

0.5 Simulations
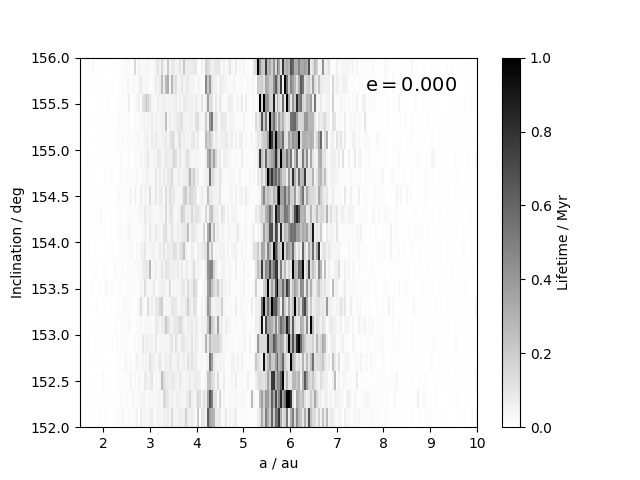
-body: We simulated the system as gas-free using the REBOUND code [49], to test where particles could orbit in the absence of stabilising forces that would arise if the gas mass is comparable to or greater than the dust mass. We modelled the inner binary BaBb using the best-fit parameters from ref [17], the outer binary AaAb as a single object, the AB orbit as derived above, and all other particles as massless. The disc appears largely circular based on the continuum modelling, so we initialized particles on circular orbits in one of the two possible disc orientations at a range of true anomalies, and ran simulations for 1Myr. We used the ‘whfast’ integrator [50] with a time step of 1/20th of the BaBb orbital period. Particles with distances more than 2000 au from the system centre of mass are removed and their removal time recorded; while the integration method does not allow collisions nor compute close encounters accurately, these events soon lead to particle ejection anyway.
The results are shown in Figure 9, and show that in the gas-free case test particles do not survive for 1Myr in the moderately inclined disc configuration. Particles in the polar configuration do survive for up to 1Myr, but only at semi-major axes between 5 and 7 au and a very narrow band near 4au, and neither region is consistent with the extent seen in the continuum with ALMA. In both configurations particles beyond 7 au are typically removed in 5000 years; comparing this time to the 250 year period of the AB binary suggests that short-term interactions are the cause (i.e. the removal time is tens of AB orbits, not hundreds or thousands which would suggest long-term secular effects), and therefore that 7 au is the approximate outer disc truncation radius imposed by A.
These results therefore indicate that gas-free dynamics do not apply to the dust observed between 2.5 to 4.6 au around HD 98800BaBb, and that the dust is almost certainly strongly influenced and stabilized by gas. The disc is therefore probably gas-rich, and given the detection of hydrogen gas emission [28], likely still in the primordial protoplanetary disc phase.
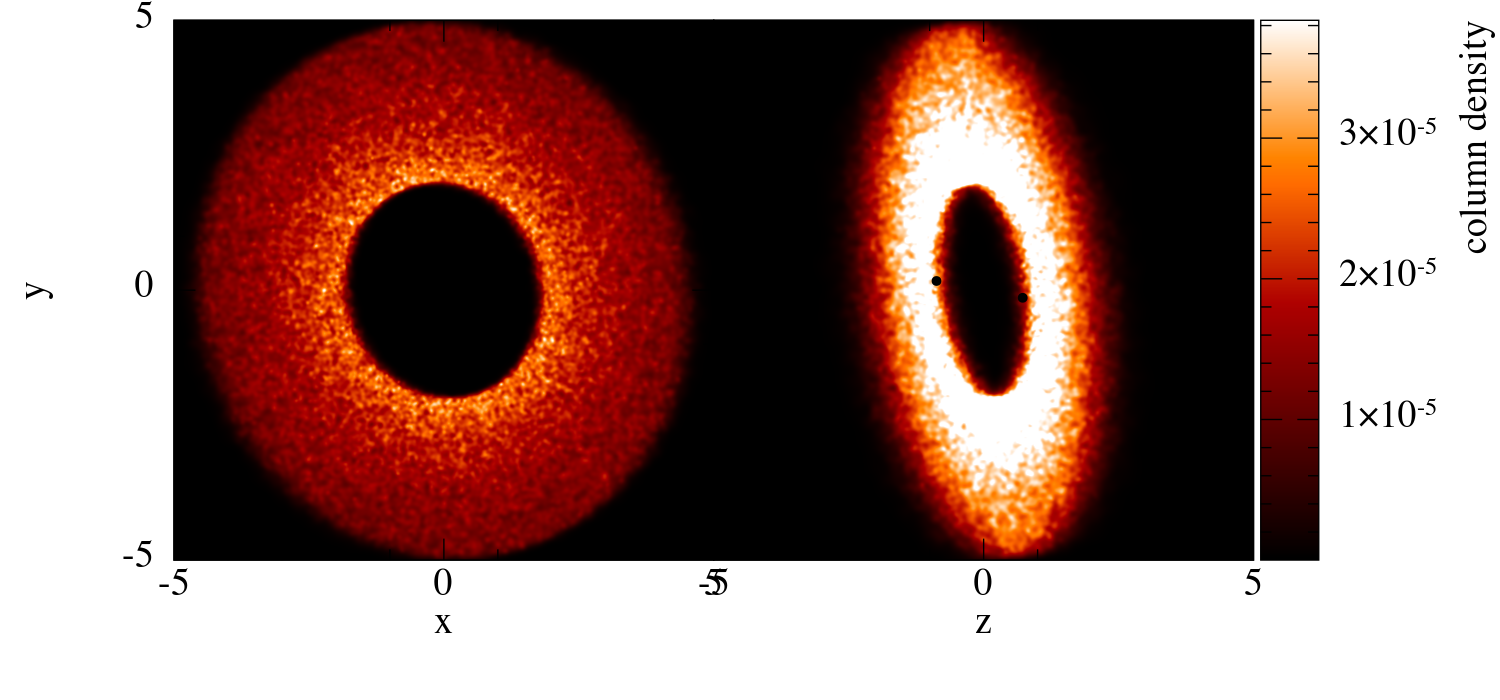

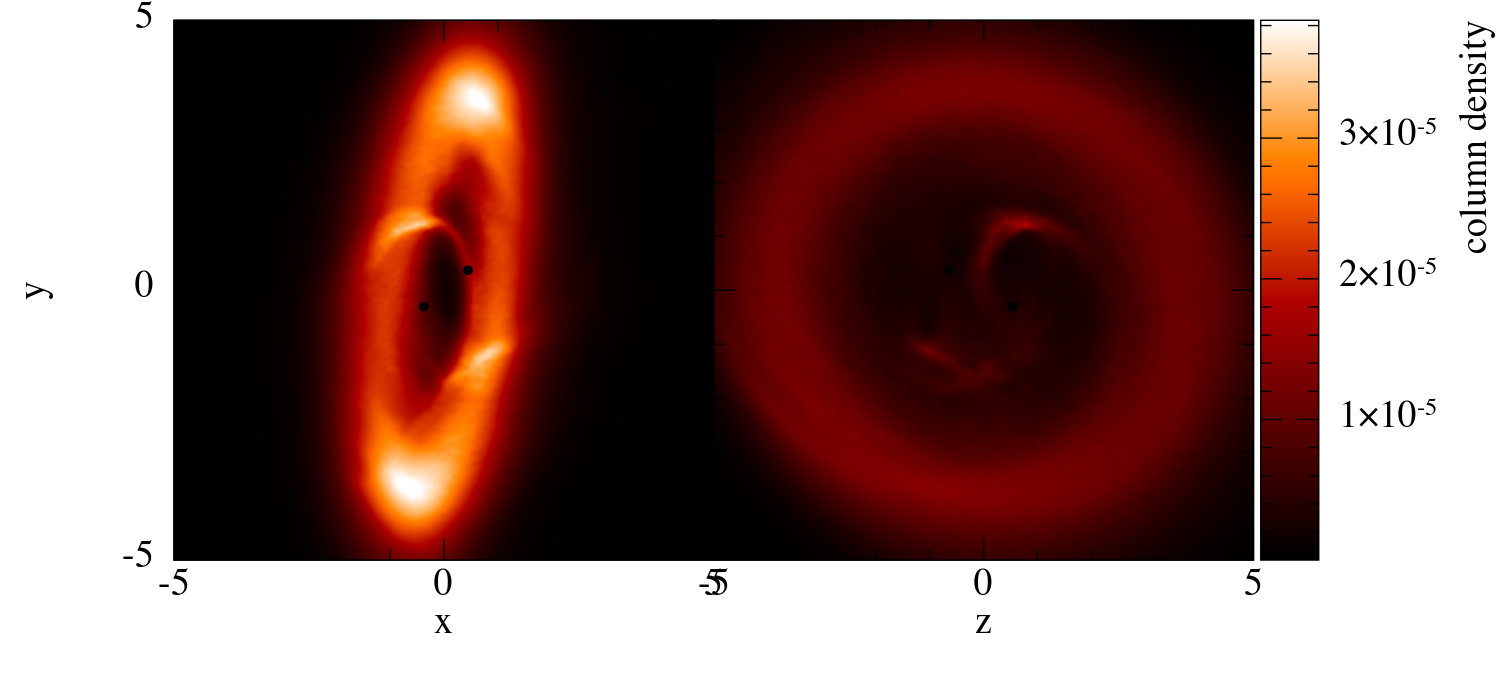


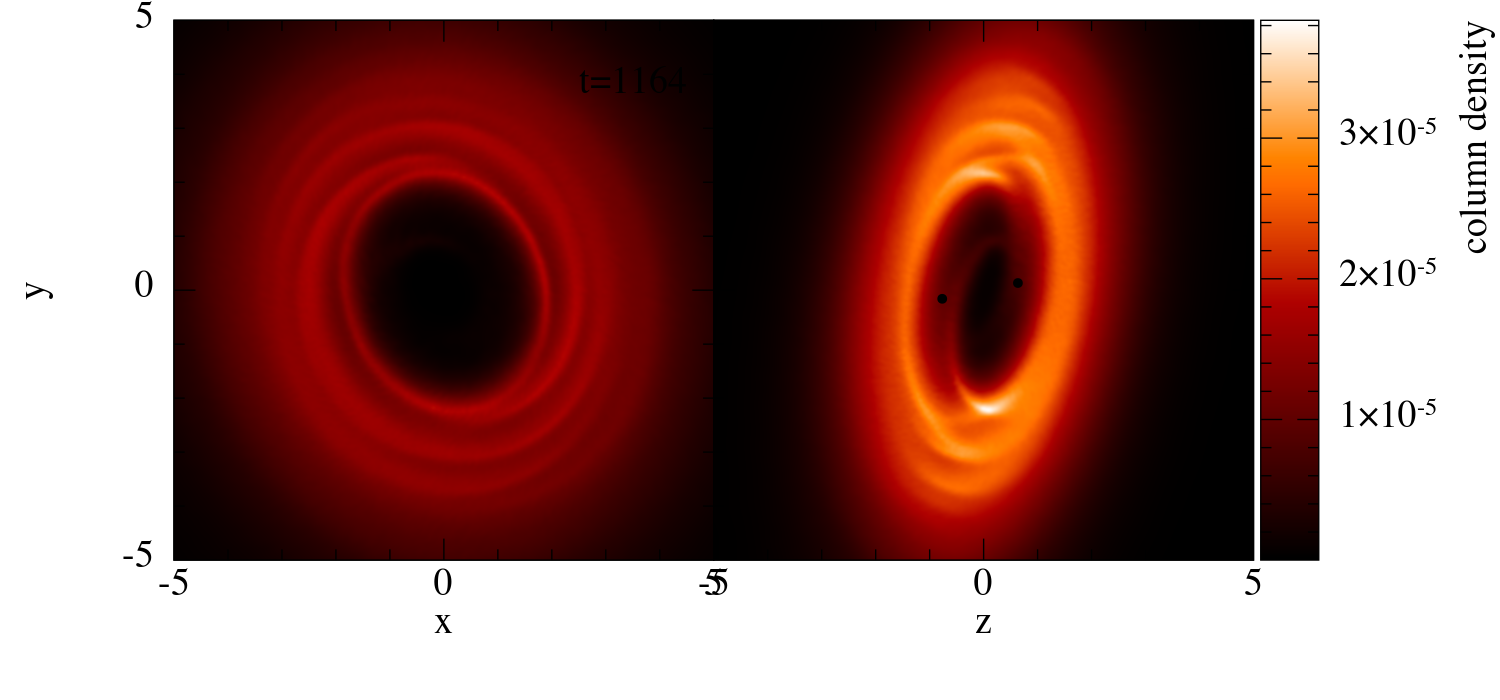
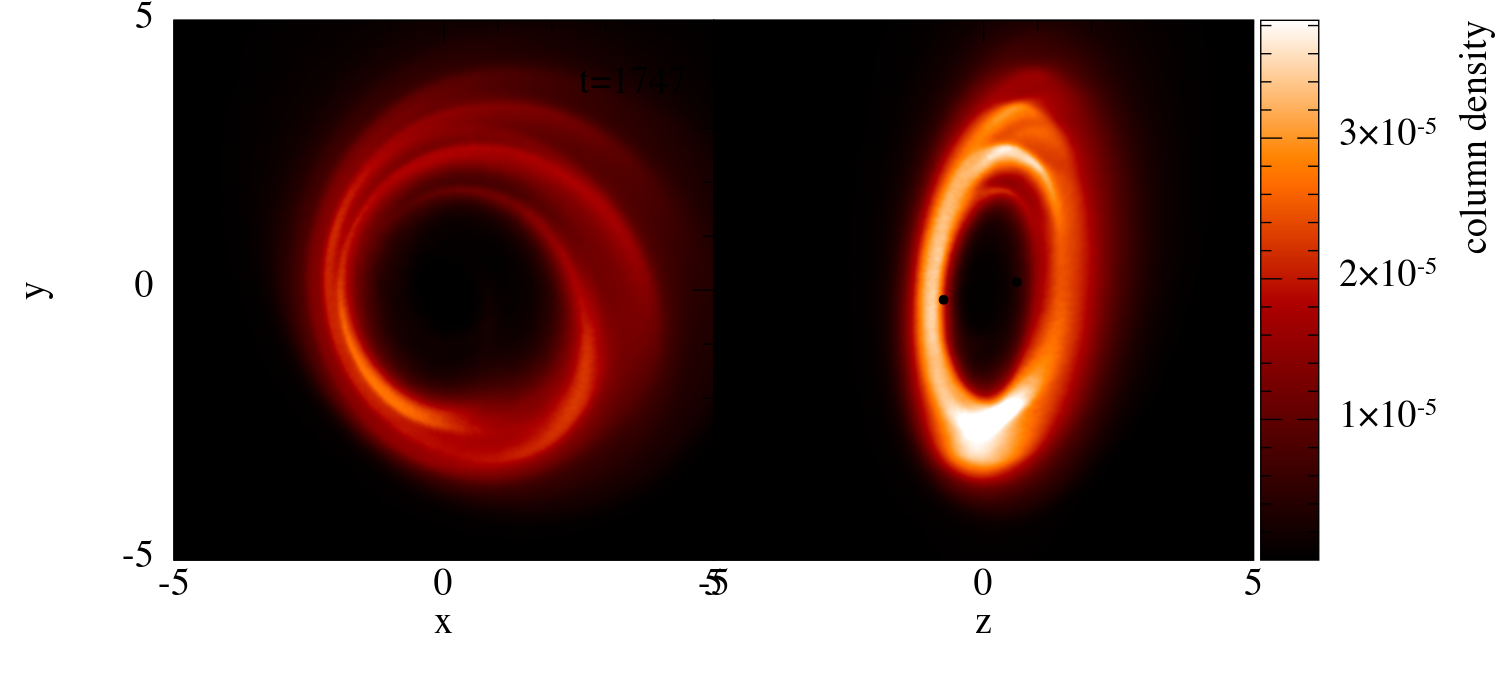
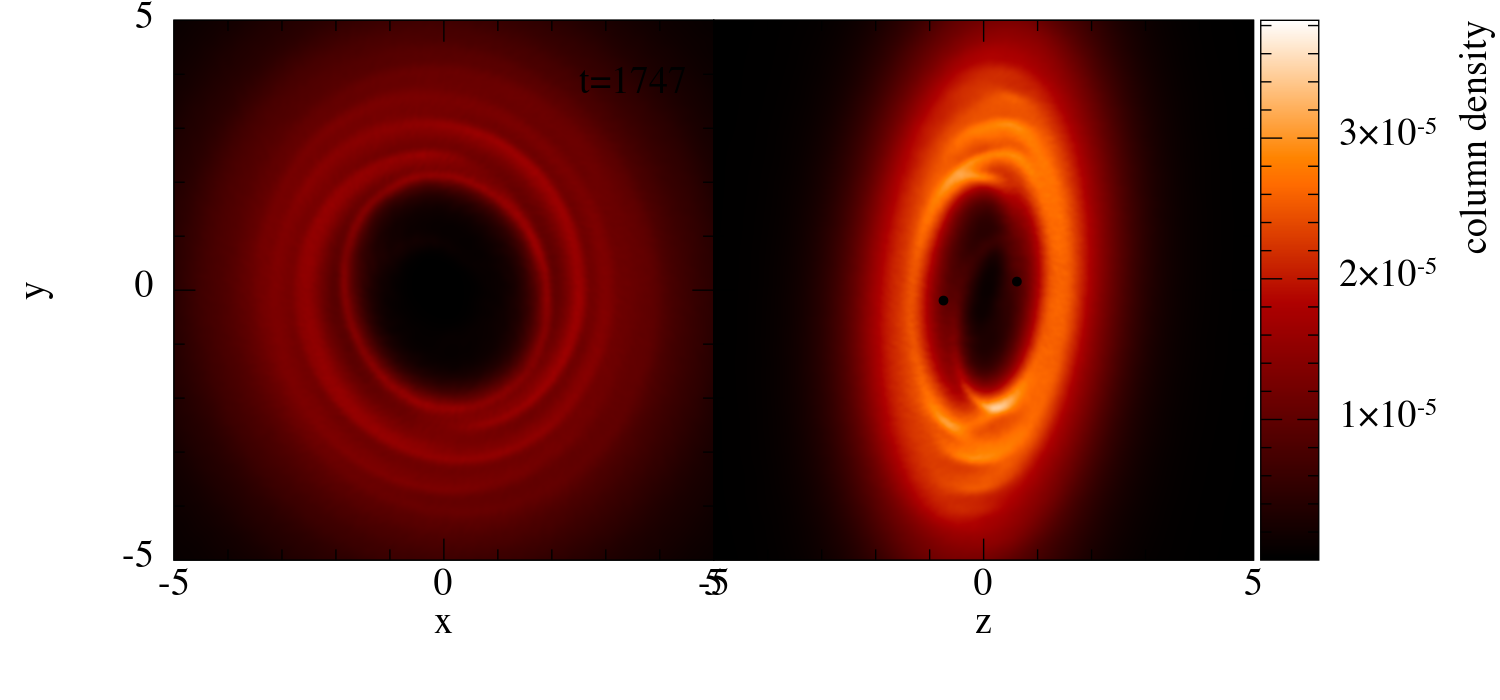

Smoothed Particle Hydrodynamics: We used Phantom [51] to simulate the response of the two possible disc configurations to perturbations from the inner binary, assuming a gas-rich protoplanetary disc. We did not include the outer binary, as the disc was found to change orientation on a shorter timescale (100 years) than the period of the outer binary (250 years). This timescale difference of course does not mean that A has no effect on the disc around B, since test particles in the polar configuration are truncated at around 7 au, which is near the outer extent of the detected CO.
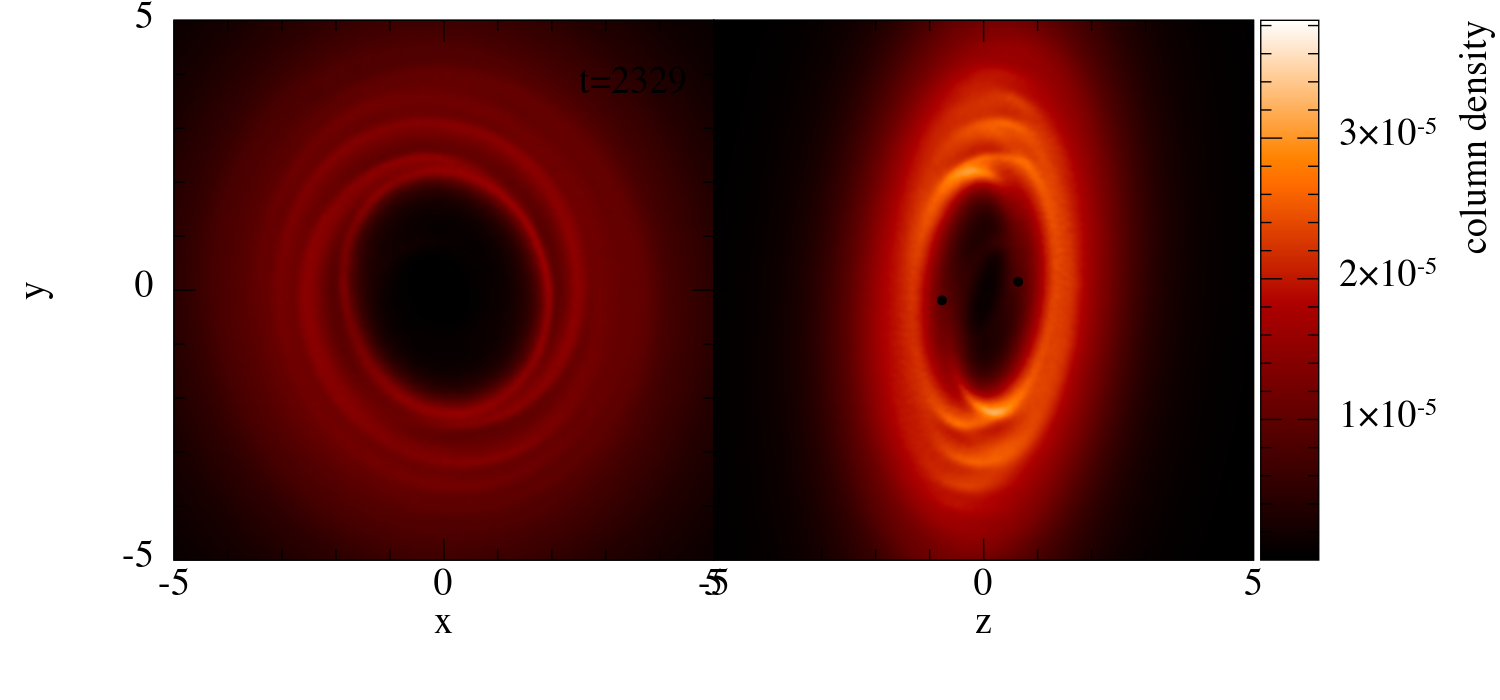
For the disc, the simulations used the same SPH parameters as ref [6] and 300,000 particles. The results of simulations of the two configurations are shown in Figure 10, where the left set of panels shows the moderately misaligned case, and the right panels the polar case (the images were created using splash [52]). In each pair of images, the left subpanels show the disc density projected onto the sky plane, and the right panel a side view. The time evolution (moving down the panels) shows that the polar configuration does not significantly change orientation, while the moderately misaligned case does. In fact, the moderately misaligned disc eventually reaches the polar configuration, though has been significantly perturbed and disrupted in the process. Thus, we conclude that the polar disc configuration is by far the best interpretation of the data, as the lifetime of the disc in the moderately misaligned case is very short relative to the stellar age of ten million years. Because the time taken to re-orient the disc is short relative to the AB orbital period, and the effect of A where the disc is observed is minimal, including A in the simulations would not change this conclusion.
Some spiral structure has been induced in the disc in the polar case; if the HD 98800 disc has similar structure these perturbations may be the cause of the asymmetry that requires the continuum model to have non-zero .
0.6 Population estimate of disc orientations
To gauge whether circumbinary discs in the polar configuration might be common, we make a simple population estimate. The assumptions are that i) the discs do not have sufficient mass to re-orient the binary (i.e. test-particle dynamics apply), ii) discs initially have uniformly distributed orientations with respect to the binary, iii) the binary eccentricity distribution is uniform between 0 and 0.8 [34]. The most uncertain of these is ii); if circumbinary discs are more often initially coplanar with their binaries the estimated fraction would be lower than we find below.
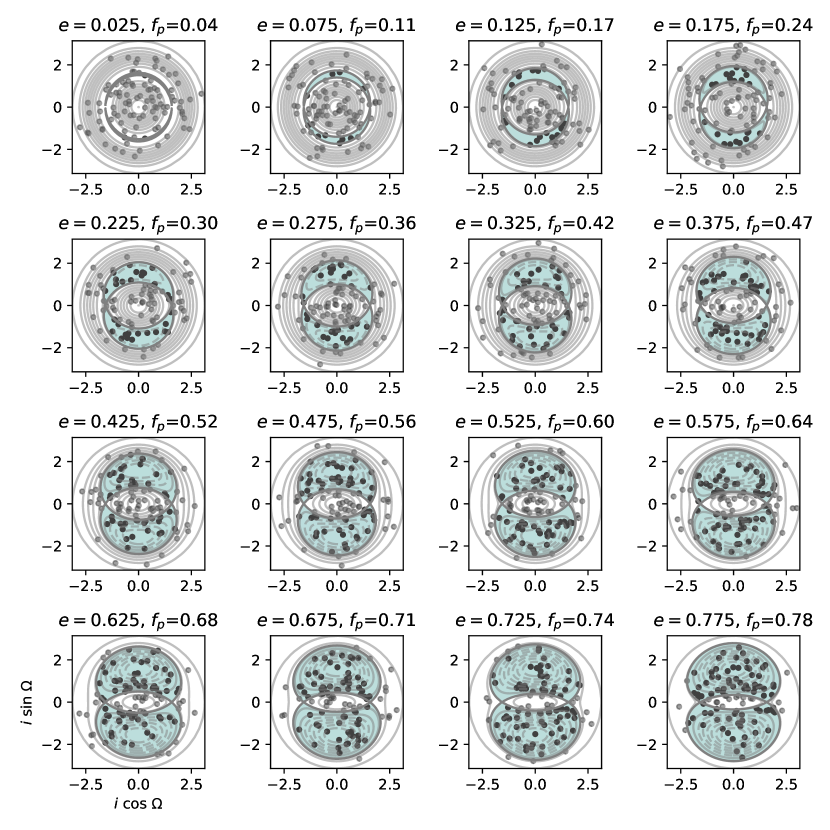
The evolution of a low-mass circumbinary disc can be visualized in the , plane with plots like those shown in Figure 11, where the constant of motion for a given disc is [10]
| (1) |
The dividing line (‘separatrix’) between orbits that are coplanar (i.e. those that precess about the binary orbital plane) and polar (i.e. those that precess about a plane perpendicular to the binary pericentre direction) is given by . We assume here that the region of parameter space in which a disc initially starts determines the outcome; dissipation causes the disc plane to relax to coplanar (0,0), or polar (0,), and discs do not cross the separatrix [6, 11].
To estimate the fraction of discs on coplanar and polar orbits for a given eccentricity, we populate the , plane with orbits. Orbits are uniformly distributed by generating two random numbers and between 0 and 1 for each orbit, from which we obtain and . We then calculate for each of the orbits, and find the fraction that lie on polar trajectories (i.e. the fraction in the grey region in Figure 11).
We then repeat the calculation at a series of 16 binary eccentricities between 0.0 and 0.8, as shown in Figure 11. The overall fraction of discs that should evolve to polar configurations given our assumptions is the average value across this range of eccentricities, and found to be 46%. The systems that evolve to polar configurations are heavily weighted towards high eccentricities, as the fraction of parameter space where this happens is much larger. As noted in the main text, the eccentricities of the binaries that host circumbinary planets are typically small, and higher eccentricity binaries are the most promising focus for misaligned circumbinary planet searches.
0.7 Data and code availability
The ALMA data used in this study are available in the ALMA Science Archive at http://almascience.eso.org/aq/.
The post-processing, modelling, and other scripts used in this study are available on github at https://github.com/drgmk.
References
- [1] Doyle, L. R. et al. Kepler-16: A Transiting Circumbinary Planet. Science 333, 1602 (2011). URL http://adsabs.harvard.edu/abs/2011Sci...333.1602D. 1109.3432.
- [2] Welsh, W. F. et al. Transiting circumbinary planets Kepler-34 b and Kepler-35 b. Nature 481, 475–479 (2012). URL http://cdsads.u-strasbg.fr/abs/2012Natur.481..475W. 1204.3955.
- [3] Kostov, V. B. et al. Kepler-1647b: The Largest and Longest-period Kepler Transiting Circumbinary Planet. ApJ 827, 86 (2016). 1512.00189.
- [4] Armstrong, D. J. et al. On the abundance of circumbinary planets. MNRAS 444, 1873–1883 (2014). URL http://adsabs.harvard.edu/abs/2014MNRAS.444.1873A. 1404.5617.
- [5] Martin, D. V. & Triaud, A. H. M. J. Planets transiting non-eclipsing binaries. A&A 570, A91 (2014). URL http://cdsads.u-strasbg.fr/abs/2014A&A...570A..91M. 1404.5360.
- [6] Martin, R. G. & Lubow, S. H. Polar Alignment of a Protoplanetary Disk around an Eccentric Binary. ApJ 835, L28 (2017). URL http://cdsads.u-strasbg.fr/abs/2017ApJ...835L..28M. 1702.00545.
- [7] Martin, D. V., Mazeh, T. & Fabrycky, D. C. No circumbinary planets transiting the tightest Kepler binaries - a possible fingerprint of a third star. MNRAS 453, 3554–3567 (2015). URL http://cdsads.u-strasbg.fr/abs/2015MNRAS.453.3554M. 1505.05749.
- [8] Asensio-Torres, R. et al. SPOTS: The Search for Planets Orbiting Two Stars. III. Complete Sample and Statistical Analysis. ArXiv e-prints (2018). 1807.08687.
- [9] Bailey, V. et al. HD 106906 b: A Planetary-mass Companion Outside a Massive Debris Disk. ApJ 780, L4 (2014). URL http://adsabs.harvard.edu/abs/2014ApJ...780L...4B. 1312.1265.
- [10] Farago, F. & Laskar, J. High-inclination orbits in the secular quadrupolar three-body problem. MNRAS 401, 1189–1198 (2010). URL http://adsabs.harvard.edu/abs/2010MNRAS.401.1189F. 0909.2287.
- [11] Zanazzi, J. J. & Lai, D. Inclination evolution of protoplanetary discs around eccentric binaries. MNRAS 473, 603–615 (2018).
- [12] Martin, R. G. & Lubow, S. H. Polar alignment of a protoplanetary disc around an eccentric binary - II. Effect of binary and disc parameters. MNRAS 479, 1297–1308 (2018). 1806.08388.
- [13] Kennedy, G. M. et al. 99 Herculis: host to a circumbinary polar-ring debris disc. MNRAS 421, 2264–2276 (2012). URL http://adsabs.harvard.edu/abs/2012MNRAS.421.2264K. 1201.1911.
- [14] van Leeuwen, F. Validation of the new Hipparcos reduction. A&A 474, 653–664 (2007). URL http://cdsads.u-strasbg.fr/abs/2007A&A...474..653V. 0708.1752.
- [15] Kastner, J. H., Zuckerman, B., Weintraub, D. A. & Forveille, T. X-ray and molecular emission from the nearest region of recent star formation. Science 277, 67–71 (1997). URL http://adsabs.harvard.edu/abs/1997Sci...277...67K.
- [16] Barrado Y Navascués, D. On the age of the TW Hydrae association and 2M1207334-393254. A&A 459, 511–518 (2006). URL http://cdsads.u-strasbg.fr/abs/2006A&A...459..511B. astro-ph/0608478.
- [17] Boden, A. F. et al. Dynamical Masses for Low-Mass Pre-Main-Sequence Stars: A Preliminary Physical Orbit for HD 98800 B. ApJ 635, 442–451 (2005). URL http://cdsads.u-strasbg.fr/abs/2005ApJ...635..442B. astro-ph/0508331.
- [18] Walker, H. J. & Wolstencroft, R. D. Cool circumstellar matter around nearby main-sequence stars. PASP 100, 1509–1521 (1988). URL http://adsabs.harvard.edu/abs/1988PASP..100.1509W.
- [19] Skinner, C. J., Barlow, M. J. & Justtanont, K. Silicate dust in a Vega-excess system. MNRAS 255, 31P–36P (1992). URL http://adsabs.harvard.edu/abs/1992MNRAS.255P..31S.
- [20] Zuckerman, B. & Becklin, E. E. Infrared observations of the remarkable main-sequence star HD 98800. ApJ 406, L25–L28 (1993). URL http://adsabs.harvard.edu/abs/1993ApJ...406L..25Z.
- [21] Akeson, R. L. et al. The Circumbinary Disk of HD 98800B: Evidence for Disk Warping. ApJ 670, 1240–1246 (2007). URL http://adsabs.harvard.edu/abs/2007ApJ...670.1240A. 0708.2390.
- [22] Andrews, S. M. et al. Truncated Disks in TW Hya Association Multiple Star Systems. ApJ 710, 462–469 (2010). URL http://cdsads.u-strasbg.fr/abs/2010ApJ...710..462A. 0912.3537.
- [23] Ribas, Á., Macías, E., Espaillat, C. C. & Duchêne, G. Long-lived Protoplanetary Disks in Multiple Systems: The VLA View of HD 98800. ApJ 865, 77 (2018). 1808.02493.
- [24] Furlan, E. et al. HD 98800: A 10 Myr Old Transition Disk. ApJ 664, 1176–1184 (2007). URL http://cdsads.u-strasbg.fr/abs/2007ApJ...664.1176F. 0705.0380.
- [25] Wyatt, M. C. et al. Transience of Hot Dust around Sun-like Stars. ApJ 658, 569–583 (2007). URL http://cdsads.u-strasbg.fr/abs/2007ApJ...658..569W. astro-ph/0610102.
- [26] Verrier, P. E. & Evans, N. W. HD 98800: a most unusual debris disc. MNRAS 390, 1377–1387 (2008). URL http://adsabs.harvard.edu/abs/2008MNRAS.390.1377V. 0807.5105.
- [27] Riviere-Marichalar, P. et al. Gas and dust in the TW Hydrae association as seen by the Herschel Space Observatory. A&A 555, A67 (2013). URL http://cdsads.u-strasbg.fr/abs/2013A&A...555A..67R. 1306.0328.
- [28] Yang, H. et al. A Far-ultraviolet Atlas of Low-resolution Hubble Space Telescope Spectra of T Tauri Stars. ApJ 744, 121 (2012). URL http://cdsads.u-strasbg.fr/abs/2012ApJ...744..121Y. 1205.4789.
- [29] Haisch, K. E., Jr., Lada, E. A. & Lada, C. J. Disk Frequencies and Lifetimes in Young Clusters. ApJ 553, L153–L156 (2001). URL http://cdsads.u-strasbg.fr/abs/2001ApJ...553L.153H. astro-ph/0104347.
- [30] Andrews, S. M. et al. The TW Hya Disk at 870 m: Comparison of CO and Dust Radial Structures. ApJ 744, 162 (2012). URL http://cdsads.u-strasbg.fr/abs/2012ApJ...744..162A. 1111.5037.
- [31] Facchini, S., Birnstiel, T., Bruderer, S. & van Dishoeck, E. F. Different dust and gas radial extents in protoplanetary disks: consistent models of grain growth and CO emission. A&A 605, A16 (2017). 1705.06235.
- [32] Bate, M. R. On the diversity and statistical properties of protostellar discs. MNRAS 475, 5618–5658 (2018). 1801.07721.
- [33] Brinch, C., Jørgensen, J. K., Hogerheijde, M. R., Nelson, R. P. & Gressel, O. Misaligned Disks in the Binary Protostar IRS 43. ApJ 830, L16 (2016). 1610.03626.
- [34] Raghavan, D. et al. A Survey of Stellar Families: Multiplicity of Solar-type Stars. ApJS 190, 1–42 (2010). URL http://cdsads.u-strasbg.fr/abs/2010ApJS..190....1R. 1007.0414.
- [35] Guilloteau, S., Dutrey, A., Piétu, V. & Boehler, Y. A dual-frequency sub-arcsecond study of proto-planetary disks at mm wavelengths: first evidence for radial variations of the dust properties. A&A 529, A105 (2011). URL http://cdsads.u-strasbg.fr/abs/2011A&A...529A.105G. 1103.1296.
- [36] Walker, H. J. & Butner, H. M. Follow-up observations of -pic-like stars. Ap&SS 224, 389–393 (1995). URL http://adsabs.harvard.edu/abs/1995Ap&SS.224..389W.
- [37] Foreman-Mackey, D., Hogg, D. W., Lang, D. & Goodman, J. emcee: The MCMC Hammer. PASP 125, 306 (2013). URL http://cdsads.u-strasbg.fr/abs/2013PASP..125..306F. 1202.3665.
- [38] Tazzari, M., Beaujean, F. & Testi, L. GALARIO: a GPU accelerated library for analysing radio interferometer observations. MNRAS 476, 4527–4542 (2018). 1709.06999.
- [39] Holland, W. S. et al. SONS: The JCMT legacy survey of debris discs in the submillimetre. MNRAS 470, 3606–3663 (2017). URL http://cdsads.u-strasbg.fr/abs/2017MNRAS.470.3606H. 1706.01218.
- [40] Soderblom, D. R. et al. HD 98800: A Unique Stellar System of Post-T Tauri Stars. ApJ 498, 385–393 (1998). URL http://cdsads.u-strasbg.fr/abs/1998ApJ...498..385S.
- [41] Tokovinin, A. A. The visual orbit of HD 98800. Astronomy Letters 25, 669–671 (1999).
- [42] Torres, G., Stefanik, R. P., Latham, D. W. & Mazeh, T. Study of Spectroscopic Binaries with TODCOR. IV. The Multiplicity of the Young Nearby Star HD 98800. ApJ 452, 870 (1995). URL http://cdsads.u-strasbg.fr/abs/1995ApJ...452..870T.
- [43] Tokovinin, A., Mason, B. D. & Hartkopf, W. I. Speckle Interferometry at SOAR in 2012 and 2013. AJ 147, 123 (2014). URL http://cdsads.u-strasbg.fr/abs/2014AJ....147..123T. 1403.4970.
- [44] Kearns, K. E. & Herbst, W. Additional Periodic Variables in NGC 2264. AJ 116, 261–265 (1998). URL http://cdsads.u-strasbg.fr/abs/1998AJ....116..261K.
- [45] Winn, J. N. et al. The Orbit and Occultations of KH 15D. ApJ 644, 510–524 (2006). URL http://cdsads.u-strasbg.fr/abs/2006ApJ...644..510W. astro-ph/0602352.
- [46] Mason, B. D., Wycoff, G. L., Hartkopf, W. I., Douglass, G. G. & Worley, C. E. The 2001 US Naval Observatory Double Star CD-ROM. I. The Washington Double Star Catalog. AJ 122, 3466–3471 (2001).
- [47] Prato, L. et al. Keck Diffraction-limited Imaging of the Young Quadruple Star System HD 98800. ApJ 549, 590–598 (2001). URL http://cdsads.u-strasbg.fr/abs/2001ApJ...549..590P. astro-ph/0011135.
- [48] Hartkopf, W. I., Mason, B. D. & Worley, C. E. The 2001 US Naval Observatory Double Star CD-ROM. II. The Fifth Catalog of Orbits of Visual Binary Stars. AJ 122, 3472–3479 (2001).
- [49] Rein, H. & Liu, S.-F. REBOUND: an open-source multi-purpose N-body code for collisional dynamics. A&A 537, A128 (2012). URL http://adsabs.harvard.edu/abs/2012A&A...537A.128R. 1110.4876.
- [50] Rein, H. & Tamayo, D. WHFAST: a fast and unbiased implementation of a symplectic Wisdom-Holman integrator for long-term gravitational simulations. MNRAS 452, 376–388 (2015). 1506.01084.
- [51] Price, D. J. et al. Phantom: A Smoothed Particle Hydrodynamics and Magnetohydrodynamics Code for Astrophysics. PASA 35, e031 (2018). URL http://cdsads.u-strasbg.fr/abs/2017arXiv170203930P. 1702.03930.
- [52] Price, D. J. splash: An Interactive Visualisation Tool for Smoothed Particle Hydrodynamics Simulations. PASA 24, 159–173 (2007). URL http://cdsads.u-strasbg.fr/abs/2007PASA...24..159P. 0709.0832.
0.8 Acknowledgements
GMK is supported by the Royal Society as a Royal Society University Research Fellow. L.M. acknowledges support from the Smithsonian Institution as a Submillimeter Array (SMA) Fellow. OP is supported by the Royal Society Dorothy Hodgkin Fellowship. We thank A. Ribas for sharing the VLA image of HD 98800.
This paper makes use of the following ALMA data: ADS/JAO.ALMA#2017.1.00350.S. ALMA is a partnership of ESO (representing its member states), NSF (USA) and NINS (Japan), together with NRC (Canada), MOST and ASIAA (Taiwan), and KASI (Republic of Korea), in cooperation with the Republic of Chile. The Joint ALMA Observatory is operated by ESO, AUI/NRAO and NAOJ.
0.9 Author Contributions
GMK conceived the project, analysed the data, carried out the modelling, and wrote the manuscript. LM contributed gas calculations and provided advice on self-calibration. BMY set up and ran the -body simulations. DP provided advice on running the SPH simulations. All co-authors provided input on the manuscript.
0.10 Author Information
The authors declare that they have no competing interests. Correspondence and requests for materials should be addressed to g.kennedy@warwick.ac.uk.