Transience of hot dust around sun-like stars
Abstract
There is currently debate over whether the dust content of planetary systems is stochastically regenerated or originates in planetesimal belts evolving in quasi-steady state. In this paper a simple model for the steady state evolution of debris disks due to collisions is developed and confronted with the properties of the emerging population of 7 sun-like stars that have hot dust at AU. The model shows that there is a maximum possible disk mass at a given age, since more massive primordial disks process their mass faster. The corresponding maximum dust luminosity is , where is disk radius in AU and is system age in Myr. The majority (4/7) of the hot disks exceed this limit by a factor and so cannot be the products of massive asteroid belts, rather the following systems must be undergoing transient events characterized by an unusually high dust content near the star: Corvi, HD69830, HD72905 and BD+20307. It is also shown that the hot dust cannot originate in a recent collision in an asteroid belt, since there is also a maximum rate at which collisions of sufficient magnitude to reproduce a given dust luminosity can occur in a disk of a given age. For the 4 transient disks, there is at best a 1: chance of witnessing such an event compared with 2% of stars showing this phenomenon. Further it is shown that the planetesimal belt feeding the dust in these systems must be located further from the star than the dust, typically at AU. Other notable properties of the 4 hot dust systems are: two also have a planetesimal belt at AU ( Corvi and HD72905); one has 3 Neptune mass planets at AU (HD69830); all exhibit strong silicate features in the mid-IR. We consider the most likely origin for the dust in these systems to be a dynamical instability which scattered planetesimals inwards from a more distant planetesimal belt in an event akin to the Late Heavy Bombardment in our own system, the dust being released from such planetesimals in collisions and possibly also sublimation. Further detailed study of the planet, planetesimal and dust populations in these rare objects has the potential to uncover the chaotic evolutionary history of these systems and to shed light on the history of the solar system.
Subject headings:
circumstellar matter — planetary systems: formation1. Introduction
Planetesimal belts appear to be a common feature of planetary systems. There are two main belts in the solar system: the asteroid belt and the Kuiper belt. These belts inhabit the regions of the solar system where planetesimal orbits can remain stable over the 4.5 Gyr age of our system (Lecar et al. 2001). The larger planetesimals in the belts are continually grinding down feeding the smaller bodies in a process known as a collisional cascade which is slowly eroding the belts (Bottke et al. 2005). The smallest dust in the asteroid belt is acted on by radiation forces; P-R drag makes the dust spiral in toward the Sun making a disk known as the zodiacal cloud that the Earth sits in the middle of (Leinert & Grün 1990). A dust cloud is also predicted to arise from collisions amongst Kuiper belt objects (Liou & Zook 1999), although our information on this population is sparse (Landgraf et al. 2002) because its emission is masked by the zodiacal emission (Backman, Dasgupta & Stencel 1995) and few dust grains make it into the inner solar system (Moro-Martín & Malhotra 2003).
Many extrasolar systems also have such planetesimal belts, known as debris disks. These have been detected from their dust content (Aumann et al. 1984) from which it has been inferred that larger planetesimals must exist to replenish the dust disks because of the short lifetime of this dust (Backman & Paresce 1993). The collisional cascade scenario is supported by modeling of the emission spectrum of the dust which shows a size distribution similar to that expected for dust coming from a collisional cascade (Wyatt & Dent 2002, hereafter WD02). However, the issue of how these disks evolve has recently come under close scrutiny.
From a theoretical point view, Dominik & Decin (2003; hereafter DD03) showed that if P-R drag is not important then a planetesimal belt evolving in quasi-steady state would lose mass due to collisional grinding down giving a disk mass (and dust luminosity) that falls off . This is in broad agreement with the observed properties of debris disks: the mean dust luminosity at a given age falls off (Spangler et al. 2001); the mass inferred from detection statistics falls off (Greaves & Wyatt 2003), while the mass of the detected disks falls off (Najita & Williams 2005); the upper limit in luminosity of the detected disks also falls off (Rieke et al. 2005). While these trends can be viewed as a success of the steady-state model, it has yet to be proved that a steady state evolution model fits the data in more than just general terms (Meyer et al. 2006). Several puzzling observations also remain to be explained.
Decin et al. (2003) noted that the maximum fractional luminosity of debris disks remains constant at up to the oldest stars, where and are the disk and stellar luminosities respectively (see also Table 4 for definitions of the parameters used in the text), and this was explained by DD03 as a consequence of delayed stirring. A delay in the ignition of a collisional cascade is expected if it is the formation of Pluto-sized objects which trigger the cascade, since such massive bodies take longer, up to several Gyr, to form further from the star (Kenyon & Bromley 2002). However, that interpretation predicts that the radius of the belts should increase with stellar age, and this is not observed (Najita & Williams 2005). There is also recent evidence that the dust content of some systems is transient. The discovery of a population of dust grains around Vega in the process of removal by radiation pressure indicates that this system cannot have remained in steady state for the full 350 Myr age of the star (Su et al. 2005). Rieke et al. (2005) used their statistics on A stars, which showed a wide variety of properties among the debris disks, to suggest that much of the dust we see is produced episodically in collisions between large planetesimals. There is also an emerging population of debris disks detected around sun-like stars with dust at a few AU (Gaidos 1999; Beichman et al. 2005; Song et al. 2005; Smith, Wyatt & Dent in prep.). There is debate over whether these are atypically massive asteroid belts or the consequence of a rare transient event (e.g., Beichman et al. 2005).
A stochastic element to the evolution of debris disks would fit with our understanding of the evolution of the dust content of the inner solar system. This is believed to have been significantly enhanced for timescales of a few Myr following collisions between objects km in size in the asteroid belt (Nesvorný et al. 2003; Farley et al. 2006). However, it is not known whether the aftermath of individual collisions would be detectable in a debris disk, or indeed whether such events would happen frequently enough to explain the statistics (WD02; Telesco et al. 2005). Such events have a dramatic effect on the amount of dust in the solar system because there is relatively little around during the quiescent periods. Planetesimal belts of equivalent mass to those in the solar system would not have been detected in the current debris disk surveys. However, there is evidence to suggest that both belts were times more massive in the past (e.g., Stern 1996; Bottke et al. 2005). Periods analogous to the heavy bombardment experienced in the solar system up to Myr after its formation have also been invoked to explain the fact that debris disks are most often detected around stars Myr old (Habing et al. 1999).
In the light of this controversy we revisit a simple analytical model for the steady state collisional evolution of planetesimal belts which was originally explored in DD03. The model we derive for that evolution is given in §2, and differs in a subtle but important way from that of DD03, since it affects the dust production as a function of collision velocity. This model shows that there is a maximum possible disk mass (and dust luminosity) at any given age. In §3 confrontation with the few hot planetesimal belts discovered recently shows that the majority of these cannot be explained as massive asteroid belts, rather these must be systems undergoing a transient event. The possibility that these are caused by a recent collision within a planetesimal belt is also discussed, as is the possibility that the dust originates in a planetesimal belt in the terrestrial planet region. The implications of these results are discussed in §4. Application of the model to the statistics of detected debris disks will be considered in a later paper (Wyatt et al., in prep.).
2. Analytical collisional evolution model
In this section a simple analytical model is developed for the evolution of a planetesimal belt due to collisions amongst its members. The parameters used in this model are summarized in the table 4 which also gives the units assumed for these parameters throughout the paper.
2.1. The planetesimal belt size distribution
The planetesimal belt is assumed to be in collisional equilibrium with a size distribution defined by:
| (1) |
where in an infinite collisional cascade (Dohnanyi 1969) and the scaling parameter is called by DD03. That distribution is assumed to hold from the largest planetesimal in the disk, of diameter , down to the size below which particles are blown out by radiation pressure as soon as they are created, . If we assume that is in the range 5/3 to 2 then most of the mass is in the largest planetesimals while the cross-sectional area is in the smallest particles such that:
| (2) | |||||
| (3) | |||||
| (4) |
where spherical particles of density have been assumed and is in if the units of table 4 are used for the other parameters.
The planetesimal belt is assumed to be at a radius , and to have a width (in AU). One of the observable properties of a planetesimal belt is its fractional luminosity, , i.e., the infrared luminosity from the disk divided by the stellar luminosity. Assuming that the grains act like black bodies and so absorb all the radiation they intercept we can write:
| (5) |
In other words, in this model , and are all proportional to each other and just one is needed to define the scaling factor in equation (1). Assuming the particles act like black bodies also allows us to derive the following relation:
| (6) |
where is in m, and are in solar units, and is in kg m-3.
Relaxing the black body assumption is easily achieved (e.g., WD02). However, this would result in relatively small changes in the way scales with , and so for its heuristic simplicity we keep this assumption throughout this paper. Probably the most important simplification within this model is that of the continuous size distribution. For example, we know that the cut-off in the size distribution at would cause a wave in the size distribution at sizes just larger than this (Thébault, Augereau & Beust 2003), that large quantities of blow-out grains can also affect the distribution of small size particles (Krivov, Mann, & Krivova 2000), and that the dependence of planetesimal strength on size can result in as well as a wave in the distribution at large sizes (Durda et al. 1998; O’Brien & Greenberg 2003). Also, since the largest planetesimals would not be in collisional equilibrium at the start of the evolution, their initial distribution may not be the same as that of a collisional cascade, although distributions with have been reported from planet formation models (e.g., Stern & Colwell 1997; Davis & Farinella 1997; Kenyon & Luu 1999) meaning this is a reasonable starting assumption. Despite these simplifications, we believe this model is adequate to explore to first order the evolution of planetesimal belts which can later be studied in more depth.
2.2. Collisional evolution
In a collisional cascade material in a bin with a given size range to is replaced by fragments from the destruction of larger objects at the same rate that it is destroyed in collisions with other members of the cascade. The long-timescale evolution is thus determined by the removal of mass from the top end of the cascade. In this model the scaling factor (and so the total mass and fractional luminosity etc) decreases as the number of planetesimals of size decreases. The loss rate of such planetesimals is determined by their collisional lifetime, which in the terminology of WD02 is given by:
| (7) |
where maintaining the units used previously gives in years, is the mean inclination of the particles’ orbits (which determines the torus height), is the ratio of the relative velocity of collisions to the Keplerian velocity (, also called by DD03), and is the fraction of the total cross-sectional area in the belt which is seen by planetesimals of size as potentially causing a catastrophic collision.
From hereon we will use the assumption that , where is the mean eccentricity of the particles, which is valid for Rayleigh distributions of and (Lissauer & Stewart 1993; Wetherill & Stewart 1993). An expression for was given in WD02, however, here we will ignore the gravitational focussing effect, which is important in the accumulation phase but not during the destruction phase of a planetesimal belt (see §3.2), and so derive an expression that is the same as that given in Wyatt et al. (1999):
| (8) |
where , is the smallest planetesimal that has enough energy to catastrophically destroy a planetesimal of size (which is called in DD03), and:
| (9) | |||||
The factor can be worked out from the dispersal threshold, , defined as the specific incident energy required to catastrophically destroy a particle such that (WD02):
| (10) | |||||
| (11) |
where is in J kg-1 (called in DD03111Equation 25 in DD03 differs from our equation (10) because we define to be the specific incident kinetic energy so that whereas DD03 define to be the specific binding energy of the two objects (giving their equation 24). In the limit of the two equations are the same, since .)
Combining the above equations gives for the collisional lifetime of the planetesimals of size :
| (12) | |||||
| (13) |
Assuming that collisions are the only cause of mass loss in the belt, the evolution of the disk mass (or equivalently of , , or ) can be worked out by solving to give:
| (14) |
where is the initial disk mass and is the collisional lifetime at that initial epoch; this solution is valid as long as mass is the only parameter of the planetesimal belt that changes with time. This results in a disk mass which is constant at for , but which falls off for (as noted, e.g., in DD03).

|

|
However, another interesting property of this evolution is that, since the expression for includes a dependence on , the disk mass at late times is independent of initial disk mass. This is because more massive disks process their mass faster. This means that for any given age, , there is a maximum disk mass (and also infrared luminosity, ) that can remain due to collisional processing:
| (15) | |||||
| (16) | |||||
In this model, the present day disk mass (or luminosity) is expected to be equal to this ”maximum” disk mass (or luminosity) for disks in which the largest planetesimals are in collisional equilibrium. This corresponds to disks around stars that are older than the collisional lifetime of those planetesimals given in equation (13).
For example, with the further assumptions that , , and kg m-3, we find:
| (17) | |||||
| (18) |
where is in , in AU, in km, in Myr, and , with ( is in J kg-1).
Plots of and for typical planetesimal belts are shown in Fig. 1. However, for many disks the approximation that is valid, and so , giving:
| (19) | |||||
| (20) | |||||
2.3. Comparison with DD03
Since DD03 produced a very similar analytical model, our results were compared with those of DD03. The results of disk evolution for a planetesimal belt close to their nominal model were computed using the parameters: AU, AU, km, kg m-3, , , J kg-1, , A0 star (for which , , m). Each of the parameters , , , and spectral type were also varied to make the plots shown in Fig. 2 which are equivalent to Figs 1b-1f of DD03.

|

|

|

|

|
The results are very similar in most regards: more massive disks start out with higher , but the turnover from constant to evolution is later for lower mass disks meaning that at late times all disks converge to the same maximum value (Fig. 2a); putting the same mass at larger distances reduces the initial dust luminosity , but the resulting lower surface density and longer orbital timescales there combine to make the turnover happen later which means that at late times more distant belts are more massive (Fig. 2b); putting the same mass into larger planetesimals reduces the cross-sectional area of dust (equation 4) and so the initial dust luminosity , but increases the collisional lifetime of those planetesimals (equation 13) which means that at late times belts with larger planetesimals retain their mass for longer (Fig. 2d); later spectral types have higher starting dust luminosities because the cascade extends down to smaller sizes (equation 6), and the longer orbital times mean that they keep their mass for longer (Fig. 2e).
Where the models differ is in the exact way is used to get and , and in the way the evolution is affected by changing (Fig. 2c). This is because the models make different assumptions. Here we assume that the size distribution is continuous between and , whereas in DD03 the large planetesimals feeding the cascade are seen as separate from the cascade. This means that for us gives a direct estimate of (equation 3) and so the amount of dust , while for DD03 they equate the mass flow through the cascade with the mass input from the break-up of planetesimals meaning that while their scaling parameter is proportional to (as is ours), it also includes a dependence on the parameter we call which affects the mass flow rate in the cascade. This explains all of the differences: the details of the scaling explain the slightly different initial values in all the figures, and the fact that for us planetesimals of size are destroyed by planetesimals down to size means that our collisional lifetimes are always shorter than those in DD03, since they assume that planetesimals only collide with same size planetesimals. For us changing does not affect the initial parameter as described above, but it does affect the collisional lifetime of the largest planetesimals which can survive longer if is reduced (since this means that fewer planetesimals in the cascade cause destruction on impact). The opposite is the case for the DD03 model: changing does not affect the collisional lifetime of the largest planetesimals, since they only collide with each other, but a lower collision velocity does increase the initial dust luminosity because the cascade must have more mass in it to result in a mass flow rate sufficient to remove mass introduced by the large planetesimals. While the difference is subtle, it is important, since may be important in determining the presence of dust at late times (DD03; section 3).
On the face of it, it seems that our model provides a more accurate description of the disk. The reason is that in a collisional cascade the mass flow does not need to be taken into account, since it results in the size distribution (Tanaka et al. 1996). In other words the dependence of the scaling of the cascade with found by DD03 should have been removed if the largest planetesimals had been allowed to collide with smaller planetesimals (since increasing would have both restricted mass flow within the cascade and slowed down the mass input from the destruction of large planetesimals). However, it is also true that the distribution only applies in an infinite cascade, and since both models have truncated the size distribution at , this would affect the evolution. Also, the effect of the variation of with on the size distribution and its evolution are not yet clear, and neither is the evolution of the size distribution while the collisional cascade is being set up. These issues will be discussed only briefly in this paper, in which the simple evolution model described above is applied to some of the latest observational results on debris disks.
3. Application to rare systems with hot dust
| Star name | Sp. Type | Age, Myr | Radius, AU | Transient? | Reference | ||
|---|---|---|---|---|---|---|---|
| HD98800ccbinary star | K4/5V | 10 | 2.2 | Not req | Low et al. (2005) | ||
| HD113766acacfootnotemark: | F3V | 16 | 3 | Not req | Chen et al. (2005) | ||
| HD12039 | G3/5V | 30 | 4-6 | Not req | Hines et al. (2006) | ||
| BD+20307aainfrared silicate feature | G0V | 300 | 1 | Yes | Song et al. (2005) | ||
| HD72905aainfrared silicate feature | G1.5V | 400 | 0.23bbalso has cool dust component at AU | Yes | Beichman et al. (2006a) | ||
| Corviaainfrared silicate feature | F2V | 1000 | 1-2bbalso has cool dust component at AU | Yes | Wyatt et al. (2005) | ||
| HD69830aainfrared silicate feature | K0V | 2000 | 1 | Yes | Beichman et al. (2005) |
Very few main sequence stars exhibit hot dust within AU, i.e., in the region where we expect planets may have formed. Four surveys have searched for hot dust around sun-like stars (main sequence F, G or K stars) by looking for a 25 m flux in excess of photospheric levels using IRAS (Gaidos 1999), ISO (Laureijs et al. 2002) and Spitzer (Hines et al. 2006; Bryden et al. 2006). All concluded that only % of these stars have hot dust with infrared luminosities , finding a total of 3 candidates. Other hot dust candidates exist in the literature, however some IRAS excess fluxes have turned out to arise from chance alignments with background objects (e.g., Lisse et al. 2002), including the candidate HD128400 from the hot dust survey of Gaidos (1999) (Zuckerman, priv. comm.). Thus confirmation of the presence of dust centred on the star using ground- and space-based mid-IR imaging is vitally important (Smith, Wyatt & Dent, in prep.). The tally of confirmed hot dust sources now stands at seven, and these are summarized in Table 1 which also gives the estimated radial location of the dust based on fitting of the spectral energy distribution of the excess emission; for all stars the dust is predicted to lie at AU.
While the frequency of the presence of such emission is low, there is as yet no adequate explanation for its origin and why it occurs in so few systems. Analogy with the solar system suggests that these are systems in which we are witnessing the collisional grinding down of atypically massive asteroid belts. However, other scenarios have also been proposed in which the dust is transient, having been produced in some stochastic process. Such a process could be a recent collision between two massive protoplanets in an asteroid belt (Song et al. 2005), the sublimation of one supercomet (Beichman et al. 2005), or the sublimation of a swarm of comets, possibly scattered in from several tens of AU in an episode analogous to the period of Late Heavy Bombardment in the solar system (Gomes et al. 2005).
3.1. Are these massive asteroid belts?
Here we consider the possibility that these are atypically massive asteroid belts, and show that for the majority of the known systems this is unlikely to be the case. The reason is that given in §2.2, which is that more massive asteroid belts are not necessarily more dusty at late times, and there is a maximum dust luminosity we can expect for a belt of a given age, given its radial location (equations 15-20). To arrive at a rough estimate of the maximum possible we assume the following parameters: the largest possible planetesimal is km, since this is above the largest members of the asteroid and Kuiper belts, and fits with the expectation that planetesimal growth is halted once the largest planetesimals reach this size due to the resulting gravitational perturbations (Kenyon & Bromley 2002); belt width is ; planetesimal strength is J kg-1, the canonical value used in DD03, although gravity strengthening can give rise to higher values for planetesimals larger than km (see §3.2); planetesimal eccentricity is , typical for planetesimal belts like the asteroid belt that are undergoing a collisional cascade, and close to that expected from stirring by 2000 km planetesimals within such belt. 222Equating the velocity dispersion in the belt with the escape velocity of a planetesimal of size gives . Substituting in these nominal values into equation (20) and approximating gives:
| (21) |
Plots analogous to those in Fig. 2 are presented in Fig. 3 which shows the evolution for a planetesimal belt with the nominal parameters described above (and with a nominal starting mass of ) along with the consequence for the evolution of changing any of those parameters. Note that it is most appropriate to refer to Fig. 3, rather than Fig. 2, when considering the evolution of planetesimal belts close to sun-like stars.

|

|

|

|

|

|
The value of is quoted in Table 1 under the assumption that the planetesimal belt has the same age as the star. The quoted value for each star is that from equation (18) for its spectral type, but is within a factor of three of that given in equation (21), indicating that this equation may be readily applied to observed belts in the future. The four oldest systems (BD+20307, HD72905, Corvi and HD69830) have . We show in §3.2 that even with a change in parameters it is not possible to devise asteroid belts in these systems that could survive to the age of the stars giving rise to the observed dust luminosities. Thus we conclude that this period of high dust luminosity started relatively recently. The timescale over which a belt can last above a given luminosity, , is , since collisions would grind a belt down to this level on such a timescale. This implies that belts this luminous only last between a few thousand years (BD+20307 and HD72905) and a few Myr ( Corvi and HD69830). However, the true duration of this level of dust luminosity depends on the details of the process causing it, and moreover there is still up to two orders of magnitude uncertainty in (see §3.2). Thus this calculation should not yet be used to infer from the % of systems with hot dust that, e.g., every sun-like star must undergo 10-1000 such events in its lifetime (or fewer systems must undergo even more events). For now the conclusion is that these systems cannot be planetesimal belts that have been evolving in a collisional cascade for the full age of the star.
This leaves open the possibility that the collisional cascade in these systems was initiated much more recently, perhaps because a long timescale was required to form the 2000-3000 km sized planetesimals necessary to stir the planetesimal belt and cause the switch from accretion to collisional cascade (Kenyon & Bromley 2004). However, we consider this to be unlikely, because the timescale for the formation of objects of this size at 1 AU from a solar mass star was given in Kenyon & Bromley (2004) to be Myr, where is the mass of material in an annulus of width , just as in the rest of the paper. This means that the cascade can only be delayed for 100-1000 Myr at 1 AU for planetesimal belts of very low mass, which would also be expected to have low dust luminosities when the cascade was eventually ignited. For example, a delay of Myr would require in the annulus at 1 AU of 0.5 AU width, a mass which corresponds to a fractional luminosity of (equations 4 and 5 with kg m-3 and ), much lower than that observed in all systems. One can also consider the same argument in the following way: the observed luminosity implies a planetesimal belt mass which current planet formation theories indicate would result in the growth of 2000 km planetesimals which would ignite a collisional cascade on a timescale of Myr if this was placed at 1 AU from a solar mass star. The conclusion at the end of the last paragraph also considers the collisional cascade to evolve in quasi-steady state, and it is possible that collisions between large members of the cascade may have recently introduced large quantitites of small dust; that possibility is discussed in §3.3.
For the three youngest systems the conclusions are less clear. The dust luminosities of HD12039 and HD113766 are, respectively, close to and fifty times higher than the maximum allowed value for collisionally evolved planetesimal belts. However, given the uncertainties in the parameters in the model (described in §3.2), we conclude that it is not possible to say that these could not be massive asteroid belts. The main reason that firm conclusions cannot be drawn is the large radial location of the dust at AU. The strong dependence of on means that it is easiest to constrain the nature of belts within a few AU which evolve very rapidly. For the youngest system (HD98800), while its dust luminosity lies a factor of 800 above the maximum for the age of the star, we do not infer that this must be transient, since the high dust luminosity and low age imply that this system is in a transitional phase and the collisional cascade in this debris disk is likely to have only recently been ignited. Rather we note that this model implies that due to collisional processing this debris disk cannot maintain this level of dust emission beyond the next years (albeit with an additional two orders of magnitude uncertainty, §3.2).
3.2. Possible caveats
Given the large number of assumptions that went into the estimate for , it is worth pointing out that this model is in excellent agreement with the properties of the asteroid belt in the solar system, since for a 4500 Myr belt at 3 AU the model predicts , which is close to the inferred mass of the asteroid belt of (Krasinsky et al. 2002). The model also predicts , which is consistent with the estimate for the zodiacal cloud of (Backman & Paresce 1993). 333In planetesimal belts as tenuous as the asteroid belt, the effect of P-R drag is important (Wyatt 2005) meaning that the cross-sectional area of dust in the zodiacal cloud is dominated by m sized grains rather than grains of size as assumed in the simple model of §2.1. Taking this into account would reduce the fractional luminosity predicted by the model by an order of magnitude. It is also necessary to explore if there is any way in which the parameters of the model could be relaxed to increase and so change the conclusions about the transience of the hot dust systems. Equation (20) indicates one way in which could be increased, which is by either reducing the eccentricities of the planetesimals, , or increasing their strength, , both of which could increase and so decrease the rate at which mass is lost from the cascade (e.g., fig. 3). The other way is to change the size distribution so that a given disk mass results in a significantly larger dust luminosity, e.g., by increasing .
In fact Benz & Asphaug (1999) found a value of that is higher than J kg-1 for planetesimals as large as 2000 km for both ice and basalt compositions. This would result in an increase in by a factor of (e.g., Fig. 3). However, such a high value of is possible only due to gravity strengthening of large planetesimals, and the dependence in this regime of (Benz & Asphaug 1999) would result in an equilibrium size distribution with , since when then (O’Brien & Greenberg 2003). If such a distribution was to hold down to the smallest dust grains the net result would be a decrease in by . This is not the case, however, since objects in the size range km are in the strength scaled regime where leading to a size distribution with in this range. According to O’Brien & Greenberg (2003) the size distribution of a collisional cascade with a realistic prescription should have two components (characterized by and ), but there is a discontinuity at the transition size with the strength scaled component shifted down by an appropriate amount (see their Fig. 3b). This means that should be higher than that derived using equation (16) with by a factor . Since , then substituting the values from Benz & Asphaug (1999) given above implies that Table 1 underestimates by at most a factor of 50-100 (possibly much less). In other words, we anticipate that by including a more realistic prescription for and the resulting size distribution, this would change the inferred but not upwards by an amount more than two orders of magnitude. For this reason, transience is only inferred for those systems for which .
A lower eccentricity is, however, one potential avenue for increasing the amount of dust remaining at late times. Equation (20) shows that since (Fig. 1a), this means that reducing from 0.05 to 0.01 or 0.001 gives a decrease in of 15 or 680, and so an increase in by a corresponding amount (e.g., Fig. 3). In fact the increase can be much more than this, since when is reduced to levels below then (e.g., Fig. 1b). In such a regime mutual collisions do not result in the destruction of planetesimals, rather in their merger and growth. At this point , i.e., is infinite since, in this simple model, whatever the starting conditions there is no evolution (although in practice the size distribution would evolve due to planetesimal growth). At AU, this means must be larger than 0.0005 (for J kg-1, appropriate for km) or 0.014 (for J kg-1, appropriate for km) to initiate a collisional cascade, values which are consistent with those quoted by more detailed planet formation models (e.g., Kenyon & Bromley 2002). Such eccentricities would be expected through stirring either by km planetesimals which formed within the belt, or by more massive perturbers which formed outside the belt, both of which can be expected to occur within 10-100 Myr (Kenyon & Bromley 2006). This was considered in §3.1 where it was shown that the cascade would be initiated following the growth of km planetesimals on timescales that are much shorter than the age of the system for the disk masses required to produce a dust luminosity at the observed level.
The only route which could plausibly maintain the hot dust systems in Table 1 in collisional equilibrium over the age of the stars might be to invoke some mechanism which maintains the eccentricity at a level which the cascade is only just being eroded. However, Fig. 1a shows that is a strong function of when , since the range is covered by a factor of less than two in eccentricity. Thus we consider it reasonable to assume that the best possible combination of and in this regard would result in (corresponding to ); lower values of are possible, but only within a very narrow range of eccentricity. Since in the above example with a realistic prescription extending up to 2000 km we assumed which already resulted in , we consider that it is not reasonable to fine tune the eccentricity further to increase ; e.g., decreasing to results in some disks not evolving and the rest with higher than that quoted in Table 1 by a factor . Thus we conclude that the estimate given in Table 1 (and e.g., equation 16) underestimates by at most a factor of , unless the eccentricity happens to lie within of a critical value.
It is also worth noting that low levels of eccentricity would result in large gravitational focussing factors for large planetesimals which would enhance and so decrease the time for these planetesimals to be catastrophically destroyed, something which is compounded by the higher collision velocity in gravitationally focussed collisions which reduces because collisions with smaller planetesimals can cause catastrophic disruption (e.g., equation 11). However, we do not need to account for this here, since gravitational focussing becomes important when and so when (where is in km); i.e., when for km and for km at 1 AU from a star, both of which occur close to or below the level at which collisions result in accumulation rather than destruction.
3.3. Are these the products of single collisions?
One possible origin for the hot dust which is quoted in the literature is that it is the product of a single collision (Song et al. 2005). Our model can be used to make further predictions for the likelihood of massive collisions occurring within an asteroid belt. The maximum number of parent bodies (i.e., planetesimals) larger than remaining at late times occurs when and so is given by:
| (22) | |||||
The collision timescale for planetesimals of size is
| (23) | |||||
noting that the collisional lifetime of the largest planetesimals, , is the age of the star for a planetesimal belt at maximum luminosity for this age. These can be combined to give the destructive collision rate for planetesimals larger than :
| (24) | |||||
in Myr-1, where the assumptions that , and have been used in deriving this equation.
We now assume that we are considering collisions capable of reproducing the observed dust level, , so that the lifetime of the resulting collision products can be estimated from the collisional lifetime of that dust, assumed to be of size (WD02):
| (25) |
in years, noting that collisions would remove the dust on a faster timescale than P-R drag (Wyatt 2005; Beichman et al. 2005). Combining equations (24) and (25) gives the fraction of time that collisions are expected to result in dust above a given level of :
| (26) | |||||
To estimate the minimum size of the parent body, , responsible for this dust, we consider how large a planetesimal must be to reproduce if a destructive collision resulted in one fragment with half the mass of the original planetesimal (i.e., the definition of a destructive collision), with the remaining mass in particles of size :
| (27) |
| Star name | , km | , Myr-1 | , yr | Single collision? | ||
|---|---|---|---|---|---|---|
| HD98800 | 530 | 200 | 41 | 0.36 | No | |
| HD113766 | 280 | 890 | 150 | 41 | Not imposs | |
| HD12039 | 110 | 77,000 | 12,000 | 2300 | 27**For disks with , this value indicates the number of collisions at that level we can expect to see in the disk at any one time. Likewise, for disks with , this value indicates the probability that there is an object of this size remaining in the disk. | Not imposs |
| BD+20307 | 320 | 0.47**For disks with , this value indicates the number of collisions at that level we can expect to see in the disk at any one time. Likewise, for disks with , this value indicates the probability that there is an object of this size remaining in the disk. | 0.0039 | 0.49 | No | |
| HD72905 | 15 | 1.4 | 0.036 | 22 | No | |
| Corvi | 110 | 7.8 | 0.033 | 59 | No | |
| HD69830 | 39 | 19 | 0.068 | 110 | No |
Table 2 lists the parameters for the hot dust systems assuming the canonical parameters of J kg-1, km and . To determine whether a system could have been reproduced by a single collision, the final value of was compared with the statistic that 2% of systems exhibit hot dust (which therefore considers the optimistic case where all stars have planetesimal belts at a few AU). For the systems which were inferred in Table 1 to be transient, all are extremely unlikely (%) to have been caused by a single collision amongst planetesimals in a planetesimal belt which has undergone a collisional cascade since the star was born.
While this statistic is subject to the uncertainties in the model parameters described in §3.2, and so could be in error by around two orders of magnitude, it must also be remembered that the most optimistic assumptions were used to arrive at this figure. For example, it is unlikely that the destruction of planetesimals of size would release half of the mass of the planetesimal into dust in size. 444Such an optimistic assumption should not be dismissed out of hand, however, since the large amount of collisional processing that must have taken place means that planetesimals more than a few km would be rubble piles. These would have undergone shattering and reaccumulation numerous times meaning that they could have deep dusty regolith layers which could be preferentially ejected in a collision. On the other hand, one might consider that the lifetime of the observed dust, , is an underestimate of the duration of dust at the level of , since the dust could be replenished from the destruction of larger particles. Indeed Farley et al. (2006) model the destruction of a 150 km planetesimal in the asteroid belt and inferred a dust peak that lasted Myr, precisely because large fragments produced in the collision replenished the dust population. However, it should be cautioned that the dust peak inferred by Farley et al. (2006) would not have been detectable as an infrared excess since it only caused a factor enhancement in the luminosity of the zodiacal cloud (i.e., to ), and that in the context of our model, invoking a population of larger grains that result from the collision would lead to a larger parent body (i.e., a larger ) required to reproduce the observed luminosity and so less frequent collisions; i.e., it may be possible (even desirable) to increase , but only at the expense of decreasing leading to little change in . We note that given in Table (2) is sufficiently short that a measurement of the variability of the infrared excess on realistic (few year) timescales could lead to constraints on the size of the grains feeding the observed phenomenon, since if a population of larger grains existed then the luminosity would fade on much longer timescales.
A further argument against the transient disks being caused by single collisions is the fact that the probability of seeing the outcome of a collision, , falls off , which means that we would expect to see more transient disks around younger stars than around older stars (because young stars have more massive disks with more large planetesimals and so more frequent collisions). There is some evidence from Table 1 that transience is more common around young systems, since none of the transient systems is older than 2 Gyr, whereas sun-like stars in the solar neighborhood would be expected to have a mean age of Gyr. However, while the statistics are poor, a dependence does seem to be ruled out; e.g., we would have expected to have detected 10 times more transient disks caused by single collisions in the age range 50-500 Myr555It is not reasonable to extend the age range to younger systems, since, as noted in §3.1 it is hard to discern whether or not dust detected in such systems is transient. than in the age range 0.5-5 Gyr, whereas 2 transient disks are known in the younger age bin, and 2 in the older age bin which is more consistent with a dependence.
| Star name | , Myr-1 | , | , Myr | , AU |
|---|---|---|---|---|
| BD+20307 | 53 | 45 | ||
| HD72905 | 19 | 0.072 | 2.4 | |
| Corvi | 2500 | 57 | 0.023 | 9.6 |
| HD69830 | 64 | 12 | 0.18 | 4.5 |
In fact, within the context of this model, all of the disks which we infer to be transient would also be inferred to not be the product of single collisions. This is evident by substituting from equation (27) and from equation (18) into equation (26) to get:
| (28) |
which reduces to for the canonical parameters used before. Since transient disks are defined by , this means they cannot also have a high probability of having their origin in single collisions. It would only be inferred that disks with could have their origin in single collisions, but since it is also possible that these disks are the result of steady state collisional evolution there is no need to invoke a single collision to explain their presence, which is why Table 2 simply concluded that it is ”not impossible” that the disks of HD113766 and HD12039 are the product of single collisions. What equation (28) does indicate, however, is that it is possible for single collisions to cause disks to spend some fraction of their time at a luminosity enhanced above the nominal maximum value , and that this occurs more readily for disks at smaller radii and around higher mass stars. However, whether single collisions really do achieve an observable increase in luminosity depends on the size distribution of the collisional fragments, for which it must be remembered that equation (28) used an unrealistically optimistic estimate.
3.4. Are parent planetesimals coincident with dust?
For similar reasons to those in §3.3 it is also possible to show that the parent planetesimals of the dust are extremely unlikely to originate in a planetesimal belt that is coincident with the dust. The reason is that the mass remaining in such a belt would be insufficient to replenish the dust for a length of time commensurate with the statistic that 2% of stars show this phenomenon. The observed dust luminosity, assuming this is comprised of dust of size which has a lifetime of (equation 25), implies a mass loss rate due to mutual collisions between the dust grains of:
| (29) |
in /Myr, and this is independent of the collisional evolution model of §2. However, due to the collisional evolution of a planetesimal belt’s largest members, there is a maximum mass that can remain in a belt at the same radius as the dust at this age, and this is given in equation (15). This means that if the observed dust originates in an event which, for whatever reason, is causing planetesimals in a belt at the same radius as the dust to be converted into dust, then this can last a maximum time of before the planetesimal belt is completely exhausted. These figures are given in Table 3 which shows that the longest the type of transient event observed could be sustained in these systems is under 1 Myr, under the assumptions about the planetesimal belts employed in the rest of the paper.
A maximum duration of 1 Myr is not sufficient to explain the statistic that 2% of sun-like stars exhibit this phenomenon, since the median age of such stars is 5 Gyr, indicating a typical duration (even if this occurs in multiple, shorter, events) of around 100 Myr. Clearly a reservoir of mass is required in excess of that which it is possible to retain so close to the star.
3.5. Constraints on parent planetesimal belt
If we assume that the observed mass of hot dust originates in planetesimals that were initially in a belt at a radius which has properties like those assumed in the rest of the paper, and a fractional luminosity of , then there are two main constraints on that belt. First, assuming that this belt has been collisionally evolving for the age of the star, then this belt cannot have more mass (or luminosity) than the maximum that could possibly remain due to collisional processing, i.e., (equation 16). Second, it must have sufficient mass remaining to feed the observed mass loss rate for long enough to reproduce the statistic that 2% of stars exhibit this phenomenon which implies a total duration of Myr. For a belt to have enough mass to feed the observed hot dust luminosity of at a radius for a total time of in Myr requires the belt to have a luminosity of:
| (30) |
or rather, this is the luminosity it must have had before it was depleted.
|
|
|
|
Comparing this with the maximum mass possible at this age indicates that the parent belt must have a minimum radius of:
| (31) | |||||
Table 3 gives an estimate of the minimum radial location of such a planetesimal belt, under the assumption that the event (or multiple events) of high hot dust luminosity last Myr. These values indicate that the planetesimal belts must be at least a few AU from the star. It must be cautioned that this conclusion is relatively weak in the case of HD69830, since the uncertainty in the properties of the planetesimals still leaves two orders of magnitude uncertainty in the maximum luminosity, , and so also in the maximum mass (see §3.2). This means that, with suitable planetesimal belt properties, a belt in this system that is coincident with the dust at 1 AU may be able to replenish the observed phenomenon for 20 Myr. However, we still consider this to be an unlikely scenario, since it would require that the mass of the planetesimal belt is depleted at a constant rate for the full 100 Myr, whereas most conceivable scenarios would result in a mass loss rate which decreases with time as the planetesimal population is depleted thus requiring an even larger starting mass.
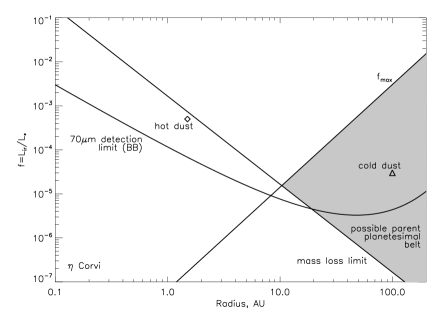
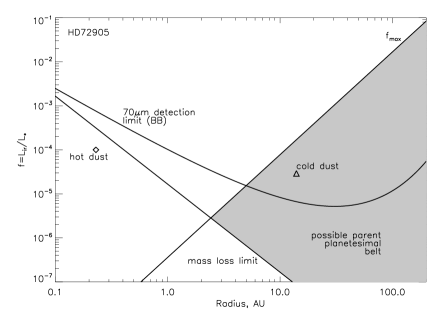
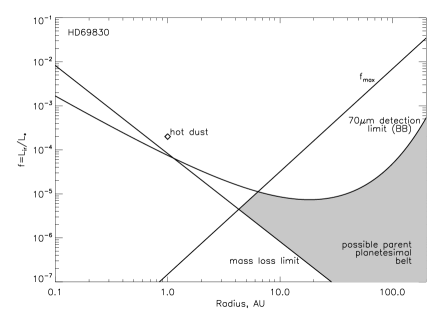
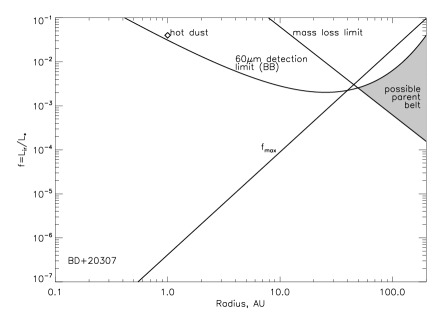
These two constraints are summarized for the 4 systems with transient hot dust in Fig. 4, which shows the shaded region of parameter space in and where the parent planetesimal belt can lie. This figure also shows the location of the hot dust at and , illustrating the conclusion of §3.1 that this lies significantly above , the maximum fractional luminosity expected for a planetesimal belt at the age of the parent star. Note that the value given in Table 3 denotes the intersection of the limits from and from equation (30).
A third constraint for the parent planetesimal belt comes from far-IR observations of these systems. For 2/4 of the transient dust systems a colder dust component has already been detected: Corvi has a planetesimal belt with a resolved radius of AU (Wyatt et al. 2005), and HD72905 has one inferred to be at AU (Beichman et al. 2006a). In both cases these outer planetesimal belts have been inferred to be at a different spatial location from the hot dust either because of imaging constraints (Wyatt et al. 2005) or from analysis of the SED (Beichman et al. 2006a). The properties inferred for these planetesimal belts are indicated on Fig. 4 and lie within the shaded region, implying that these planetesimal belts do not have to be transiently regenerated, and also provide a plausible source population for the hot dust found closer in. However, no such excess emission has been seen toward HD69830 at either 70 m (Beichman et al. 2005) or 850 m (Sheret, Dent & Wyatt 2004) indicating a planetesimal belt with a mass at most 5-50 times greater than our own Kuiper belt. Likewise, BD+20307 does not have a detectable excess in IRAS 60 m observations (Song et al. 2005).
A low mass reservoir of planetesimals does not necessarily rule out the presence of an outer planetesimal belt which is feeding the hot dust for two reasons. First, the shaded region of Fig. 4 actually constrains the properties of the planetesimal belt at the time at which depletion started; i.e., this population may have already been severely depleted by the same event which is producing the dust and we are now nearing the end of the hot dust episode. Second, the constraints imposed by a non-detection in the far-IR do not eliminate the whole of the parameter space in which an outer planetesimal belt can lie. Fig. 4 includes the constraints on the outer planetesimal belt imposed by the non-detection of excess in the far-IR, assuming that the dust emits like a black body. The resulting detection limit is then given by:
| (32) |
where is the detection limit in Jy, is the distance to the star in pc, and is in Jy/sr. For BD+20307 the non-detection is limited by the sensitivity of IRAS, and so lower limits should be achievable with Spitzer. For the two systems with non-detections, the shaded region already takes the far-IR constraint into account.
The simplification that the emission comes from black body-type grains means that equation (32) underestimates the upper limit from the far-IR fluxes. This is because the majority of the luminosity comes from small grains which emit inefficiently at long wavelengths. Indeed, the black body assumption would require the hot dust of HD69830 and BD+20307 to have been detected in the far-IR, whereas this is not the case. We modeled the emission from non-porous silicate-organic refractory grains in a collisional cascade size distribution at 1 AU from these stars to find that the black body assumption used in equation (32) underestimates the limit by a factor of meaning that non-detection of the hot dust in these systems in the far-IR is to be expected. This also means that slightly more luminous outer planetesimal belts than those indicated by the shaded region on Fig. 4 may still have escaped detection in the far-IR.
Until now we have not proposed a mechanism which converts the planetesimals into dust. Whereas Beichman et al. (2005) invoke sublimation of comets as the origin of the hot dust, and use this to estimate the mass of the parent planetesimal belt, we consider a scenario in which a significant fraction of material of all sizes in the parent planetesimal belt is placed on orbits either entirely coincident with the hot dust, or with pericenters at that location. In this scenario the dust is reproduced in collisions and the material maintains a collisional cascade size distribution. Simply moving material from to would result in an increase in fractional luminosity from to . This indicates that the parent planetesimal belt responsible for the hot dust could have originally been on the line on Fig. 4 traced by . Since this is parallel to the mass loss limit line (equation 30), and for all but HD69830 the observed hot dust component lies below this line, this indicates that parent planetesimal belts in the shaded region could be responsible for the hot dust observed, as long as a large fraction of their mass is scattered in to the inner regions. However, it is to be expected that only a fraction of the outer planetesimal belt ends up in the hot dust region, and so it is more likely that the parent planetesimal belt started on a line which falls off less steeply than , and this is consistent with the ratio of the hot and cold components of Corvi and HD72905 which indicate a dependence of ; it is also interesting to note that both have . We defer further consideration of the expected properties of the parent planetesimal belt to a more detailed model of the dynamics of the types of events which could cause such a perturbation, but simply note here that the existence of an outer planetesimal belt is not ruled out by the current observational constraints in any of the systems.
4. Discussion
A simple model for the steady state evolution of dust luminosity for planetesimal belts evolving due to collisions was described in §2. This showed how at late times the remaining planetesimal belt mass and so dust luminosity is independent of the initial mass of the belt. This has important implications for the interpretation of the properties of detected disks. This paper discussed the implications for the population of sun-like stars with hot dust at AU; the implications for the statistics will be discussed in a forthcoming paper (Wyatt et al., in prep.).
It was shown in §3.1 that for 4/7 of the systems with hot dust their radius and age are incompatible with a planetesimal belt which has been evolving in quasi-steady state over the full age of the star, and in §3.2 it was shown that this is the case even when uncertainties in the model are taken into account. This implies either that the cascade was started recently (within the last Myr or so), or that the dust arises from some other transient event. Recent ignition of the collisional cascade seems unlikely, since the mass required to feed the observed luminosity would result in the growth of 2000 km planetesimals which would stir the belt and ignite the cascade on timescales much shorter than the age of the stars. Possible origins for the transient event that have been proposed in the literature are: recent collision between massive planetesimals in a planetesimal belt which introduces dust with a size distribution and so can be detected above a collisional cascade which is too faint to detect; one supercomet km in diameter that was captured into a circular orbit in the inner system replenishing the dust through sublimation (Beichman et al. 2005); a swarm of comets scattered in from the outer reaches of the system (Beichman et al. 2005). In §3.3 the collisional model was used to show that the transient disks are very unlikely (% for the most optimistic estimate for any of the stars compared with a detection probability of 2% for transient hot dust) to have their origin in a recent collision; such collisions occur too infrequently. In §3.4 it was also shown that the parent planetesimals of the observed dust must originate in a planetesimal belt much further from the star than the observed dust, typically at AU. This is because collisional processing means that the mass that can remain so close to the star at late times is insufficient to feed the observed phenomenon.
The most likely scenario is thus a recent event which provoked one or more planetesimals to be scattered in from further out in the disk (Beichman et al. 2005). The observed dust could have been produced from such a scattered planetesimal population through their grinding down in mutual collisions (§3.5), although sublimation close to the pericenters of the planetesimals’ orbits is a further possible source of dust. More detailed study of the scattering and consequent dust production processes is required to assess these possibilities. However, this scenario is supported by the presence of far-IR emission originating from a colder outer planetesimal belt component in 2/4 of the transient dust systems. The constraints on the outer planetesimal belt which is feeding the phenomenon are discussed in §3.5, showing that the outer planetesimal belts already found in Corvi and HD72905 provide a plausible source population for the hot dust found closer in, and that the current non-detection of cold dust around the remaining two systems does not rule out the presence of an outer planetesimal belt capable of feeding the observed hot dust luminosity.
One clue to the origin of the parent planetesimals of the dust may be the composition of that dust. Silicate features have been detected in the mid-IR spectrum of all of the transient hot dust stars (Song et al. 2005; Beichman et al. 2005; Beichman et al. 2006a; Chen et al. 2006). Detailed modeling of the spectrum of HD69830 indicates that the mineralogical composition of its dust is substantially different from that of comets, rather there is a close match to the composition of P- or D-type asteroids found mainly in the 3-5 AU region of the solar system (Lisse et al. 2006). While the radial location at which planetesimals of this composition form in the HD69830 system will depend on the properties of its protostellar nebula, which may be significantly different to that of the protosolar nebula, as well as on the structure and evolution of its planetary system, evidence for water ice in the dust spectrum indicates that the parent body formed beyond the ice-line in this system (Lisse et al. 2006), i.e., beyond AU (Lecar et al. 2006; Alibert et al. 2006). Thus the compositional data supports the conclusion that the dust is not produced by a planetesimal that formed in situ. However, it is worth noting that the same compositional data also finds evidence for differentiation in the parent body (inferred from abundance differences between the dust and the star) and for heating of its rocky material to K (inferred from the absence of amorphous pyroxene), which would also have to be explained in the context of an outer planetesimal belt origin for the dust.
An analogous transient event is thought to have happened in the solar system resulting in the period known as the Late Heavy Bombardment (LHB) when the terrestrial planets were subjected to an abnormally high impact rate from asteroids and comets. This is believed to have been triggered by a dynamical instability in the planetary system resulting from Jupiter and Saturn crossing the 1:2 resonance during their slow migration (inwards for Jupiter, outwards for Saturn) due to angular momentum exchange with the primordial Kuiper belt (Gomes et al. 2005). In this scenario both the asteroid and Kuiper belts were depleted with a large fraction of these objects being scattered into the terrestrial planet region during an event which lasted Myr (Gomes et al. 2005), i.e., exactly the type of event required to explain the observed hot dust in the scenario proposed here (§3.5). Dynamical instabilities in extrasolar planetary systems can also arise from mutual gravitational perturbations between giant planets which formed close together (Lin & Ida 1997; Thommes, Duncan & Levison 1999). In both scenarios slow diffusion of the orbits of the planets means that the dynamical instability can occur up to several Gyr after the formation of the planetary system. The delay to the onset of the instability is determined by the separation of the outer planet from the outer planetesimal belt (Gomes et al. 2005), or from the separation between the planets (Lin & Ida 1997), with larger separations resulting in longer timescales.
Little is known about the planetary systems of four of the hot dust systems. However, three Neptune mass (or Jupiter mass if the system is seen face-on) planets have recently been discovered orbiting the star HD69830 at AU on nearly circular orbits (Lovis et al. 2006). Dynamical simulations showed that the detected planetary system is stable on timescales of 1 Gyr. This does not, however, rule out the possibility of a dynamical instability having occurred. While no mean motion or secular resonances are immediately identifiable within the detected planetary system which could have have been crossed recently invoking such a catastrophic event, it is possible that the instability arose with another planet further out which has yet to be detected with longer timescale observations. It is also possible that a fourth planet which existed in the region 0.19-0.63 AU between the planets HD69830c and HD69830d has recently been scattered out due to a dynamical instability (e.g., Thommes et al. 1999). The region 0.3-0.5 AU was identified in Lovis et al. (2006) as being marginally stable, and to encompass several mean motion resonances with the outer planet, including the 1:2 resonance at 0.4 AU; i.e., a putative fourth planet could have remained in this region for the past 2 Gyr until the slow migration/diffusion of the outer planet (HD69830d) caused the 1:2 resonance to coincide with the orbit of the putative planet which was then scattered outward thus promoting the depletion of an outer planetesimal belt much of which was scattered into the inner regions of the system. Alibert et al. (2006) considered that the most plausible formation scenario for the planetary system of HD69830 included the inward migration of the outer planets from beyond the ice-line at a few AU. This would put a substantial distance between the outer planet (HD69830d) and any outer planetesimal belt which favors a delay of 2 Gyr before the onset of the instability. Searches for further planetary companions in this system, and for the relic of its outer planetesimal belt, are clearly necessary to constrain the evolutionary history of this system.
In conclusion, % of sun-like stars exhibit transient hot dust in the terrestrial planet region; this dust must originate in a planetesimal belt located further from the star than the dust, typically at AU. Just four members of this class are currently known, although it seems reasonable to assume that our own solar system would have been placed in this class during the LHB. The frequency of this phenomenon indicates that either all stars are subjected to an epoch of similar duration (lasting Myr assuming a typical age of 5 Gyr) or that a smaller fraction of stars undergo much longer (or multiple) events. The distribution of the ages of the stars in this class indicate that the likelihood of these events occurring falls off roughly inversely proportional to the age of the stars. An origin for these events in a dynamical instability as proposed for the LHB in the solar system is supported by the recent discovery of a multiple planet system coincident with the dust in one of the systems currently in this class. However, since the LHB in the solar system is thought to have lasted just Myr, it remains to be seen whether we are to infer that dynamically unstable planetary systems form around all stars, or that the LHB event in other systems lasted much longer than in our own, or perhaps that there is in fact more than one mechanism causing this hot dust signature. Observations that further constrain the planet, planetesimal and dust complements of the transient hot dust systems are needed to ascertain the similarities and dissimilarities within this population.
Appendix A Summary of symbols
The symbols which are employed in this paper are summarized in Table 4 along with the units assumed throughout the paper.
| Symbol | Units | Meaning |
|---|---|---|
| Jy/sr | black body emission spectrum | |
| pc | distance to star | |
| /Myr | rate of mass loss assuming observed dust has size | |
| AU | planetesimal belt width | |
| m | diameter of smallest dust in cascade | |
| km | diameter of largest planetesimal in cascade | |
| km | smallest planetesimal capable of destroying planetesimals of diameter | |
| km | minimum diameter of parent body required to produce observed dust | |
| km | planetesimal diameter at transition between strength and gravity regimes | |
| mean orbital eccentricity of planetesimals | ||
| fractional luminosity (= ) in model | ||
| fractional luminosity for emission from belt to be detected | ||
| maximum fractional luminosity of cascade after time | ||
| fractional luminosity observed | ||
| fractional luminosity of putative outer planetesimal belt feeding the dust | ||
| ratio of collision velocity to Keplerian velocity | ||
| see equation (8) | ||
| Jy | detection limit at wavelength | |
| see equation (9) | ||
| rad | mean orbital inclination of planetesimals | |
| scaling factor in size distribution | ||
| stellar luminosity | ||
| infrared luminosity of material in the cascade | ||
| stellar mass | ||
| maximum mass remaining in cascade after time | ||
| total mass of material in cascade | ||
| size distribution of material in the cascade | ||
| number of objects in cascade larger than | ||
| Myr-1 | destructive collision rate for planetesimals larger than | |
| fraction of time collisions result in | ||
| slope of size distribution | ||
| slope of size distribution expected in the gravity regime | ||
| slope of size distribution expected in the strength regime | ||
| J kg-1 | specific incident energy required to catastrophically destroy a planetesimal | |
| AU | planetesimal belt radius, assumed to be coincident with dust | |
| AU | outer planetesimal belt radius required to maintain for | |
| AU | radius of putative outer planetesimal belt feeding the dust | |
| exponent in relation | ||
| Myr | time a planetesimal belt at can sustain | |
| Myr | time since cascade initiated (assumed to be stellar age) | |
| yr | collisional lifetime of planetesimals of size | |
| yr | collisional lifetime of material of size | |
| Myr | total duration of hot episodes throughout stellar lifetime | |
| m s-1 | relative velocity of collisions | |
| m s-1 | escape velocity | |
| m s-1 | Keplerian velocity | |
| jump in size distribution expected at | ||
| kg m-3 | planetesimal density | |
| AU2 | total cross-sectional area of material in cascade |
References
- Alibert et al., (2006) Alibert, Y, et al., 2006, A&A, 455, L25
- Aumann et al., (1984) Aumann, H.H., et al., 1984, ApJ, 278, L23
- Backman & Paresce (1993) Backman, D.E., & Paresce, F., 1993, in Protostars and Planets III, eds., E.H. Levy & J.I. Lunine (Tuscon: Univ. Arizona Press), 1253
- Backman, Dasgupta & Stencel (1995) Backman, D. E., Dasgupta, A., & Stencel, R. E. 1995, ApJ, 450, L35
- Beichman et al. (2005) Beichman, C. A., et al., 2005, ApJ, 626, 1061
- (6) Beichman, C. A., et al., 2006a, ApJ, 639, 1166
- (7) Beichman, C. A., et al., 2006b, ApJ, submitted
- Benz & Asphaug (1999) Benz, W., & Asphaug, E. 1999, Icarus, 142, 5
- Bottke et al. (2005) Bottke, W. F., et al., 2005, Icarus, 175, 111
- Bryden et al. (2006) Bryden, G., et al., 2006, ApJ, 636, 1098
- Chen et al. (2005) Chen, C. H., et al., 2005, ApJ, 634, 1372
- Chen et al. (2006) Chen, C. H., et al., 2006, ApJS, 166, 351
- Davis & Farinella (1997) Davis, D.R., & Farinella, P. 1997, Icarus, 125, 50
- Decin et al. (2003) Decin, G., Dominik, C., Waters, L. B. F. M., & Waelkens, C. 2003, ApJ, 598, 636
- Dohnanyi (1969) Dohnanyi, J., 1969, Journal of Geophys. Res., 74, 2531
- Dominik & Decin (2003) Dominik, C., & Decin, G. 2003, ApJ, 598, 626
- Durda et al. (1998) Durda, D. D., Greenberg, R., & Jedicke, R. 1998, Icarus, 135, 431
- Farley et al. (2006) Farley, K. A., Vokrouhlický, D., Bottke, W. F., & Nesvorný, D. 2006, Nature, 439, 295
- Gaidos (1999) Gaidos, E. J. 1999, ApJ, 510, L131
- Gomes et al. (2005) Gomes, R., Levison, H., Tsiganis, K., & Morbidelli, A. 2005, Nature, 435, 466
- Greaves & Wyatt (2003) Greaves, J. S., & Wyatt, M. C. 2003, MNRAS, 345, 1212
- Habing et al. (1999) Habing, H. J., et al., 1999, Nature, 401, 456
- Hines et al. (2006) Hines, D. C., et al., 2006, ApJ, 638, 1070
- Kenyon & Bromley (2002) Kenyon, S. J., & Bromley, B. C. 2002, ApJ, 577, L35
- Kenyon & Bromley (2004) Kenyon, S. J., & Bromley, B. C. 2004, ApJ, 602, L133
- Kenyon & Bromley (2006) Kenyon, S. J., & Bromley, B. C. 2006, AJ, 131, 1837
- Kenyon & Luu (1999) Kenyon, S. J., & Luu, J. X. 1999, ApJ, 526, 465
- Krasinsky et al. (2002) Krasinsky, G. A., Pitjeva, E. V., Vasilyev, M. V., & Yagudina, E. I. 2002, Icarus, 158, 98
- Krivov, Mann & Krivova (2000) Krivov, A. V., Mann, I., & Krivova, N. A. 2000, A&A, 362, 1127
- Landgraf et al. (2002) Landgraf, M., Liou, J.-C., Zook, H. A., & Grun, E. 2002, AJ, 123, 2857
- Laureijs et al. (2002) Laureijs, R.J., et al., 2002, A&A, 387, 285
- Lecar et al. (2001) Lecar, M., Franklin, F. A., Holman, M. J., & Murray, N. J. 2001, ARA&A, 39, 581
- Lecar et al. (2006) Lecar, M., Podolak, M., Sasselov, D., & Chiang, E. 2006, ApJ, 640, 1115
- Leinert & Grün (1990) Leinert, C., & Grün, E. 1990, in Physics of the Inner Heliosphere I, eds. R. Scwenn, E. Marsch (Berlin, London: Springer), 207
- Lin & Ida (1997) Lin, D. N. C., & Ida, S. 1997, ApJ, 477, 781
- Liou & Zook (1999) Liou, J.-C., & Zook, H.A. 1999, AJ, 118, 580
- Lissauer & Stewart (1993) Lissauer, J. J., & Stewart, G. R., 1993, in Protostars and Planets III, eds. E. H. Levy & J. I. Lunine (Tuscon: Univ. Arizona Press), 1061
- Lisse et al. (2002) Lisse, C. M., et al., 2002, ApJ, 570, 779
- Lisse et al. (2006) Lisse, C. M., Beichman, C. A., Bryden, G., & Wyatt, M.C. 2006, ApJ, submitted
- Lovis et al. (2006) Lovis, C., et al., 2006, Nature, 441, 305
- Low et al. (2005) Low, F. J., et al., 2005, ApJ, 631, L1170
- Meyer et al. (2006) Meyer, M. R., Backman, D. E., Weinberger, A., & Wyatt, M. C. 2006, in Protostars and Planets V, eds. B. Reipurth, & D. Jewitt (Tuscon: Univ. Arizona Press), in press
- Moro-Martín & Malhotra (2003) Moro-Martín, A., & Malhotra, R., 2003, AJ, 125, 2255
- Najita & Williams (2005) Najita, J., & Williams, J.P. 2005, ApJ, 635, 625
- Nesvorný et al. (2003) Nesvorný, D., et al., 2003, ApJ, 591, 486
- O’Brien & Greenberg (2003) O’Brien, D. P., & Greenberg, R. 2003, Icarus, 164, 334
- Rieke et al. (2005) Rieke, G. H., et al., 2005, ApJ, 620, 1010
- Sheret et al. (2004) Sheret, I., Dent, W. R. F., & Wyatt, M. C., 2004, MNRAS, 348, 1282
- Song et al. (2005) Song, I., et al., 2005, Nature, 436, 363
- Spangler et al. (2001) Spangler, C., et al., 2001, ApJ, 555, 932
- Stern (1996) Stern, S. A., 1996, AJ, 112, 1203
- Stern & Colwell (1997) Stern, S. A., & Colwell, J. E. 1997, AJ, 114, 841
- Su et al. (2005) Su, K. Y. L., et al., 2005, ApJ, 628, 487
- Tanaka et al. (1996) Tanaka, H., Inaba, S., & Nakazawa, K. 1996, Icarus, 123, 450
- Telesco et al., (2005) Telesco, C. M., et al., 2005, Nature, 433, 133
- Thébault, Augerau & Beust (2003) Thébault, P., Augereau, J. C., & Beust, H. 2003, A&A, 408, 775
- Thommes et al., (1999) Thommes, E. W., Duncan, M. J., & Levison, H. F., 1999, Nature, 402, 635
- Wetherill & Stewart (1993) Wetherill, G. W., & Stewart, G. R. 1993, Icarus, 106, 190
- Wyatt et al. (1999) Wyatt, M. C., et al., 1999, ApJ, 527, 918
- Wyatt & Dent (2002) Wyatt, M. C., & Dent, W. R. F, 2002, MNRAS, 334, 589
- Wyatt et al. (2005) Wyatt, M. C., Greaves, J. S., Dent, W. R. F., & Coulson, I. M., 2005, ApJ, 620, 492
- Wyatt (2005) Wyatt, M. C., 2005, A&A, 433, 1007