Present address: ]Institut für Quantenoptik und Quanteninformation, Innsbruck, Austria. Present address: ]National Institute of Standards and Technology, Gaithersburg, MD 20899, USA.
Direct Observation of Sub-Poissonian Number Statistics in a Degenerate Bose Gas
Abstract
We report the direct observation of sub-Poissonian number fluctuation for a degenerate Bose gas confined in an optical trap. Reduction of number fluctuations below the Poissonian limit is observed for average numbers that range from 300 to 60 atoms.
pacs:
03.75.Hh, 32.80.PjThe study of the quantum statistics of light has been at the heart of modern quantum optics for many years, with examples ranging from photon anti-bunching Kimble et al. (1977) and squeezed states of light 2- (5), to quantum communication Braunstein and van Loock (2005). The emerging field of atom optics has now reached the stage where the direct measurement of atom statistics can have a similar impact. In particular, novel quantum statistics have been predicted for quantum degenerate gases under a wide range of conditions. Two recent examples are the prediction of sub-Poissonian statistics and Fock state production in the Mott insulator transition Jaksch et al. (1998) and in the Quantum Tweezer Diener et al. (2002), and atomic anti-bunching in a one-dimensional gas of repulsive bosons (Tonks-Girardeau gas) Kheruntsyan et al. (2003). More generally, it is clear that the controlled study of entanglement and quantum computing with massive particles must be based on the detection at single-atom or ion level.
Following this theoretical work, an early experiment reported number squeezing in an optical lattice based on the observation of increased phase noise Orzel et al. (2001). Subsequent experiments have provided clear and convincing evidence of the Mott insulator state 11- . In parallel work, several groups have observed novel behavior of a 1-D gas in the Tonks regime 14- . However all of these experiments were conducted with a large number of atoms and were therefore not statistical in nature.
In order to directly probe the atom statistics of these novel states, one must incorporate single-atom counting with a Bose-Einstein condensate (BEC) apparatus. We report in this Letter the experimental realization of such a system and the first direct measurement of sub-Poissonian atom number statistics in a degenerate Bose gas.
The fluctuations of atom number within a small volume in a classical ideal gas is given by , where N is the mean atom number Landau and Lifshitz (1998). For the fluctuations of atom number in a degenerate Bose gas this is not necessarily true and has been the topic of intense theoretical debate. In the case of an ideal Bose gas, number fluctuations have been studied in a box 18- and, more recently, in a harmonic trap 21- ; 24- for microcanonical and canonical ensembles. For a weakly interacting Bose gas, number fluctuations were first investigated in Ref. Buffet and Pulè (1983). The role of interactions was then further studied by including the effect of the thermal excitation of phonons in the thermodynamic limit with number-nonconserving Giorgini et al. (1998) and number-conserving Kocharovsky et al. (2000) Bogoliubov methods. Most recently, an isolated system of finite atom number was considered for studying number fluctuations in a harmonic trap Liu et al. (2003) and in a box Idziaszek et al. (1999). The result obtained in the latter case, in particular, predicted number fluctuation proportional to .
In BEC experiments reported thus far, typical shot-to-shot number fluctuations greatly exceed the Poissonian limit, presumably due to technical noise. Here we report on an ultra-stable optical trap which has a controllable trapping volume and depth. This trap can be used to achieve sub-Poissonian number fluctuations by the following mechanism: for a fully loaded trap, the potential depth in the shallowest direction is equal to the chemical potential of the degenerate Bose gas if one neglects tunnelling out of the trap. In the Thomas-Fermi (TF) limit, the atom number is proportional to for a harmonic trapping potential. The atom number is thus related to the trap depth as . From this, it is clear that a precise control of the trap depth can lead to a precise control of the atom number. This conclusion remains valid even when assuming tunnelling and a realistic nonharmonic potential.
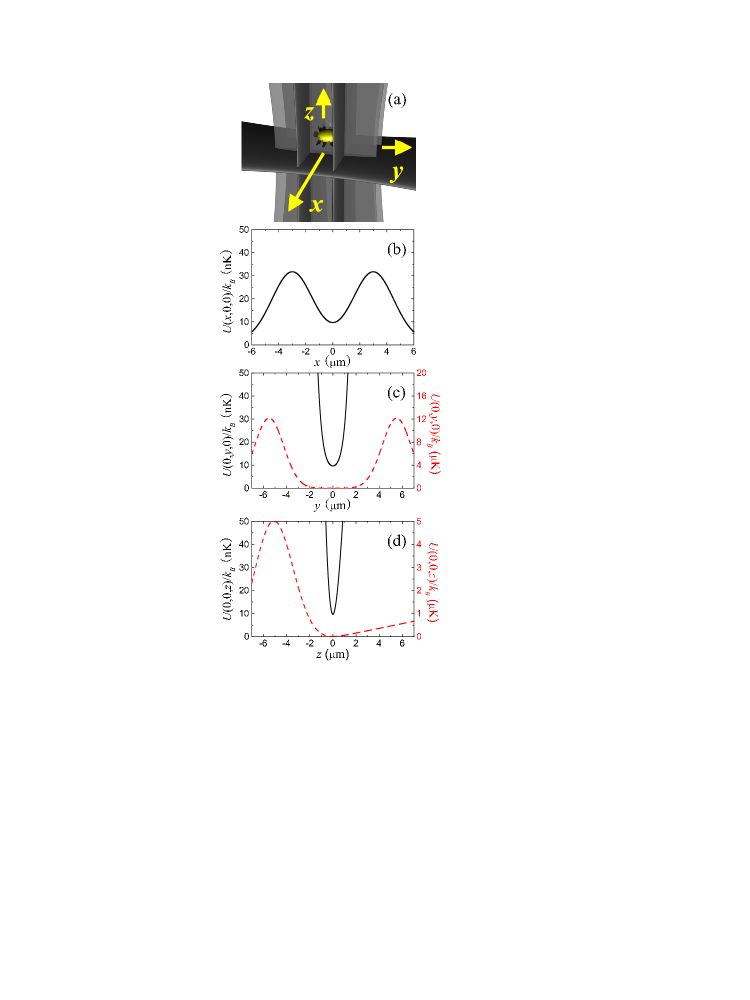
Our experimental apparatus for studying sub-Poissonian number statistics is similar to our previous work Meyrath et al. (2005a). A BEC of 87Rb atoms is produced by evaporation in a large volume optical dipole trap. The BEC is then compressed and transferred to the final small-volume optical trap. This trap is formed by five Gaussian sheets, with two pairs propagating vertically and one horizontal sheet to hold the atoms against gravity, shown pictorially in Fig. 1(a). The calculated potentials given by the measured beam parameters are shown in Fig. 1(b) to Fig. 1(d) for the respective directions. All beams originated from a 10 W laser at 532 nm are tightly focused in one axis at the position of the condensate. Each sheet pair is derived from the first order deflections of multiple frequency acousto-optical modulators, providing independent control of the position and power Meyrath et al. (2005b). The sheet pairs and the horizontal sheet have a maximum power of mW, mW, mW per sheet and a radius of m m for the x and y axes and m m for the z axis, respectively; x, y and z refer to the potential axes of Fig. 1. For typical operating conditions, the trap has a depth of 22 nK (for mW) with the weakest trapping potential in the x direction and a geometric mean trapping frequency of 300 Hz; is Boltzmann’s constant. In the final evaporation stage is ramped down adiabatically over a period of 1500 ms with an exponential shape. , being the lowest evaporation barrier, determines the chemical potential and thus the atom number. Its final value is varied to obtain different atom numbers.
Two methods are employed for measurements of atom numbers. For numbers of order or larger, absorption imaging is used yielding spatial and number information. At lower atom numbers however, fluorescence imaging is used because of higher signal-to-noise ratio in this regime. This is accomplished by transferring the atoms into a small magneto-optical trap (MOT) 16- . The MOT uses six beams with a diameter of 1 mm, an intensity of mW/cm2, a detuning of about MHz, and a magnetic field gradient of G/cm. Transfer from the optical trap to the MOT shows a saturation behavior with MOT beam intensity, indicating that all atoms are captured. The resulting fluorescence signal is detected by a charge-coupled-device (CCD) camera for 100 ms and is calibrated against an avalanche photodiode (APD). Because of the low density during exposure, there is little possibility for multiple scattering events during detection. Therefore, the measured fluorescence signal from the MOT is proportional to the number of atoms present.
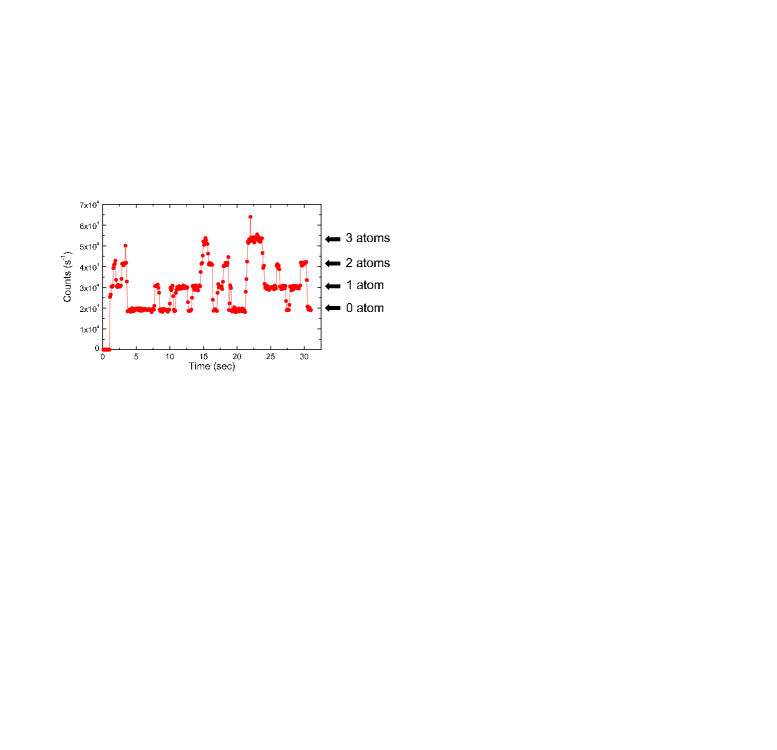
The calibration of the atom number obtained from fluorescence imaging is accomplished by operating the MOT in a regime SAD where discrete fluorescence levels of different small atom numbers are observable on an APD, as shown in Fig. 2. The MOT is then suddenly switched to the typical operating settings described above and the new fluorescence level is obtained for the same atom number. This yields an absolute accuracy in atom number better than abs . The result is consistent with calculations of the ratio of scattering rates for the given settings Metcalf and van der Straten (1999). Atom numbers may also be estimated by using the TF approximation with and modelling the trap by a harmonic potential. This yields a deviation below the measured atom numbers, indicating rough accuracy of this model.
Due to inhomogeneity of the optical potential, after the potential barrier is lowered, some atoms remain outside of the trap. These atoms are removed before the final number detection by raising the potential barrier to its maximum intensity (K) and using a supplementary optical sheet pair to sweep the residual atoms away from the well. A magnetic gradient is also applied to remove atoms outside the range of the sweeping beams.
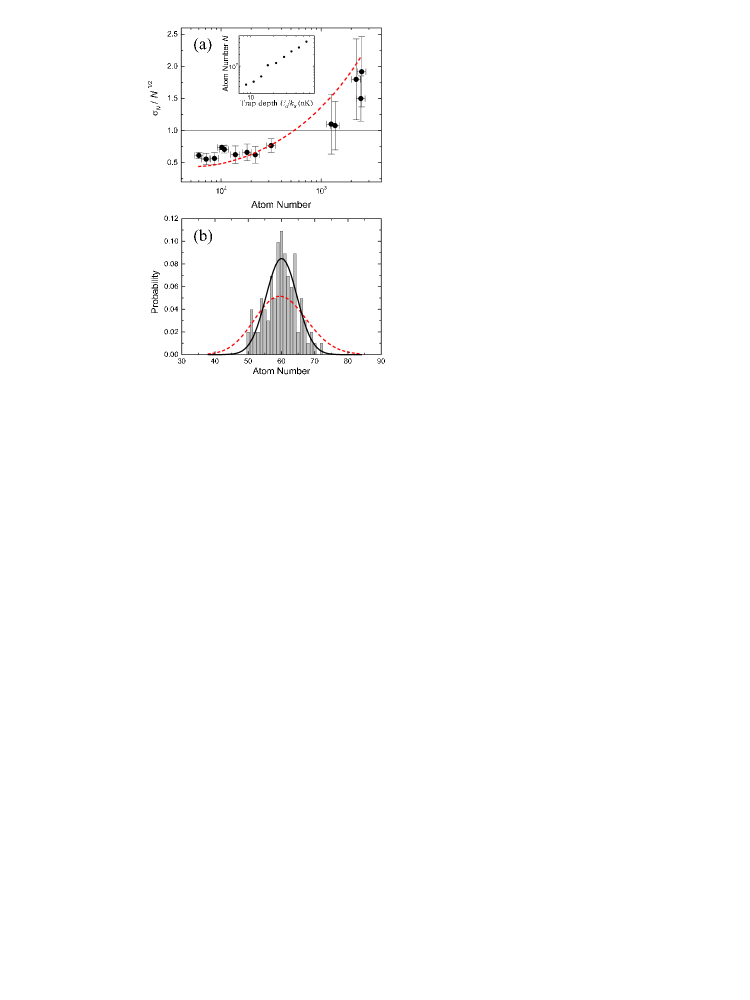
Fig. 3(a) shows the measured fluctuations normalized to the Poissonian case (solid circles) as a function of atom number. Sub-Poissonian fluctuations are observed for atom numbers below 500, where the technical noise is no longer dominant noi . The measured fluctuation at atoms is approximately of the corresponding Poissonian fluctuation. This series of 100 measurements is shown as a histogram plot in Fig. 3(b). A Gaussian fit to the data indicates a measured standard deviation of with a confidence interval of sta . This indicates a reliable measurement of deviation well below the Poissonian value of , where the error is given by absolute accuracy in atom number. Several possible technical noise sources were measured and estimates of their contribution to the atom number fluctuation result in the following noi : from , from , from , from , and from . The overall contribution due to technical noise gives an expected atom number fluctuation of , which is very close to what is measured for larger atom numbers. For lower atom numbers, background capture during the detection is a major contribution to the measured fluctuation. The background capture during the 100 ms image-taking process with no atoms present is measured to have a mean of atoms. This random process, which has Poissonian statistics, broadens the measured atom number distribution. A simple estimate of atom number fluctuation from both technical noise and background capture, assuming a constant background capture for different atom number , results in , shown as the dashed curve in Fig. 3(a). This result gives a similar increasing tendency as for the measured fluctuations. A more detailed calculation without TF approximation shows an increase in sensitivity to trap fluctuations at lower atom numbers Art .
We have measured the dependence of atom statistics on the ramp time, , in order to probe the many-body dynamics. The results are displayed in Fig. 4 where the fluctuations (normalized to the Poissonian case) are plotted as a function of . We find that for time scales shorter than 250 ms, the atom statistics become super-Poissonian, while for longer times they are sub-Poissonian. This result provides the timescale for adiabatic following, a key feature of the process. The theoretical analysis of our system is yet to be completed, and requires the development of a time-dependent many-body theory without a mean-field approximation. Surveying previous theoretical work, the closest case we have found is the analysis of relative number fluctuations between two condensates separated by a tunnel barrier that is ramped up in time Javanainen and Ivanov (1999). The authors of that paper found sub-Poissonian fluctuations in the relative atom number under appropriate conditions. However our system is considerably different, with a single trap in a quantum degenerate regime undergoing loss of atoms as the barrier is lowered. Recent work on quantum kinetic theory may provide insights to the present system Gar and finite-size trap effects are also being considered Carr et al. (2005).

In conclusion, we have observed sub-Poissonian number statistics in a degenerate Bose gas prepared in an optical dipole trap. By precisely controlling the chemical potential, we obtained a wide range of atom numbers starting at several tens and going up to a few thousand atoms. For atom numbers below a few hundred, we observed sub-Poissonian number statistics. Future work will be to eliminate sources of technical noise and to approach the Fock state.
The authors would like to acknowledge support from the Sid W. Richardson Foundation, the National Science Foundation, the R. A. Welch Foundation, and the Alexander von Humboldt Foundation. We also thank A. M. Dudarev and Q. Niu for useful discussions.
References
- Kimble et al. (1977) H. J. Kimble, M. Dagenais, and L. Mandel, Phys. Rev. Lett. 39, 691 (1977).
- 2- (5) R. E. Slusher, L. W. Hollberg, B. Yurke, J. C. Mertz, and J. F. Valley, Phys. Rev. Lett. 55, 2409 (1985); L.-A. Wu, H. J. Kimble, J. L. Hall, and H. Wu, Phys. Rev. Lett. 57, 2520 (1986); M. G. Raizen, L. A. Orozco, M. Xiao, T. L. Boyd, and H. J. Kimble, Phys. Rev. Lett. 59, 198 (1987); Y. Yamamoto and H. A. Haus, Rev. Mod. Phys. 58, 1001 (1986).
- Braunstein and van Loock (2005) S. L. Braunstein and P. van Loock, Rev. Mod. Phys. 77, 513 (2005).
- Jaksch et al. (1998) D. Jaksch, C. Bruder, J. I. Cirac, C. W. Gardiner, and P. Zoller, Phys. Rev. Lett. 81, 3108 (1998).
- Diener et al. (2002) R. B. Diener, B. Wu, M. G. Raizen, and Q. Niu, Phys. Rev. Lett. 89, 070401 (2002).
- Kheruntsyan et al. (2003) K. V. Kheruntsyan, D. M. Gangardt, P. D. Drummond, and G. V. Shlyapnikov, Phys. Rev. Lett. 91, 040403 (2003).
- Orzel et al. (2001) C. Orzel, A. K. Tuchman, M. L. Fenselau, M. Yasuda, and M. A. Kasevich, Science 291, 2386 (2001).
- (8) M. Greiner, O. Mandel, T. Esslinger, T. W. Hänsch, and I. Bloch, Nature 415, 39 (2002); M. Greiner, O. Mandel, T. W. Hänsch, and I. Bloch, Nature 419, 51 (2002); F. Gerbier, A. Widera, S. Fölling, O. Mandel, T. Gericke, and I. Bloch, Phys. Rev. Lett. 95, 050404 (2005).
- (9) T. Kinoshita, T. Wenger, and D. S. Weiss, Science 305, 1125 (2004); B. Paredes, A. Widera, V. Murg, O. Mandel, S. Fölling, I. Cirac, G. V. Shlyapnikov, T. W. Hänsch, and I. Bloch, Nature 429, 277 (2004).
- Landau and Lifshitz (1998) L. D. Landau and E. M. Lifshitz, Statistical Physics (Butterworth-Heinemann, Oxford, 1998), 3rd ed.
- (11) E. H. Hauge, Physica Nor. 4, 19 (1969); I. Fujiwara, D. ter Haar, and H. Wergeland, J. Stat. Phys. 2, 329 (1970); R. M. Ziff, G. E. Uhlenbeck, and M. Kac, Phys. Rep. 32, 169 (1977).
- (12) H. D. Politzer, Phys. Rev. A 54, 5048 (1996); M. Gajda and K. Rza̧żewski, Phys. Rev. Lett. 78, 2686 (1997); P. Navez, D. Bitouk, M. Gajda, Z. Idziaszek, and K. Rza̧żewski, Phys. Rev. Lett. 79, 1789 (1997).
- (13) M. Wilkens and C. Weiss, J. Mod. Opt. 44, 1801 (1997); S. Grossmann and M. Holthaus, Phys. Rev. Lett. 79, 3557 (1997); N. L. Balazs and T. Bergeman, Phys. Rev. A 58, 2359 (1998).
- Buffet and Pulè (1983) E. Buffet and J. V. Pulè, J. Math. Phys. 24, 1608 (1983).
- Giorgini et al. (1998) S. Giorgini, L. P. Pitaevskii, and S. Stringari, Phy. Rev. Lett. 80, 5040 (1998).
- Kocharovsky et al. (2000) V. V. Kocharovsky, V. V. Kocharovsky, and M. O. Scully, Phy. Rev. Lett. 84, 2306 (2000).
- Liu et al. (2003) S. Liu, H. Xiong, G. Huang, and Z. Xu, Phys. Rev. A 68, 065601 (2003).
- Idziaszek et al. (1999) Z. Idziaszek, M. Gajda, P. Navez, M. Wilkens, and K. Rza̧żewski, Phys. Rev. Lett. 82, 4376 (1999).
- Meyrath et al. (2005a) T. P. Meyrath, F. Schreck, J. L. Hanssen, C.-S. Chuu, and M. G. Raizen, Opt. Express 13, 2843 (2005a).
- Meyrath et al. (2005b) T. P. Meyrath, F. Schreck, J. L. Hanssen, C.-S. Chuu, and M. G. Raizen, Phys. Rev. A 71, 041604(R) (2005b).
- (21) Z. Hu and H. J. Kimble, Opt. Lett. 19, 1888 (1994); S. Kuhr, W. Alt, D. Schrader, M. Müller, V. Gomer, and D. Meschede, Science 293, 278 (2001).
- (22) A MOT intensity of mW/cm2 and a detuning of about MHz are used for this measurement.
- (23) For absorption imaging, the absolute accuracy in atom number is estimated to be .
- Metcalf and van der Straten (1999) H. J. Metcalf and P. van der Straten, Laser Cooling and Trapping (Springer, New York, 1999).
- (25) The rms technical noise is measured to be less than or equal to the following: , , , , and . Based on TF approximation in the three-dimensional regime with harmonic potentials, an estimate of the atom number fluctuation caused by technical noise gives . This limits the observation of sub-Poissonian fluctuations to , as from .
- (26) A 99 confidence interval is defined as , where is the measurement standard deviation, n is the number of samples, and (n-1), (n-1) are the upper , points of the chi-square distribution, respectively, with degrees of freedom. See, for example, R. V. Hogg and E. A. Tanis, Probability and Statistical Inference (Prentice Hall, New Jersey, 1997), 5th ed.
- (27) A. M. Dudarev, M. G. Raizen, and Q. Niu, in preparation.
- Javanainen and Ivanov (1999) J. Javanainen and M. Y. Ivanov, Phys. Rev. A 60, 2351 (1999).
- (29) C.W. Gardiner, P. Zoller, R. J. Ballagh, and M. J. Davis, Phys. Rev. Lett. 79, 1793 (1997); C.W. Gardiner, M.D. Lee, R. J. Ballagh, M. J. Davis, and P. Zoller, Phys. Rev. Lett. 81, 5266 (1998); M. D. Lee and C.W. Gardiner, Phys. Rev. A 62, 033606 (2000).
- Carr et al. (2005) L. D. Carr, M. J. Holland, and B. A. Malomed, J. Phys. B 38, 3217 (2005).