Macroscopic consequences of calcium signaling in microdomains:
A first passage time approach
Abstract
Calcium (Ca) plays an important role in regulating various cellular processes. In a variety of cell types, Ca signaling occurs within microdomains where channels deliver localized pulses of Ca which activate a nearby collection of Ca-sensitive receptors. The small number of channels involved ensures that the signaling process is stochastic. The aggregate response of several thousand of these microdomains yields a whole-cell response which dictates the cell behavior. Here, we study analytically the statistical properties of a population of these microdomains in response to a trigger signal. We apply these results to understand the relationship between Ca influx and Ca release in cardiac cells. In this context, we use a first passage time approach to show analytically how Ca release in the whole cell depends on the single channel kinetics of Ca channels and the properties of microdomains. Using these results, we explain the underlying mechanism for the graded relationship between Ca influx and Ca release in cardiac cells.
The use of Ca-sensitive receptors is ubiquitous in the design of signal transduction processes. A basic feature of this design is the close positioning of Ca-permeable channels to Ca-sensitive receptors in localized regions of the cell, often referred to as Ca microdomains Berridge (2006). Typically, the signaling takes places when a “trigger” channel delivers Ca into the microdomain, and the rise of the local Ca concentration is sensed by Ca-sensitive receptor channels. In this way, a trigger input can induce a large response signal which then facilitates downstream cellular processes. In cardiac cells this signaling architecture is used to mediate the interaction between membrane voltage and cell contraction Bers (2006), while in neurons it modulates synaptic function Sharma and Vijayaraghavan (2003).
Within a microdomain the relationship between the trigger signal and receptor response is nonlinear, since (i) Ca receptors themselves control the flow of a high concentration of Ca sequestered inside the cell, and (ii) Ca receptors are clustered so that Ca released from one receptor can induce a neighboring receptor within the microdomain to open. In this way a small increase in trigger current can induce a large autocatalytic response from a cluster of receptors, leading to an “all or none” excitability. However, the spatial separation between microdomains ensures that the Ca released in one domain does not necessarily induce release in a neighboring domain. Thus, the cell’s response to a signal such as a change in membrane potential will be dictated by the aggregate response of a population of independent microdomains. This feature of Ca signaling, referred to in cardiac physiology as “local control” Stern (1992); Wier et al. (1994), allows the cell to smoothly control its whole-cell response, despite the all-or-none nature of Ca signaling at the channel level.
Detailed simulation studies have shown that the ensemble behavior of a population of microdomains can reproduce experimentally-measured whole-cell currents Greenstein et al. (2006); Soeller and Cannell (2004). However, these studies did not provide a concise analytic relationship between channel statistics and whole-cell behavior. Also, Ca receptor clusters have been studied extensively Shuai and Jung (2002); Hinch (2004); Bár et al. (2000), but without directly addressing the relationship between trigger and response. In this paper we use a first passage time approach to study the nonlinear stochastic interaction of Ca-sensitive receptor channels and nearby “trigger” channels. We then compute the aggregate response of a population of microdomains to show how the whole-cell response depends on local Ca signaling. We apply these results to explain experimentally known features of Ca signaling in cardiac cells. For the sake of concreteness we have developed our analysis within the context of Ca signaling in cardiac cells. However, the signaling architecture we consider is found in many cellular systems Berridge (2006) and should be applicable in a broader context.
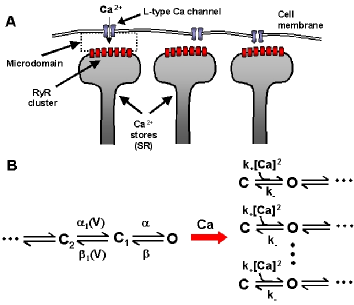
The basic architecture of Ca signaling in cardiac cells is shown schematically in Fig. 1A. Here, the signaling occurs between voltage-sensitive L-type Ca channels (LCC) on the cell membrane and a cluster of Ca-sensitive Ryanodine receptors (RyR) Bers (2006). The RyRs gate the flow of Ca from an internal store, the sarcoplasmic reticulum (SR), which has a concentration roughly times greater than in the cell. Within the microdomain, signaling occurs via the interaction of a few LCCs and a tightly knit cluster of 50 to 300 RyRs. The microdomain is shaped like a pill box of height nm and diameter nm; a typical cardiac cell has microdomains distributed throughout the cell.
To model ion channels within the microdomain we use a Markov state approach as illustrated in Fig. 1B. The single channel properties of LCCs have been studied extensively Cavalie et al. (1986); here we model a single LCC using two closed states which can transition to a Ca-permeable open state 111The Goldman-Hodgkin-Katz equation gives, for voltage (mV), where with permeability , , extracellular [Ca] , , , . Rates for the LCC Markov scheme (Fig. 1) are , , and . Other physiological parameters are , , , , , and . The membrane voltage (V) dependence of LCCs appears in the transition rates between closed states (, ), while transition rates to and from the open state ( and ) are voltage independent. The activation kinetics of RyRs are also well known Zahradnikova et al. (1999), and it is believed that the open probability is regulated by several Ca binding sites acting cooperatively on the receptor. We use a minimal model which incorporates these essential features by making the open rate (where denotes the local Ca concentration) and closing rate . The interaction between LCCs and RyRs is dominated by the activation kinetics, and so it is safe to neglect deeper states in the Markov scheme that describe slower inactivation processes.
When a cardiac cell is stimulated the rise of the membrane voltage leads to a dramatic increase in the open probability of LCCs. The subsequent Ca entry into the cell induces Ca release via RyR receptors, leading to a global rise of Ca in the cell. High resolution optical imaging of Ca Cleemann et al. (1998) in cardiac cells indeed reveals local elevations in Ca, referred to as Ca “sparks”. These sparks represent the release of Ca from the SR through RyR clusters which are activated by local LCCs. Ca sparks have relatively constant amplitude and duration Cleemann et al. (1998), and so the release flux of Ca from the SR is largely dictated by the number of Ca sparks recruited in the cell Shiferaw et al. (2003). If we denote to be the number of new sparks recruited during a small time interval , then
| (1) |
where is the number of microdomains in the cell; is the probability that an LCC makes a transition from to in the time interval , with being the probability of the closed state that directly transitions to the open state of an LCC; and denotes the probability that the LCC opening will trigger a spark. Thus, the key quantity relating the local channel interactions to the whole-cell response is the rate of spark recruitment , which depends on the trigger-response interaction described by .
To compute we first note that Ca ions inside the cell diffuse at , and thus equilibrate over the scale of the microdomain much faster (ms) than the typical channel transition times (ms). Fast diffusion yields , where is the resting Ca concentration outside of the microdomain of volume ; is the time constant of diffusion out of the microdomain; and are the number of open RyR and LCC channels, respectively; and and are the fluxes, in ions per unit time, through the respective single open channels. We set , valid for small , where is the single RyR channel conductance and is the Ca concentration in the SR. Since there are only a few LCC channels in the microdomain, each with small open probability Cavalie et al. (1986), we will simplify the system further and assume that there is only one LCC channel in each microdomain so that or .
The state of the RyR cluster can be described using a master equation for the probability that out of total RyR channels in the cluster are open, given by
| (2) |
with forward transition rate (a third-order polynomial in ) and backward transition rate . For large we can use well-known approximation methods Gardiner (1990) to reduce this one-step process to its corresponding Fokker-Planck equation (FPE), which we can write, in terms of the fraction of open channels, as
| (3) |
with drift cofficient and diffusion coefficient . The diffusion term scales as implying the increasingly deterministic nature with larger cluster size Fox and Lu (1994).
The equivalent Langevin description corresponding to this FPE implies time evolution of the mean open fraction dictated by the equation . Therefore determines the stationary points of . The deterministic component of the dynamics can be conveniently visualized in terms of a potential (Fig. 2). In the case when the Ca channel is closed (), the potential landscape reveals a bistable system with three fixed points. The stable point corresponds to an inactive cluster with very few channels open. A second stable point denotes a nearly fully open cluster. Finally, an unstable point at position indicates the peak of a potential barrier separating the closed and open cluster states. Since is small during initial spark activation, to second order we have where and , with and . The equilibrium states can then be found as and .
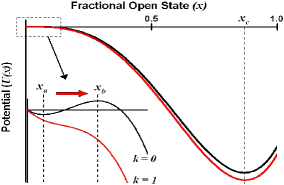
The interaction between the LCC and the RyR cluster is governed by the degree to which an LCC opening will induce a transition from to . When the LCC channel is open the barrier is reduced (or eliminated) as shown in Fig. 2, owing to the elevated Ca concentration in the microdomain due to Ca influx via the open LCC. If the LCC remains open until crosses , then a spark will almost certainly occur as proceeds to . On the other hand if the channel closes before such crossing has occurred, then as the barrier returns the cluster state will most likely return to . Thus, given a passage time from to , the LCC open time, which follows an exponential distribution , must exceed ; this yields
| (4) |
where is the first passage time density (FPTD) from to for the system given by Eq. (3).
The statistics of this FPTD have been worked out in detail in a classic paper by Darling and Siegert Darling and Siegert (1953), where they show that the Laplace transform of the FPTD can be found by solving the adjoint FPE. Linearizing the drift and diffusion coefficients so that and , where , the adjoint FPE can be written as a confluent hypergeometric differential equation, which has the linearly independent solutions and , where denotes Kummer’s function Abramowitz and Stegun (1964) with arguments , , and . Imposing reflecting boundary conditions at , since the master equation (Eq. (2)) does not admit negative valued states, the probability of sparking can be written Darling and Siegert (1953) as
| (5) |
where and are the derivatives of the independent solutions evaluated at the origin. Eq. (5) gives a full description of the sparking probability given a trigger current with duration from the distribution .
The analytic formula for the spark rate (Eq. (5)) can be simplified further in the limit of large or small LCC current (). Using the asymptotic form of the Kummer function Abramowitz and Stegun (1964), for large we have
| (6) |
In this limit, the response is governed by the mean open time of the LCC, and does not strongly depend on the stochastic properties of the RyR cluster. For small a barrier must be surmounted, and stochastic fluctuations due to the RyR channels dictate the probability for sparking. In this regime, to leading order we have
| (7) |
showing the strong dependence on RyR cluster size .
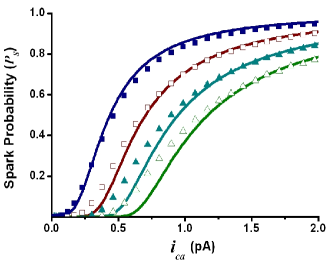
In order to check the validity of this analytical result we simulate independent Monte Carlo trajectories of the master equation to estimate the probability of sparking () given an LCC opening at time , in an ensemble of microdomains whose clusters are initially closed (). Within each unit a single LCC is opened for a duration chosen from . We then estimate as the fraction of microdomains whose clusters reach within that time. In Fig. 3 the predictions of Eq. (5) are compared with the numerical simulations. As shown, the agreement is quite good.
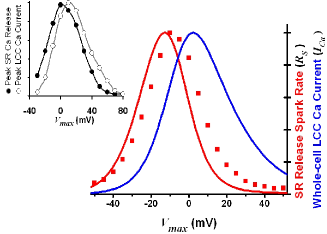
In experiments, the relationship between Ca entry and Ca release can be assessed by depolarizing the membrane to various test voltages . The peak total currents for LCC Ca entry and SR Ca release are then measured following the depolarization. In Fig. 4 (inset) we reproduce the experimental data of Wier et al. Wier et al. (1994), showing that both Ca release and Ca entry follow a bell-shaped dependence on . This relationship is well established, and referred to as graded release. Since the spark recruitment rate is directly related to the amount of Ca released from the SR, we check this relationship by computing the spark rate as a function of . Figure 4 shows the peak spark rates due to a depolarization to , using our analytically calculated from Eq. (5) in Eq. (1), as well as by simulating independent microdomains with Markov-governed LCCs initially in state . Numerically, the spark rates were estimated by counting the number of sparks recruited in ms intervals. Also plotted is the peak whole-cell Ca current estimated by , where is the steady-state open probability of the LCC. As shown, consistent with graded release, the spark rate dependence on follows a bell curve mirroring the Ca entry , and the analytical predictions agree semi-quantitatively with the numerical simulations.
The graded relationship between whole-cell Ca release and Ca entry is reflected in the spark recruitment rate (Eq. (1)). For large negative is large and every LCC opening will trigger a spark. In this regime the spark rate is dominated by the voltage dependence of , which roughly follows , since and are fast voltage-independent rates. As is increased further, decreases and is reduced as the probability of triggering a spark is less. Similarly, also decreases due to the drop in the single channel current . Hence, Eq. (1) reproduces experimentally measured whole-cell properties in terms of the kinetics of ion channels in Ca microdomains. A more detailed analysis of the analytic prediction will be presented in a future publication.
In this letter we have analyzed the stochastic properties of Ca signaling at both the whole-cell and ion channel level. The main result is an analytic description of the relationship between single channel kinetics and the aggregate whole-cell response. In the context of the cardiac cell, we have reproduced important voltage-dependent relationships which are known experimentally, but until now have not been explained in detail. This work should pave the way to a more detailed understanding of Ca signaling in a wide range of biological processes.
This work is supported by the NSF and NIH/NHLBI P01 HL078931; R.R. thanks Tom Chou and Vladimir Minin for valuable discussions. Y.S. thanks A. Karma for valuable discussions, and the KITP Santa Barbara, where part of this work was completed.
References
- Berridge (2006) M. J. Berridge, Cell Calcium 40, 405 (2006).
- Bers (2006) D. M. Bers, Excitation-Contraction Coupling and Cardiac Contractile Force (Developments in Cardiovascular Medicine) (Springer, 2006).
- Sharma and Vijayaraghavan (2003) G. Sharma and S. Vijayaraghavan, Neuron 38, 929 (2003).
- Stern (1992) M. D. Stern, Biophys J 63, 497 (1992).
- Wier et al. (1994) W. G. Wier, T. M. Egan, J. R. Lopez-Lopez, and C. W. Balke, J Physiol 474, 463 (1994).
- Greenstein et al. (2006) J. L. Greenstein, R. Hinch, and R. L. Winslow, Biophys J 90, 77 (2006).
- Soeller and Cannell (2004) C. Soeller and M. B. Cannell, Prog Biophys Mol Biol 85, 141 (2004).
- Shuai and Jung (2002) J.-W. Shuai and P. Jung, Biophys J 83, 87 (2002).
- Hinch (2004) R. Hinch, Biophys J 86, 1293 (2004).
- Bár et al. (2000) M. Bár, M. Falcke, H. Levine, and L. S. Tsimring, Phys Rev Lett 84, 5664 (2000).
- Cavalie et al. (1986) A. Cavalie, D. Pelzer, and W. Trautwein, Pflugers Archiv 406, 241 (1986).
- Zahradnikova et al. (1999) A. Zahradnikova, I. Zahradnik, I. Gyorke, and S. Gyorke, J. Gen. Physiol. 114, 787 (1999).
- Cleemann et al. (1998) L. Cleemann, W. Wang, and M. Morad, Proc Natl Acad Sci U S A 95, 10984 (1998).
- Shiferaw et al. (2003) Y. Shiferaw, M. A. Watanabe, A. Garfinkel, J. N. Weiss, and A. Karma, Biophys J 85, 3666 (2003).
- Gardiner (1990) C. W. Gardiner, Handbook of Stochastic Methods (Springer-Verlag, Berlin, 1990).
- Fox and Lu (1994) R. F. Fox and Y. Lu, Phys. Rev. E 49, 3421 (1994).
- Darling and Siegert (1953) D. A. Darling and A. J. F. Siegert, Ann. Math. Stat. 24, 624 (1953).
- Abramowitz and Stegun (1964) M. Abramowitz and I. Stegun, Handbook of Mathematical Functions with Formulas, Graphs, and Mathematical Tables (Dover, New York, 1964).