Comparative analysis of protein structure using multiscale additive functionals
Abstract
This work reports a new methodology aimed at describing characteristics of protein structural shapes, and suggests a framework in which to resolve or classify automatically such structures into known families. This new approach to protein structure characterization is based on elements of integral geometry using biologically relevant measurements of shape and considering them on a multi-scale representation which align the proposed methodology to the recently reported tube picture of a protein structure as a minimal representation model. The method has been applied with good results to a subset of protein structures known to be especially challenging to revert into families, confirming the potential of the proposed method for accurate structure classification.
I Introduction
Evolution has produced a huge number of protein families and super-families whose members possess similar sequences and three-dimensional structures. Restraints on evolutionary divergence are mainly related to the protein function, and therefore selective pressure tends to operate on the three-dimensional structure Bajaj:1984 . The HOMSTRAD HOMSTRAD is an example of a database of protein structures organized into homologous families. As a consequence of the global proteomic effort, the number of known structures is growing at an impressive rate and has passed the total of 39000 structures. It is remarkable progress but, on the other hand, it also introduces an overwhelming amount of data to be manually classified on those databases. With more than 400 structures solved every month, the challenge for automatic protein structural comparison and classification is greater than ever. Most of the protein comparison methods depend mainly upon structural alignment and RMSD measures, and therefore are not completely reliable Koehl:2001 . While RMSD is a good measure of structure similarity for almost identical proteins, it cannot be used to judge dissimilarity since it violates the triangle inequality. It means that any system based on RMSD alone is unable to cluster structures and, consequently incapable of classifying them into families. In addition, the reliance on sequence alignments introduces a drawback because it is virtually impossible to avoid errors during the alignment construction.
In this paper we investigate the potential of an algorithm adapted to automatically classify proteins into HOMSTRAD families. This algorithm is based on concepts of Integral Geometry Stoyan:1995 , know as Morphological Image Analysis (MIA), which has been recently applied to a series of problems due to its simplicity in design and implementation. Fields as diverse as Neuroscience Barbosa:2003b and Materials Sciences Raedt01 have benefited from this approach.
II Additive Shape Functionals
We start by describing the mathematical aspects of the adopted procedure. The Minkowski functionals of a body in the plane are proportional to the familiar geometric quantities of area , perimeter and the connectivity or Euler number . The usual definition of the connectivity from algebraic topology in two dimensions is the difference between the number of connected components and the number of holes , . In the Euclidean space, there are two kinds of holes to consider. First, we have the pure hole, a completely closed region of white voxels surrounded by black voxels. Second, the tunnels. The Euler characteristic is consequently given as , where is the number of tunnels and is the number of pure holes. There is an additional geometric quantity to consider in the three-dimensional space, namely the mean curvature or breadth . By exploring the additivity of the Minkowski functionals, their determination reduces to counting the multiplicity of basic building blocks that disjointly compose the object. For example a voxel can be decomposed as a disjointed set of 8 vertices, 12 edges, 6 faces and one open cube. The same process can be applied to any object in a lattice. For a three-dimensional space, which is our interest regarding protein structures, see Raedt01 ; Barbosa:2003b , we have
| (1) | |||
Where is the number of interior cubes, is the number of open faces, is the number of sides and is the number of vertices. So, the procedure to calculate Minkowski functionals of a pattern can be reduced to counting the number of elementary bodies of each type that compose a voxel (cubes, faces, edges and vertexes) belonging to .
III Protein structure, tube picture and multiscale signatures
The protein structure in our approach is defined essentially by the geometrical/topological nature of its backbone. All -carbon atom coordinates are identified from a .pdb file and an interpolation scheme is used to connect neighboring atoms by a straight path. This design procedure attaches a variable resolution to the method, as the highly refined atomic scale data has to be truncated during the process.
In our analysis the calculation of the Minkowski functionals are incorporated into a multiscale framework. In such a scheme, all four quantities are calculated as a function of a control parameter as some transformation is made on the structure of interest. In this paper we consider this transformation to be the process of exact dilations and the control parameter the dilation radius. Our choice is particularly suited as the exact dilation procedure naturally fits itself in what has been described as the tube picture for protein structure analysis Banavar:2003 , a minimalist biophysical reasoning of the protein model. While the intricate aspects of the geometry/topology are accounted for at each spatial scale by the Minkowski functionals, the space surrounding the backbone is probed by performing the dilation of the structure and this information is condensed in what we call henceforth multiscale signatures. The behavior of such signatures, particularly the topologically related ones, can be discontinuous. For example the process of dilation may change abruptly the number of pure holes or tunnels at particular scales and these facts are registered for all scales in the multiscale signature for the connectivity or Euler number (characteristic).
IV Results and Discussion
 |
 |
 |
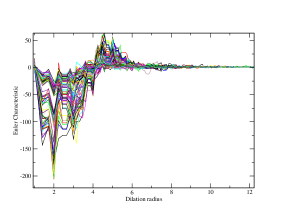 |
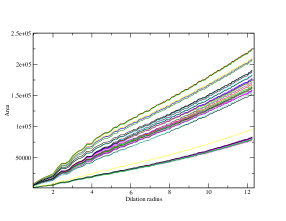
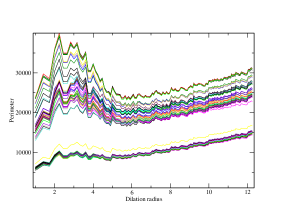
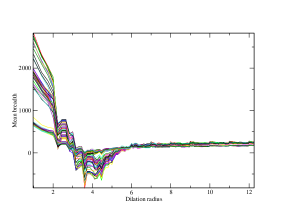
Figure 1 shows all considered functionals signatures for a set of 71 proteins which were chosen specifically because of their similarities. The range of scales shown in these graphs encompasses the initial structure and the final filled volume without holes and tunnels (). There are both similarities and striking differences whose subtleties, until now, have been handled only by more complex algorithms.
For each of those signatures in Figure 1 we select three features in an attempt to globally characterize the structure and, by doing so, minimize the amount of data needed for future classification based on Minkowski functionals. For the signatures of Area and Perimeter, we evaluated the standard deviation, its integral, and the scale at which the integral of the curve reaches half of the total value. For the signatures of the Connectivity and of the Mean Breadth we measured the standard deviation, the integral of the curve and the monotonicity index given by where are the counts for each time the curve increase, decrease or stay constant.
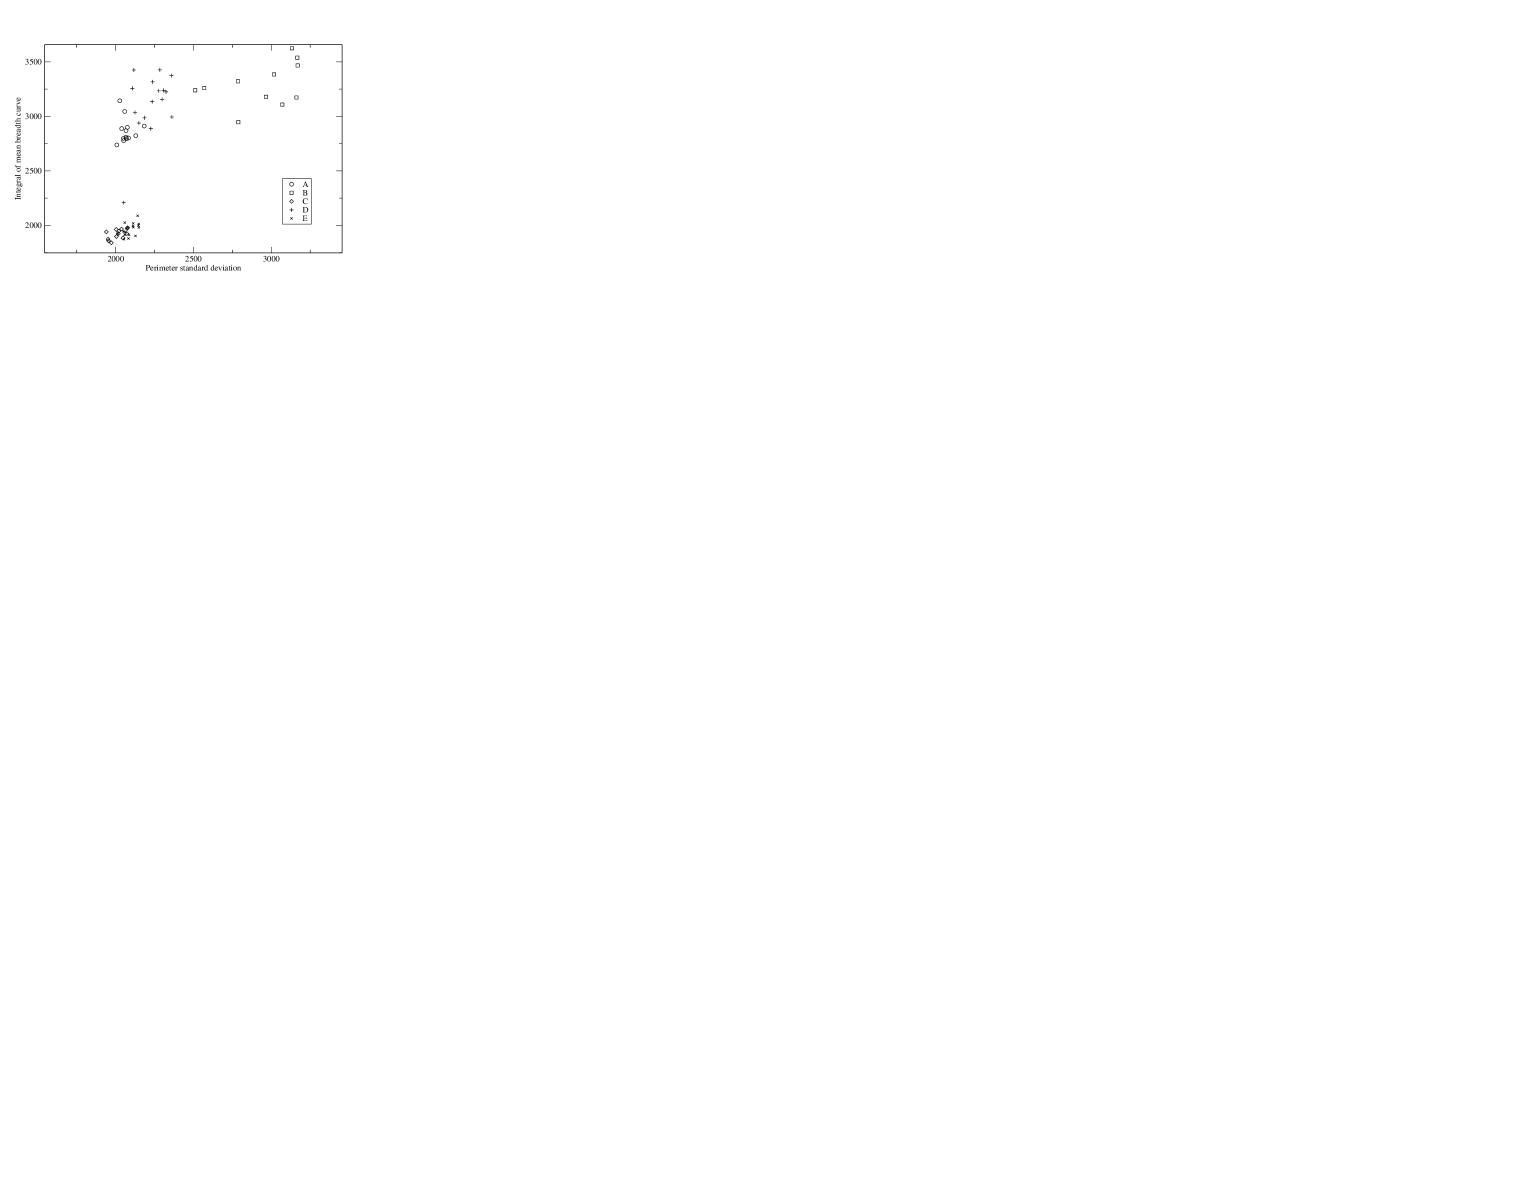
Table 1 shows the numeric results obtained by classical discriminant analysis McLachlan:1992 based on the twelve above global measures and quantifies the classification potential of the proposed framework. Such a discriminant analyis projects the measurements in such a way as to optimize their separation, expressed in terms of high interclass and low intraclass dispresions. It is remarkable that, although the structures were specially chosen to make a reduction into families difficult, this approach managed to perfectly classify four out of the five families. A mistake was made in class C, were it misclassified 1 out of 13 structures. It is worthwhile to note that although exhibiting different foldings, alpha plus beta in the class C and all alpha in the class E, their average length and topological properties in general are quite similar. Figure 2 shows a two-dimensional section of the complete feature space defined by measures from the mean breadth and connectivity only. It provides a more economical discriminating clustering, albeit with overlaps.
| A | B | C | D | E | Error | Posterior.Error | |
|---|---|---|---|---|---|---|---|
| A (asp) | 13 | 0 | 0 | 0 | 0 | 0.0000000 | 0.0000477 |
| B (ghf13) | 0 | 11 | 0 | 0 | 0 | 0.0000000 | 0.0000025 |
| C (ghf22) | 0 | 0 | 12 | 0 | 1 | 0.0769231 | 0.1051906 |
| D (kinase) | 0 | 0 | 0 | 16 | 0 | 0.0000000 | 0.0247150 |
| E (phoslip) | 0 | 0 | 0 | 0 | 18 | 0.0000000 | -0.0104105 |
| Overall | 0.0140845 | 0.0221997 |
V Conclusion
In this paper we have accessed the potential of the multi-scale Minkowski functionals for protein morphological characterization and structural analysis. We found that these functionals are potentially suited to this kind of analysis, as substantiated by the results obtained for a distinct set of structures known to have highly similar topological features. For all but one family of structures, namely the glycosyl hydrolase family 22, the classification through a classical discriminant analysis yielded fully accurate results. These results are comparable with the best approach so far Rogen:2003 , which uses considerably more parameters and is based on a complex concept. In addition to the classification result, it is important to emphasize the simplicity of the algorithm and the clear relationship between the quantities used for the characterization and familiar geometrical, topological and biological concepts. This direct relation to familiar measurements, combined with the simplicity for implementing the MIA approach, suggests that this kind of analysis is a particularly useful tool for classifying the shape of protein structures.
References
- [1] M. Bajaj and T. Blundell. Evolution and the tertiary structure of proteins. Ann. Rev. Biophys. Bioeng., 13:453–92, 1984.
- [2] K. Mizuguchi, C. M. Deane, T. L. Blundell, and J. P. Overington. Homstrad: a database of protein structure alignments for homologous families. Protein Sci., 7(11):2469–2471, 1998.
- [3] P. Koehl. Protein structure similarities. Curr. Opin. Struct. Biol., 11:348–353, 2001.
- [4] D. Stoyan, W. S. Kendall, and J. Mecke. Stochastic Geometry and its applications. Wiley, West Sussex, England, 1995.
- [5] M. S. Barbosa, L. da F. Costa, E. S. Bernardes, G. Ramakers, and J. van Pelt. Characterizing neuromorphologic alterations with additive shape functionals. European Physical Journal B, 2004.
- [6] K. Michielsen and H. de Raedt. Integral-geometry morphological image analysis. Physics Report, 347:461–538, 2001.
- [7] Jayanth R. Banavar and Amos Maritan. Geometrical approach to protein folding: a tube picture. Review of Modern Physics, 75(1), 2003.
- [8] G. J. McLachlan. Discriminant analysis and statistical pattern recognition. Wiley, 1992.
- [9] Peter Rogen and Boris Fain. Automatic classification of protein structure by using gauss integrals. PNAS, 100:119–124, 2003.