Mechanisms of organogenesis of primary lymphoid follicles
Abstract
Primary lymphoid follicles in secondary lymphoid tissue of mammals are the backbone for the formation of follicular dendritic cell networks. These are important for germinal center reactions. In the context of organogenesis molecular requirements for the formation of follicles have been identified. The present study complements this work with a simulation of the dynamics of the primary lymphoid follicle formation. In contrast to other problems of pattern formation, here, the homeostasis of the cell population is not governed by a growth-death balance but by a flow equilibrium of migrating cells. The influx of cells into secondary lymphoid tissue was extensively studied while less information is available about the efflux of lymphocytes from secondary lymphoid tissues. This study formulates the minimal requirements for cell efflux that guarantee a flow equilibrium and, thus, a stable primary lymphoid follicle. The model predicts that in addition to already identified mechanisms a negative regulation of the generation of follicular dendritic cells is required. Furthermore, a comparison with data concerning the microanatomy of secondary lymphoid tissues yields the conclusion that dynamical changes during the formation of FDC networks of the lymphatic endothelium are necessary to understand the genesis and maintenance of follicles.
Keywords:
lymphocytes, follicular dendritic cells, chemotaxis, spleen and lymph nodes, negative regulation
List of abbreviations:
ELV efferent lymphatic vessel,
FDC follicular dendritic cell,
FRC fibroblastic reticular cell,
HEV high endothelial venule,
LE lymphatic endothelium,
LN lymph node,
LT lymphotoxin,
PLF primary lymphoid follicle,
S1P sphingosine 1-phosphate,
S1P1 S1P receptor 1,
SLT secondary lymphoid tissue,
TNF tumor necrosis factor
1 Introduction
The primary lymphoid follicle (PLF) is the precursor state of germinal centers in secondary lymphoid tissue (SLT) [1]. The most important constituents are naive B cells and follicular dendritic cells (FDC). PLF serve as a filter for antigen and bring B cells into contact with antigen presented by FDC in order to start a germinal center reaction [2].
In mammals PLF first develop around birth [3, 4, 5, 6, 7, 8]. During the past decade many molecules relevant to the formation of PLF could be isolated. With an extensive number of knockout and antibody-blocking experiments the contributions of TNF-, LT, LT, LIGHT, and TRANCE secondary lymphoid organ structure and in the formation of PLF have been identified (reviewed in [9, 10, 11]).
The homeostatic chemokines CCL19, CCL21 and CXCL13 are involved in guiding the lymphocytes to their compartment (reviewed in [12]). CXCL13 is secreted by FDC and acts as chemoattractant for B cells via the CXCR5 chemokine receptor. CCL19 and CCL21 are produced by different cell populations in the T zone of SLT. The common receptor CCR7 is expressed by T cells. The expression of these chemokines and the presence of FDC depend on LT, TNF- and related molecules. The precise molecular interactions and chemokine expression profiles slightly vary for different SLT [9, 10, 11], however, in most SLT a persistent LT-stimulus is needed for both the induction and the maintenance of FDC networks [13]. Further studies suggested that the maintenance of the PLF structure is mediated by a positive feedback loop [14]: B cells are stimulated by CXCL13 to express high levels of LT. This in turn stimulates FDC to produce CXCL13.
An interesting property of PLF is their equal size of several hundred in all mammals ranging from mice to horses [15, 16, 17, 18, 19, 20, 21, 22]. Thus, the follicle size does not scale with the size of the animals or of the organs under consideration, which is considered to be a strong boundary condition for simulations of PLF formation and maintenance. The formation of PLF is studied with a simulation based on a previously introduced agent-based model [23] on top of a regular triangulation [24, 25, 26]. A clear separation of B and T cells is achieved using chemoattraction to an exit spot for the lymphocytes overlaying the different chemokine responses of B and T cells to their homing chemokines CXCL13, CCL21, and CCL19. Formation of a PLF and an adjacent T zone is found when assuming the generation of FDC from T zone stromal cells by sufficiently large B cell aggregates. However, then, the location of the PLF relative to lymphatic vessels is not in agreement with experiment. The present study concentrates on the correct formation of the lymphatic vessels and the PLF without considering the dynamics of the T zone of T cells. The model includes lymphangiogenesis, which dramatically changes the dynamics of the PLF formation, its geometry and also the regulation mechanisms involved in PLF maintenance and size regulation. It is found that a negative regulation of the FDC generating process is required. Furthermore it is demonstrated that a chemotactic activity of B cells for S1P is in contradiction to PLF morphology, suggesting that S1P chemotaxis is not active during PLF formation and maintenance in vivo, which was also found in experiment [27].
2 Model of primary lymphoid follicle formation
This section describes the properties of a minimal model for PLF formation. In addition the model of lymphangiogenesis is discussed. The mathematical framework is briefly summarized in the method section (Sec. 5) and is presented in more detail in [23].
2.1 Flux of naive B cells
Essential ingredients to study the formation of the PLF are the B cell flux, the FDC and the FDC precursor cells. The B cells are constantly entering SLT via high endothelial venules (HEV) in the cases of mucosa-associated lymphoid tissue (MALT) and lymph nodes (LN) or along the central arterioles through the peri-arteriolar sheath of the spleen (reviewed in [12]). The exit route of lymphocytes through lymphatic endothelium (LE) is less clearly identified. Recent experimental data (see [12]) suggest that B cells leave MALT via efferent lymphatic vessels (ELV). In LN and spleen the lymphatic sinuses guide lymphocytes to draining ELV. As the sinuses merge with the ELV they are considered to belong to the efferent lymphatic system in the simulation.
The morphology of the LE is very similar across the different SLT and species. Studies using corrosion casts revealed that the LE is formed around the follicles. The precise shape ranges from half-open baskets around the follicle base to almost closed shells enclosing the whole follicle. The LE forms a dense network in the non-follicular area [21, 28, 29, 30, 31, 32, 33, 34, 35, 36, 37].
The role of LE in lymphocyte emigration is supported by a study of the corresponding structure in the Bursa of chicken [38] and the identification of openings in the LE nearby follicles [28, 31]. The exit of lymphocytes via LE is further supported by a newly identified mannose receptor on LE. This receptor may guide the specific exit route of lymphocytes via the lymphatic sinuses [39]. It is almost exclusively found on the lymphatic vessels in the LN and binds CD62L, thus, guiding lymphocytes to the ELV and allowing their exit from LN.
S1P might be involved in the regulation of lymphocyte egress from SLT [12, 40, 41, 42]. S1P acts as a chemoattractant for lymphocytes in vitro [40]. Thus, the dynamics of the S1P receptor S1P1 is considered in the simulation: The LE is widely engulfing follicles such that lymphocytes have to migrate around or across these structures in order to reach the follicles. Therefore a minimal transit time through SLT should be governed by some mechanism that prevents the lymphocytes from entering and transmigrating across the LE. In the simulation it is assumed that S1P1 is downregulated when B cell enter SLT and required for lymphocyte emigration. This is supported by studies using the S1P1 agonist FTY720 [40, 41, 42, 12]. There is good agreement between the minimal transit time of lymphocytes [33, 43, 44, 45] and the time required to fully upregulate S1P1 on lymphocytes [42] both of which are in the order of 3 hours.
2.2 Origin of FDC
One fundamental question in the PLF formation is: Where do the FDC come from? The most commonly accepted view is that FDC are derived from stromal cells which might be related to the stromal cells observed in the T zone. These stromal cells are fibroblastic reticular cells (FRC) [46, 47, 48, 49]. Comparative reviews supporting the mesenchymal origin of FDC can be found in [50]. The evidence for the relation of FDC to FRC is given by shared markers [51]. There exists a gradual decrease of the fibroblast marker ASO-2 from the T zone to the heart of a germinal center. This decrease is accompanied by a gradual morphological change from the ’classical fibroblastic’ to the typical FDC morphology [52]. A similar change of marker expression has been observed in the PLF although a few intermediate steps are missing. Indirect evidence for the reverse transition from FDC to stromal cells is provided by culture experiments in which purified FDC gradually loose characteristic FDC marker one by one, finally turning stromal cell-like again [53, 54, 55]. This suggests that persistent stimuli are required to maintain the FDC phenotype. Thus, the study of typical FDC marker expression indicates a smooth transition from stromal cell precursors to FDC by subsequent accumulation of ’FDC-ness’ of the stromal cells. A recent study of FDC development in human LN supports the idea of local FDC differentiation: FDC seem to acquire more and more markers like those found in culture experiments extending the ’FDC-ness’ picture to several other markers [20]).
Observations of slow replacement of FDC by migratory precursors and of inefficient seeding by bone marrow-derived cells argue against a hematopoietic origin of FDC [56]. However, a clear relationship between FRC and FDC could not be identified in a study based on newly developed markers [49]. Bone marrow transfer into severe combined immunodeficiency (SCID) mice revealed donor-derived FDC suggesting that the stromal cells may originate from the bone marrow [57]. TNFR-I knockouts and mice given injections of a blocking TNFR-I-Ig exhibit immature FDC or FDC precursors around splenic follicle suggesting migrative FDC progenitors [58]. Similar conclusions have been drawn from TNF- and TNFR-I-/- [59]. More support for the immigration of FDC precursor instead of local differentiation comes from the expression pattern of TuJ1, a microtubule-protein [60]. The broad distribution with single positive cells scattered around lymphoid follicles suggests migratory activity of FDC. Reconciling both theories, FDC might be a heterogeneous population that can develop from hematopoietic and stromal precursors [61, 56]. This favor the vantage point adopted in this study considering FDC as a state of cells rather than a differentiated form of some cell type.
In the simulation FDC differentiate from FRC. This can be viewed as FDC being an ’excited’ state of stromal cells. However, this must not be interpreted in a strict sense. The mechanism in the simulation is indistinguishable of the interpretation that FRC and FDC have a common progenitor which can develop in either FRC or FDC depending on the external stimuli. Newly developing FDC replace existing FRC at their site of generation.
In a simplified PLF model it could be shown that sufficiently large aggregates of B cells forming around stromal cells can induce the presence of FDC if basal levels of LT are expressed on the B cells [23]. The migration properties of B cells derived from the experiment are such that the duration and size of the B cell-FDC contacts are sufficient to allow for a high LT stimulus of a single FDC by the interaction with many B cells. The stimulus can last for several hours which seems to be reasonable according to the experimental data [23, 29, 13, 62]. Thus, we conclude, that the positive feedback loop [14] (which is included in the simulation) is not absolutely required to explain initial FDC formation.
2.3 Phenomenological lymphangiogenesis model
Lymphangiogenesis is included in the model in order to generate a LE distribution that matches the experimental situation [21, 28, 29, 30, 31, 32, 33, 34, 35, 36, 37]. It is assumed that the LE is not preformed which would determine shape and position of PLF a priori. A preformed LE gap would immediately raise the question what generates this specific LE pattern. Thus, in the simulation the generation of FDC is anti-correlated with the LE dynamics: LE is degraded when FDC are formed in the vicinity. It is assumed that the anti-correlation between FDC and LE is local, i.e. the LE-degradation process is not governed by a long ranged diffusion of molecular messengers. In a similar manner LE is forming at places where FDC have transformed back into FRC. Angiogenesis and lymphangiogenesis models are still under development [63, 64, 65, 66]. Therefore, the present tissue simulation takes into account vessel formation and degradation in the described phenomenological sense without considering the underlying mechanisms.
2.4 Internalization of CXCR5
The B cells have to leave the PLF before they can exit from the SLT. LE will dynamically enclose the follicles. Thus, B cells frequently reach the surface of the follicle and randomly move until a lymphatic vessel has been found for exit. Alternatively, they might return to the follicle. It is assumed that this search for exit points is regulated by B cell chemotaxis. As the chemotactic response of leukocytes can be modulated by receptor internalization (reviewed in [67]), in the simulations this regulation is mediated by internalization of the CXCL13 receptor CXCR5.
2.4.1 Regulation of chemotaxis
Studies on neutrophils demonstrated that desensitization of chemoattractant receptors occurs predominantly for high concentrations of the chemoattractant [68]. One mode of desensitization is the internalization of the chemokine receptor. However, in line with the dependence on high concentrations, it has been shown that internalization is not absolutely required for chemotactic responses [69, 70, 71, 67]. For example CCL21 does not induce the internalization of CCR7 in contrast to CCL19 which causes the downregulation of this chemokine receptor [70]. It is a general observation that different ligands of the same receptor cause different internalization levels [67].
Of note, some experiments fail to detect CXCL13 responses of naive B cells freshly isolated from tonsils although the B cells where equipped with high levels of the corresponding receptor CXCR5 [72]. Thus, the presence of chemokine receptors CXCR5 is necessary but not sufficient to cause chemotaxis of naive B cells. Most likely the suppression of the function of the CXCR5 chemokine receptor is mediated by a desensitization mechanism either by internalization or cross-desensitization (see below).
The importance of the receptor state can be demonstrated by the response of B cells towards CCL21. The surface CCR7 level on freshly isolated B cells is undetectable [73]. The protein can be identified in the cytoplasm and is brought to the surface in chemokine-free culture. This suggests receptor internalization by natural exposure to CCL21 or CCL19 in the tissue. Freshly isolated T cells also show little attraction by CCL19 [74] suggesting an internalization mechanism for T cells as well. However, the CCR7 levels have not been investigated in detail. Internalization may explain why despite the presence of CCL21 in the T zone, and lymphocyte expression of the associated receptor CCR7, no chemotaxis has been observed in this area [75].
The presented data supports the notion that the chemotactic response of lymphocytes in SLT can be modified by receptor internalization. Therefore cells may be unresponsive to chemokines despite proper receptor expression and in vitro responses.
Note, that within the model framework regulation of chemotaxis on the basis of other mechanisms like transcriptional regulation is not incorporated.
2.4.2 Complex responses to multiple chemokines
In several systems cross-talks between different chemokines/chemokine receptors have been observed [71]. An example is the cross-desensitization that has been reported for CXCL12 which blocks the CCL19 response of lymphocytes while CCL19 does not block CXCL12 [76]. As expected cross-desensitization is found when different chemokines use the same receptor – as shown for CCL19 and CCL21 [77].
Not in all cases the effect of multiple chemoattractant is pairwise blocking of the responses. It is also possible that the cell computes a vector sum of the incoming signals to determine an average direction of multiple chemoattractants [78]. Only the direction of cell migration is influenced by the integrated response, while the speed remains unchanged. This reaction is altered if multiple signals are given in some sequential order. Then the direction is dominated by the newest chemoattractant even for lower concentrations and/or gradients [78]. An explanation for this behavior would be the desensitization of receptors for instance by internalization (see above and [70]). The desensitization state represents some memory for the chemoattractants a leukocyte is encountering.
Instead of desensitization a hierarchy of chemoattractants might exist. Indeed, two signaling pathways for two different chemoattractant receptors have been identified [79]. The hierarchy levels are named ’target’ and ’intermediary’ chemoattractants. When only concurrent intermediary signals are provided the cell responds by computing the vector sum otherwise the target chemoattractants are preferred.
Which type of response results from multiple signals may rely on the signaling cascade, i.e. which receptors share or use a concurring cascade to induce directed cell migration. The data available on the chemokines CCL19, CCL21, CXCL13, and S1P, which are important for the PLF system, are not sufficiently conclusive to allow the determination of a signaling hierarchy. Activated naive B cells upregulate there CCR7-levels by a factor of two to three and consequently enhance their response to CCL19/CCL21. This balances their CXCL13 response such that they migrate to the border between the PLF and T zone [10, 12, 72, 73, 80, 81, 82]. When either CXCR5 is overexpressed or CCR7 is lacking B cells fail to relocate to the follicle border upon antigen-stimulation and remain in the follicle [81]. Similar if CCR7 is overexpressed by genetic manipulations the B cells locate at the border without antigen and are moving farther into the T zone. Analogously, activated T cells upregulate the response to CXCL13 relocating to the follicle border as well [12, 80, 83, 84].
Overall this suggests that the relevant chemokines in the PLF system have the same hierarchy level and the chemotactic response of lymphocytes is a vector sum of concurrent chemokine signals. Therefore this mode of response for CCL19, CCL21, CXCL13 and S1P has been chosen in the model: The speed of lymphocytes is set to a constant value derived from two-photon imaging experiments [75, 82, 85, 86]. The direction of the chemotactic response is the weighted average direction of the chemokine gradients. The weight is provided by the gradient of the bound chemokine at both ends of the cell assuming that the cell senses the difference of bound molecules across its diameter.
3 Results
Simulations are performed on the basis of the model as introduced in the previous section. The minimal set of assumptions entering the model are
-
•
fixed number of non-migrating stromal cells,
-
•
constant entrance of B cells via small number of HEV,
-
•
B cells use the LE for egress from the SLT,
-
•
generation of FDC by B cell LT signaling,
-
•
replacement of FRC by generated FDC,
-
•
removal of FDC (replaced by FRC) in case of lack of LT stimulation,
-
•
secretion of CXCL13 by FDC,
-
•
secretion of CCL21 by FRC,
-
•
secretion of S1P by LE,
-
•
chemotactic activity of B cells to CXCL13, CCL21, and S1P,
-
•
B cells leaving the SLT via LE when S1P1 levels are sufficient to dominate CXCL13 response.
These assumptions alone lead to reasonable cell dynamics. Restricting the LE to a small area generates a PLF that is stable in size, shape, and position (see [23]) using physiological values for the parameters (Table 1). However, the position of the follicle is in contradiction to microanatomical data [21, 28, 29, 30, 31, 32, 33, 34, 35, 36, 37]. Introducing the correct relative position of PLF and LE with dynamic LE, dramatically changes the follicle stability. Thus, the stability of follicle shape and size in an equilibrium of cell flow crucially depends on further mechanisms.
In the following possible mechanisms are discussed that guarantee the stability of the follicle. The most intuitive hypothesis, is related to internalization dynamics of chemotaxis receptors. It is shown that this hypothesis leads to unphysiological results and is therefore unlikely to be the relevant factor of physiological follicle formation and maintenance. Realistic results could only be achieved by the assumption of a so far unknown mechanism of negative regulation of FDC generation. This mechanism is a prediction of the model.
3.1 Including internalization dynamics
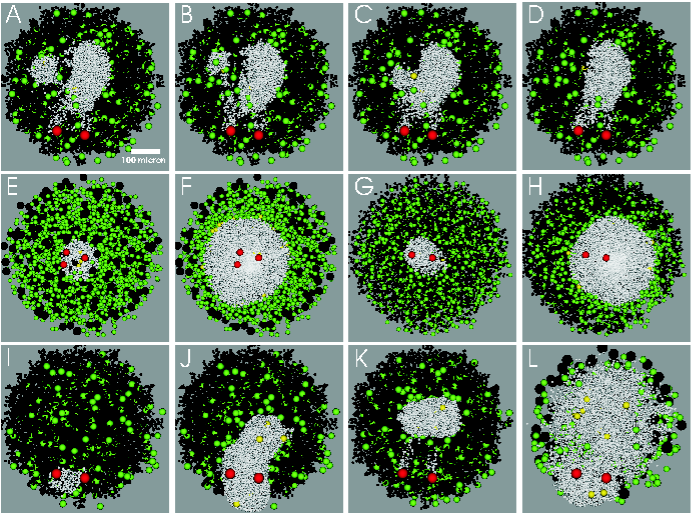
The internalization of CXCR5 (modeled by Eq. 5 and [23]) destabilizes the shape of the follicle defined by the B cells (Fig. 1, A–D). In a first step, the dynamics of the FDC network was switched off in order to isolate the effect of B cell internalization dynamics.
The instability is caused by uptake of CXCL13 when the CXCR5-CXCL13 complex is internalized: The chemotactically responding B cells act as a sink for CXCL13. This generates steep gradients in the chemokine distribution which guide the B cell movement. Interestingly, these local gradients, induced by the responding lymphocyte population itself, can become so strong that they reverse the chemotaxis gradient. Then cell movement is not strictly directed towards the chemokine source anymore.
In principle, a large diffusion constant could counter-balance this tendency. However, the reversal of chemokine gradients is most pronounced at larger distances of the chemokine source. An unphysiologically large diffusion constant would be required to counter-act the local dynamics in the chemokine concentration.
Internalization can induce quasi-periodical alterations of the chemokine concentrations. Assume a population of B cells with full CXCR5 expression and high concentration of CXCL13. The receptor will be internalized on all cells using up the CXCL13 to some extent. The lowered CXCL13 concentration and CXCR5 levels promote B cells to enter a random walk migration modus and spread. The low uptake of CXCL13 by the B cells with internalized CXCR5 permits the CXCL13 concentration to rise again. The combination of CXCL13 uptake and switch of cell migration between chemotaxis and random migration leads to a local synchronization of the receptor dynamics of these cells. The spreading of the B cells destabilizes the shape of the PLF and becomes significant when local populations of B cells synchronously spread out.
The instability of the B cell aggregate leads to high B cell densities outside the FDC network. If the FDC network dynamics is switched on again this culminates in the generation of new FDC at the border of the PLF. The area covered by the B cells becomes more extended than expected from a densely packed set of B cells in the FDC network (see also [23]). In other words, the volume of the FDC network becomes bigger than the volume required by the number of B cells. Thus, the whole PLF becomes unstable in shape and follows the shifted ’center of mass’ of the FDC network as a result of the CXCL13 concentration peaks.
The positive feedback loop (CXCL13 stimulating higher LT levels in B cells, inducing more CXCL13 secreting FDC [14]) enhances this effect because B cells at low density can already induce FDC when their LT levels are high due to the CXCL13 stimulus. This is most pronounced when the peak LT levels of B cells are delayed compared to the peak CXCL13 stimulus because then the cells have a high probability to enter a FDC free area with enhanced surface LT levels.
Note that in a previous study no instability was induced by internalization dynamics [23]. This is related to S1P chemotaxis towards the LE and to a wrong position of the LE in this study: The follicle formed around the LE position.
In conclusion, internalization dynamics of CXCR5 induce unstable PLF. As such instabilities are not observed in nature, the present model predicts that receptor internalization is not a dominant process in PLF formation and maintenance. Even though it can not be excluded that internalization is active and only attenuated by further interactions, it is unlikely that we loose essential features of PLF formation when neglecting internalization dynamics in the following. However, the robustness of the results with respect to internalization dynamics will be considered.
3.2 Including lymphatic endothelium dynamics
LE dynamics might be considered to stabilize follicle shape and size by locating the exit points for B cells. However, LE dynamics turn out to destabilizes the follicle system independently of the internalization dynamics (Fig. 1, E–H and Fig. 2). The reason for this instability is as follows: B cells that approach the LE – either by random motion or S1P-directed migration (Sec. 3.4) – can stimulate FRC to become FDC if they occur at sufficient density such that FDC are generated right next to the exit spots. As FDC and LE are anti-correlated, i.e. the vicinity of LE is free of FDC, the generation of FDC leads to the degradation of the LE. The exit spots for B cells are pushed further away. The B cells need to approach the LE and ’follow’ the distant exit spots. Due to the increased distance of the exit spots from the follicle center the B cells take longer to reach the spots thus increasing their transit time. Consequently the follicle is enlarged and the density of B cells close to the exit spots again reaches concentrations to induce new FDC. Thus a self-perpetuating process drives the border between FDC and LE leading to a constantly growing PLF size.
Even though the model for the genesis of lymph endothelium is rather simplistic, it nevertheless covers a reasonable idea of the dynamics of LE. The destabilizing effect of this basic model points towards an additional process that prevents the PLF from constant growth by inhibition of the generation of FDC at the right follicle size.
3.3 Negative regulation of FDC generation
A negative regulation mechanism that inhibits the generation of FDC can be realized in two distinct ways. First, the FDC induction is prevented when some factor is missing, i.e. FDC precursor activation gets lost. That implies that cells located in the T zone but not in the follicle secrete a substance that keeps the FDC progenitors in a state in which they are able to become FDC. The production and sensitivity for the signal has to be such that only many cells are able to give rise to a sufficient signal concentration. The fact that the T zone can be absent while separated PLF are observable in certain knockout experiments [9] makes this scenario rather unlikely.
The second option is that the generation of FDC leads to the secretion of a substance X that inhibits their own generation counter-balancing the effect of LT. Note that the negative regulation shall not affect existing FDC and not induce their dedifferentiation to FRC. Also the signal X has to be diffusible. A local inhibition mechanism might prevent the generation of FDC but does it independently of the follicle size. A signal sensitive to the follicle size needs to be accumulating and dispersing the information in the vicinity of the PLF.
The simulations show that negative regulations of FDC induction, indeed, leads to stable follicles. Both aforementioned scenarios have similar effects (Fig. 1, I and J). The PLF forms close to the HEV as expected from previous work where a small area containing LE had been positioned in a relatively large distance to the HEV [23]. In this configuration the PLF were forming around the LE and the HEV. In the present simulation the formation around the LE is no longer possible, because the homogeneous distribution of LE does not provide an aggregation center for the B cells to reach sufficient high density for induction of FDC via a large LT-stimulus. The lack of a B cell aggregation center in the present work is rather independent on S1P acting chemotactically on B cells or not. The broad distribution of S1P-producing LE can only provide shallow gradients not leading to B cell aggregation. The chemotactic activity of B cells in response to CCL21 can however lead to elongated follicles when the a CCL21 concentration peak is nearby the PLF center (Fig. 1, J).
The presence of one of these negative regulation mechanism has impact on the morphology of the PLF now exhibiting two zones. One B cell rich zone with FDC and without vessels, and a shell of B cells with low or vanishing FDC density but with LE. Within this shell B cells are exiting from the PLF and SLT.
An additional stability test can be performed using a preformed FDC network that is placed in a certain distance from the HEV. The simulation of this configurations shows that the preformed FDC network rapidly extents to its final size and most importantly remains at its location (Fig. 1, K). Thus, in contrast to simulations in [23], the B cells passing through the LE and the FRC network are not able to induce FDC before approaching in the PLF.
3.4 Why S1P chemotaxis is not likely to occur in primary lymphoid follicles
An important result of this study is that the chemotaxis towards S1P is no longer required and even more that S1P chemotaxis might not be active in the PLF system. In contrast to the previous study [23] the S1P chemotaxis is not required for B cells to find an exit spot because the LE is distributed homogeneously around the follicle. This makes it easy for B cells to find the LE by random migration within a rather short time. Thus, the role of a chemical signal has been replaced by a specific functional morphology.
The effect of S1P in the PLF system is mainly a disturbed border of the lymphoid follicle (Fig. 1, L). This results from a rather low concentration of CXCL13 at the boundary of the follicle which allows S1P to influence the direction of motion of B cells at the follicle border. This is only slightly affected by the internalization dynamics of CXCR5 because the cells at the border are mainly sensitive for CXCL13 due to low CXCL13 concentration. The morphology caused by S1P suggests that B cells in the follicle are not chemotactically responding to S1P.
4 Discussion
An agent-based lattice-free simulation tool for the formation and maintenance of PLF was presented. The generation of FDC is induced by B cells providing sufficient LT signals to stromal progenitor cells. B cells are sensitive to chemokine CXCL13 via their receptor CXCR5. CXCL13 is secreted by FDC. The positive feedback loop that enhance B cell LT levels by CXCL13 stimulation [14] is not required to understand PLF formation. Optionally, the desensitization of the CXCR5 receptor via ligand-induced receptor internalization is considered. A simple model for the microanatomy of the lymphatic vessels in the vicinity of lymphoid follicles is used assuming an anti-correlation between LE and FDC.
In contrast to previous simulations [23], which did not consider CXCR5 internalization dynamics or LE anti-correlation with FDC, PLF are found to be unstable when at least one of these additional features is included. In the following this is explored in more detail, and a mechanism is proposed to elevate the problem of follicle instability. This model prediction is discussed in the context of related experiments.
Internalization of chemokine receptors does not drive PLF formation
The instability generated by the internalization dynamics
of CXCR5 on B cells in the simulation suggests that this process might not
be relevant in the PLF system.
The internalization of CXCR5 has been introduced in the simulation
to desensitize chemotactic attraction of B cells to the center of
the FDC network and, thus, to make them approach
the follicular border either by random migration or chemotactic
migration in response to other chemokines like CCL21, CCL19,
and/or S1P, and, ultimately, to allow B cells to leave the follicle.
A couple of points
argue against this process being relevant to B cells leaving
the follicle.
In order to compensate for shape fluctuations induced by the CXCR5 internalization dynamics and achieve a spherical PLF the production of CXCL13 could in principle be raised. The resulting CXCL13 concentration has to be high enough to ensure that CXCL13 removal by CXCR5 internalization is not strong enough to invert the CXCL13 gradient. However, the high CXCL13 concentration would result in high CXCL13 concentration everywhere in the PLF leading to rapidly CXCR5 desensitized B cells even at the border of the PLF. Consequently CXCL13 would not be able to hold B cells for a long time and B cells would leave the follicle after 15–30 minutes [67]. This short PLF transit time is in contradiction to the experiments observing transit of at least 3–5 hours [33, 43, 44, 45].
Another argument against the internalization dynamics is that it cannot be stable in regulating the size of follicle. Assume that by random fluctuation more B cells arrive at the follicle. Internalization reduces the CXCL13 levels such that cells are less desensitized and remain longer in the follicle. As a consequence the follicle is growing in B cell numbers. The generation of FDC (with and without the positive feedback loop [14]) is by far slower than cell migration such that the B cells number remains at a higher ratio compared to the CXCL13 sources and letting the follicle grow further. Similar arguments apply to the case when a fluctuation leads to lower B cell numbers. When less B cells are in the follicle, then CXCL13 is dominating and B cells leave the follicle fast by a more rapid and frequent CXCR5 internalization. The CXCL13 concentration in the shrinking follicle is rising further until the slower dynamics of the FDC reduces the CXCL13 amount. However, due to their faster dynamics the number of B cells decreases faster. Basically, the slow dynamics of the FDC compared to the migration and internalization dynamics of B cells is responsible for this instability.
Note, that it cannot be ruled out that a another modification of the CXCR5 receptor levels, for example on the transcriptional level, leads to a desensitization of B cells for CXCL13 thus enabling them to leave the PLF. Also it cannot be excluded that mechanisms exist that compensate for the internalization induced instability of the PLF. This may be a desired situation considering that the internalization dynamics can induce cycling of naive B cells between the center of the PLF and its border. The cycling is due to the strong desensitization in the center of the PLF where high CXCL13 concentrations exist. B cells can then approach the border by random migration where the lower CXCL13 concentrations permit a resensitization for CXCL13 chemotaxis. These B cells migrate back to the center of the PLF.
Follicular B cells are not responsive to CCL19, CCL21, and S1P
The morphological data suggest that B cells in the PLF are not
chemotactical responsive for S1P. A superposition of the two
chemoattractants S1P and CXCL13 generates a blurry PLF border
which is not observed experimentally. This is in line with the recent
observation that S1P is not a chemotactic factor in vivo for
T cells in the LN [27].
The same blurry PLF border would be induced if
follicular B cells responded to the T zone chemokines CCL19 and CCL21.
Therefore, the simulation suggests
that chemotaxis to CCL19, CCL21 and S1P
is suppressed in follicular B cells, which seems to be the case
in vivo [12, 77, 87, 88]
despite the positive response in vitro
[76, 74].
This may be caused by internalization of CCR7
at the border of the PLF where the concentrations of CCL19
and CCL21 are still quite high [82, 89] which
is supported by the missing CCR7 surface levels of freshly
isolated B cells [73].
A CXCL13-LT positive feedback loop initiates PLF formation and gradual FDC differentiation
The function of the positive feedback loop [14]
(LT levels are increased by CXCL13, and LT induce
novel FDC which are the source of CXCL13)
was analyzed in the simulations. There are two possible
functions: First, a randomly formed B cell aggregate may induce
a minimum level of CXCL13 that starts the feedback loop
leading to increased LT and finally to increased CXCL13.
The CXCL13 levels reached in this way are sufficiently strong
to induce chemotaxis in B cells and to dominate other chemotactic
responses (e.g. to CCL21). This initiates formation of follicles.
However, in vitro data show that very high CXCL13 levels
(10 nM) are required to efficiently
induce LT on B cells [89]. These concentrations
are already optimal for chemotaxis
[90, 91], which sets in question the
former functional interpretation of the feedback loop.
If one, nevertheless, assumes that
the positive feedback loop is required to induce
initial CXCL13 expression, then the initiation of the first FDC
requires either another helper cell type or high LT levels
on some B cells. The latter might be a result of stimulation with
antigen [14]. Then, either
the cellular helper source needs to be identified or the
dependence on B cell activation has to be confirmed.
An alternative interpretation is that the LT signal resulting solely from the aggregation of B cells may be sufficient to induce CXCL13-producing FDC but not other FDC markers like CD21 or CD35 which require the high LT levels achieved by the feedback loop [14]. The gradual maturation of FDC observed in other studies [51, 20] supports this notion.
Moreover the notion of gradual maturation favors the strict interpretation of FDC as excited state of stromal cells and speaks against the differentiation of an unknown progenitor. This may also explain why in certain experiments FDC are rapidly lost when the LT stimulus is blocked with antibodies [13, 62, 92, 93]. Thus the loss of the LT signal may not lead to the loss of FDC by apoptosis but a ’decay’ of exited stromal cell back to their native state.
Lymphatic vessels
The microanatomical location of the LE has been modeled by
an exclusion principle: Whenever a FDC is newly appearing the
lymphatic vessels in the vicinity are removed.
Presumably, remodeling is organized
by the exchange of chemicals inducing behavioral changes
of the LE cell. This is not considered explicitly but
summarized in a time delay of LE remodeling
of several hours.
Analogously the dedifferentiation of a FDC into a FRC
is followed by the creation of LE.
The regulation of the LE is not precisely understood. In the following several hypothetic pathways that may regulate the LE dynamics and their corresponding experimental evidence are discussed. The LE dynamics could be related to the ECM. The reticular fibers are sparse in the follicle [31, 94, 95, 96, 97, 98, 99, 100] and their degradation in the PLF could cause the disintegration of lymphatic vessels. A candidate signal to be involved is the expression of matrix metalloproteinases by FDC [101]. The generation of ECM components by FRC provides the ground for LE cells to extent the network in this area. The required vascular endothelial growth factors VEGF-C and/or VEGF-D can be provided from cells like macrophages (which can transdifferentiate into LE cells themselves) [102] or dendritic cells [103]. In this view, the gradual destruction of the reticular network in developing follicles in sheep [18] would be accompanied by a gradual loss of LE in this area, which, in turn, promotes PLF growth.
There exists indirect evidence how LE remodeling might be regulated in the PLF. Angiogenesis and lymphangiogenesis during airway infections is dependent on B cells [104]. A candidate for the mediator signal is vascular endothelial growth factor (VEGF)-D [104]. Although the cellular source is not clear VEGF-D could directly couple to B cells as suggested by the stimulation of VEGF by c-Myc+ B cells in lymphoma [105]. A VEGF source candidate in SLT are DC in the T zone [103]. The co-localization of DC in the T zone correlates with the presence of LE. Thus it may turn out that DC are important for the structure of SLT. The lack of LE in the PLF may then be coupled to the absence of DC and not to a LE-destructing process initiated by the FDC. This hypothesis is already covered by the present simulations outcome of the simulation because in the real tissue as soon as FDC form, the DC are replaced by B cells. Thus VEGF will no longer be present and consequently lymphatic vessels are not maintained. An experiment using a system with VEGF-/- DC may elucidate the role of DC in SLT lymphangiogenesis.
Assuming that DC are responsible for the location of LE, the ring of B cells found in certain LT and/or TNF--deficiencies [9, 10, 11] should be devoid of LE. However, the absence of LE in the B cell ring does not exclude the possibility that high B cells densities lead to the reduction of LE. Thus, the anti-correlation of FDC and LE assumed in the simulation can be re-interpreted to be indirect in the way that FDC support the aggregation of B cells leading to reduced LE in the PLF.
TNF- might be not only involved in the generation of FDC [9, 10, 11] but directly in the LE remodeling process. Both B and T cells can provide TNF- [9, 11]. TNF- can upregulate VEGF-C ([106] and references in [103]). The anti-correlation between FDC and vessels may be related to the TNF- levels in the PLF that are raised by TNF--producing FDC [107]. It is known that TNF- can also have anti-angiogenic effects at high concentrations [108]. TNF- in the PLF may be present at sufficiently high levels to induce anti-angiogenic effects .
The presented model assumes that the lymphatic network formation in SLT is coupled to the dynamics of PLF. In contrast one could assume that the LE is formed before PLF formation and determines the position and shape of the developing PLF. A direct test for the existence of the LE dynamics is to provide anti-angiogenic factors to LT or similar knockouts prior to reconstitution by wildtype lymphocytes or bone marrow. The PLF that form should be much smaller than usual and contain LE. Alternatively, the inverse experiment could be done by blocking LT in wildtype mice or reconstitute them with bone marrow from LT. The disruption of the PLF should be followed by the presence of vessels in these areas. When using anti-angiogenic factors during the experiment, the gaps in the vessel network due to the PLF should be preserved when the PLF disappear.
A novel mechanism of negative regulation of FDC generation
The instabilities created by the LE dynamics require a
mechanism that negatively regulates the induction of FDC.
Even though negative regulation might be realized
in a number of different mechanisms,
from the simulation viewpoint, only the source and the
propagation of the signal initiating negative regulation are relevant.
Either a signal has to be reduced or to be
produced when FDC are generated. In both cases the
signal overcomes a threshold at the border of the PLF.
The signal is required to be diffusive
in order to act on the length scale of a PLF
and can be shown to require a rather fast
decay in order to establish a time-independent (stable)
follicle size (Appendix A).
Within the framework of the simulation an inhibiting signal is suggested that is produced when FDC are generated. Note that this inhibiting signal may be secreted either by B cells located in the PLF or by FDC. If the B cells are the sources of the hypothetic signal, they would constitutively produce the substance such that small B cell aggregates induce FDC while larger ones inhibit FDC induction. Alternatively, B cells sense the presence of FDC in the PLF (e.g via CXCL13) and produce the inhibitor upon stimulation in concurrence to LT.
The constitutive production of the inhibiting signal by B cells implies that the PLF would always grow from low B cell numbers to its final size and large aggregates that formed due to some other process would prohibit follicle formation. Considering the PLF formation in mice lacking T cells [9] this seems an unlikely situation because the B cell dense tissue clearly shows PLF formation. Also in normal MALT and LN organogenesis an intermediate ring of B cells around the developing T zone appears [6, 7, 8, 9, 10, 109, 110, 111, 112]. The ring formation suggests that high B cell numbers do not suppress FDC generation. Thus most likely either only the B cells in the follicle get stimulated to produce a negatively regulating factor or the FDC themselves are the source.
Primary lymphoid follicles exhibit two zones
The regulation of the follicle size under the
influence of the dynamics of efferent lymphatic vessels
implies that the B cell follicle consists of two
zones. One zone contains B cells and the FDC network
the other one B cells and efferent lymphatic vessels. From the
corrosion casts this organization cannot be determined
[35, 36, 37] but studies with
FDC marker seem to support this view
[10, 14, 20, 112, 113, 114, 115, 92].
However, in the framework of the present simulation
the FDC network is defined by the CXCL13 distribution.
Thus, the state of seemingly absent FDC in the outer zone of the PLF
is not resolved in the model. The results may also
indicate that the state of ’FDC-ness’
decreases radially towards the border of the follicle.
A theory of PLF formation and maintenance
The simulation of PLF formation and maintenance gives rise
to the following vantage point:
FDC are a differentiated state of stromal precursor cells.
Differentiation is promoted by LT, which is provided
by B cells.
The initiation of PLF formation is related to
small aggregates of B cells and does not rely on the
a positive feedback loop [14] between
CXCL13 and LT.
B cells in a follicle have to desensitize their chemotactic
responsiveness to T zone derived chemokines (CCL19, CCL21)
in order to establish a realistic flow of B cells through
the follicle and to avoid follicle instabilities. The model predicts
that a factor negatively regulating FDC generation determines
the size of a PLF. This factor stabilizes PLF shape and size.
It is most likely
an inhibitory diffusing signal secreted from either
FDC or B cells residing in the PLF.
A drawback of the presented model is that other desensitization mechanisms for the chemotactic response of B cells are not considered due to a lack of corresponding data. Other regulatory pathways like the transcription of the CXCR5 receptor may modify the PLF formation theory drawn in this study. The lymphangiogenesis model used here is very simple and only phenomenological. A detailed modeling of the lymphangiogenesis during PLF formation is left for future research, especially the use of a real vessel structure instead of spherical representatives. The dynamics of the adjacent T zone may influence PLF formation, although preliminary results seem not to change the conclusion drawn from the presented results. In addition to a more detailed lymphangiogenesis the dynamics of the HEV during PLF formation might be considered.
5 Method
The PLF system is simulated using an agent-based off-lattice model [116, 117, 118, 119, 120, 121, 25]. To achieve a lattice-free description a regular triangulation has been chosen [24, 25, 26, 23]. The regular triangulation, which is a generalization of the Delaunay triangulation, is used to provide the neighborhood topology for the cells that allows for a continuous representation of cell positions and sizes. The simulations of cells is represented in a 3-level model. The first level is the internal state of the cells representing the dynamics of the phenotype of the cell. The second level models the contact interaction between cells including mechanical interactions with the environment and exchange of signals by membrane bound molecules like LT. The third level incorporates long range interactions via diffusive substances which is used to describe the chemokine distribution in the PLF. The corresponding equations are briefly summarized in this section. More details of the model can be found in [23].
5.1 Internal cell dynamics
The phenotype of a cell is described by a set of internal cell variables. These include internal times to indicate when which type of event may happen. An example is the persistence time of cells during chemotactic motion [75, 82, 85, 86, 122, 123]. When the persistence time has past, the cell can reorient its migration direction to the local chemokine field [124, 125]. Another variable is the differentiation of a FRC to a FDC where two times are important: The time the LT stimulus is provided and the time the differentiation is completed (see below).
A set of variables describes the mechanics of the cell, e.g. velocity, cell polarization, and cell volume. These variable couple directly to the next level of description, the contact interaction of cells, and have no influence on other internal states directly but can influence the variables of neighbor cells. Additionally there are parameters like the elasticity constant mentioned below that can be cell-type specific. Further details of the model and an extensive set of parameters have been published [23] and can be found in the supplementary material.
Upon contact, two cells can exchange signals via their contact surface. In a simple approach with unpolarized ligand/receptor distributions the signal strength is proportional to the contact area provided by the Voronoi tessellation [126, 25, 23].
5.1.1 Internal dynamics of FRC and FDC
Cell differentiation is described as phenotype change of a cell. The realization of cell differentiation is derived from the change of cell behavior and internal states upon internal or external stimuli. Within the model a FRC differentiates to a FDC when the signal threshold for LT has been exceeded for a given time . The signal is determined by summing up all LT contributions from neighbor cells, i.e. surface density of LT times contact area. The differentiation is then instantly performed changing the internal cell states of a FRC into that of a FDC. In a similar manner FDC differentiate back to FDC after the LT signal is below the threshold for a given time . To reduce the amount of parameters and considering the lack of experimental data is assumed. Also the thresholds for LT are identical constants for FRC to FDC and FDC to FRC differentiation.
The positive feedback loop [14] involving B cells is realized by a linear interpolation of surface LT level between a constitutive low level and CXCL13-induced high LT level. The induction by CXCL13 is chosen to be proportional to the fraction of bound CXCR5 receptor implying an immediate response. As an additional variant the LT level can been chosen proportional to the amount of internalized CXCR5 to model a delayed response. Additional delays which may result by the transcription of LT have not been considered. This seems to be realistic considering that B cells reside in the PLF for a few hours [33, 43, 44, 45] which permits high LT levels only when the cells are about to leave the follicle, if at all.
5.2 Equations of motion
The contact interaction of cells is primarily the mechanical interaction between cells. It is described by Newtonian equations of motion in the overdamped approximation. In this approximation acceleration of cells and consequently conservation of moment can be ignored. The equations incorporate elastic cell responses upon cell contact, forces generated by actively migrating cells, and friction forces between cells as well as cells and extracellular matrix.
The Newtonian equations of motion read
| (1) |
The forces at position of the cell depend on the internal state of the cells for active forces and on the cell’s position as well as on the position of all neighbor cells for passive forces . These forces are counter-balanced by the velocity-dependent drag forces resulting in a ODE system of first order for the cell positions.
The passive forces are the elastic described by the JKR-model [127]. It depends on the virtual cell overlap where is the center distance of the cells and and are the cell radii.
| (2) |
with cell elasticity constants and , Poisson numbers and .
The force acting on cell by exerting active forces on a neighbor cell reads
| (3) |
with the cell orientation , cell surface contact point , constriction ring center , interaction area and the pressure exerted by cell i. Additionally a constant active force is directly exerted by the cell on the ECM by the cell driving the cell in the direction of the cell axis .
The drag force is linear in the velocity given by
| (4) |
with specific coefficients , , and . is the total surface of a cell and is the surface in contact with other cells.
5.3 Reaction-diffusion system of chemokines
The chemotaxis of cells is described by coupling the direction of the active force of a cell to the local chemokine gradient. According to the observation that leukocytes tend to have a persistence time between subsequent orientation changes [75, 82, 85, 86] the gradient is sensed by the simulated cells periodically. The concentration of the chemokines CXCL13, and CCL21 are computed solving the time dependent diffusion equation. CCL19 is not explicitly calculated as it has a similar distribution like CCL21 [12], acts on the same receptor [74], and has a far lower concentration that CCL21 [89]. Note, that in inhomogeneous media like complex tissue a reaction-diffusion approach can become invalid and refinements might be necessary [128].
The receptor dynamics of the free () and internalized receptor () are described by the following equations:
| (5) |
represents the constant number of receptors in any state of a cell. and are the rate constants for the ligand receptor binding. The variable describes the concentration of the ligand which decays with the constant and is produced by the source . and are the rate constants for internalization of the receptor-ligand complexes and the recycling of receptors, respectively.
In the model the LE is assumed to attract lymphocytes via the chemoattractant S1P. For simplicity and based on the notion that the dynamics of the LE is coupled to a slow process – the FDC dynamics – and by itself is a slow process it is calculated using the Poisson equation. Thus the time dependence of the S1P concentration is assumed to play no role and is omitted. Similarly the internalization dynamics of the S1P receptor is kept simple without explicit internalization dynamics as presented in (Eq. 5). The reexpression of S1P1 is made independent of the S1P levels and increases linearly until the levels permits the cell to enter LE after about 3 hr [33, 43, 44, 45, 42].
5.4 Initial conditions
For most of the simulations a stromal background consisting of CCL21 producing FRC with a centrally localized preformed FDC network has been used. The area containing the FRC contains a constant density of exit spots which resemble the LE where cells can leave the tissue. A fixed number of HEV is located acentrically outside the preformed FDC network. The HEV are represented as spheres where cells enter the tissue. The majority of the simulations is performed with an influx of B cells only.
| parameter | value | remarks/references | |
|---|---|---|---|
| B/T cell diameter | 9 | [29, 129, 130, 131] | |
| 1 kPa | [132, 133, 134, 135] | ||
| 0.4 | [136, 137] | ||
| 0–0.3 | [138, 139] | ||
| 50–200 nN | [140, 141, 142] | ||
| 0.4 | [143] | ||
| 120–180 s | [85, 75] | ||
| 1500 nN | [85, 86, 75, 82, 132, 133, 144] | ||
| LT threshold | 1 | arbitrary units | |
| low density LT | unknown | ||
| high density LT | unknown | ||
| 3 h | [29, 13, 6] | ||
| 10–100 | [145] | ||
| size of diffusion grid | 1200 | ||
| grid resolution | 35 | ||
| max. cell displacement | 0.9 | ||
| min. time resolution | 10 s | ||
| B : T cell ratio | 0.4 : 0.6 | [44, 146] | |
| influx of cells (B + T) | 0.1–2 | [44, 146] | |
| size of simulation area | 600 | ||
| number of FRC | 2500 | ||
| [67] | |||
| [67] | |||
| [77, 74, 147, 148, 149] | |||
| [148] | |||
| (from and | |||
| [150, 151] | |||
| – | [77, 87] |
Appendix A Estimating the life time of a signal for the negative regulation of FDC generation
Solving the stationary diffusion equation with a decay term and a homogeneous spherical source of size (spherical coordinates with radius )
| (6) |
yields the solution
| (7) |
with the typical length scale of the system. The negative regulation should set on around the coordinate where the source of the negative signal vanishes. The highest values at this border will be reached when . However, the PLF growth will stop as soon as this threshold is reached such that the typical radius of the PLF will be in the order of a few . For typical parameters of the diffusion coefficient of the value for should be in the range of , i.e. the typical lifetime of the molecule mediating the negative regulation is in the order of minutes to tens of minutes. The decay term may be just the uptake of the signal by the cells it is acting on or its enzymatic inactivation.
Acknowledgement
The ALTANA AG supports the Frankfurt Institute for Advanced Studies (FIAS).
References
- [1] I. C. MacLennan (1994). Germinal centers. Annu. Rev. Immunol., 12:117–39.
- [2] M. H. Kosco-Vilbois (2003). Are follicular dendritic cells really good for nothing? Nat. Rev. Immunol., 3(9):764–9.
- [3] L. Nicander, M. Halleraker, and T. Landsverk (1991). Ontogeny of reticular cells in the ileal Peyer’s patch of sheep and goats. Am. J. Anat., 191(3):237–49.
- [4] P. J. Griebel and W. R. Hein (1996). Expanding the role of Peyer’s patches in B-cell ontogeny. Immunol. Today, 17(1):30–9.
- [5] L. H. Makala, N. Suzuki, and H. Nagasawa (2002-2003). Peyer’s patches: organized lymphoid structures for the induction of mucosal immune responses in the intestine. Pathobiology, 70(2):55–68.
- [6] R. E. Mebius, P. Rennert, and I. L. Weissman (1997). Developing lymph nodes collect CD4+CD3- LT+ cells that can differentiate to APC, NK cells, and follicular cells but not T or B cells. Immunity, 7(4):493–504.
- [7] S. Nishikawa, K. Honda, P. Vieira, and H. Yoshida (2003). Organogenesis of peripheral lymphoid organs. Immunol. Rev., 195:72–80.
- [8] D. Finke (2005). Fate and function of lymphoid tissue inducer cells. Curr. Opin. Immunol., 17(2):144–50.
- [9] Y. X. Fu and D. D. Chaplin (1999). Development and maturation of secondary lymphoid tissues. Annu. Rev. Immunol., 17:399–433.
- [10] G. Muller, U. E. Hopken, and M. Lipp (2003). The impact of CCR7 and CXCR5 on lymphoid organ development and systemic immunity. Immunol. Rev., 195:117–35.
- [11] A. V. Tumanov, S. I. Grivennikov, A. N. Shakhov, S. A. Rybtsov, E. P. Koroleva, J. Takeda, S. A. Nedospasov, and D. V. Kuprash (2003). Dissecting the role of lymphotoxin in lymphoid organs by conditional targeting. Immunol Rev, 195:106–16.
- [12] J. G. Cyster (2005). Chemokines, sphingosine-1-phosphate, and cell migration in secondary lymphoid organs. Annu. Rev. Immunol., 23:127–59.
- [13] F. Mackay and J. L. Browning (1998). Turning off follicular dendritic cells. Nature, 395(6697):26–7.
- [14] K. M. Ansel, V. N. Ngo, P. L. Hyman, S. A. Luther, R. Forster, J. D. Sedgwick, J. L. Browning, M. Lipp, and J. G. Cyster (2000). A chemokine-driven positive feedback loop organizes lymphoid follicles. Nature, 406(6793):309–14.
- [15] P. Garside, E. Ingulli, R. R. Merica, J. G. Johnson, R. J. Noelle, and M. K. Jenkins (1998). Visualization of specific B and T lymphocyte interactions in the lymph node. Science, 281(5373):96–9.
- [16] D. K. Bhalla, T. Murakami, and R. L. Owen (1981). Microcirculation of intestinal lymphoid follicles in rat Peyer’s patches. Gastroenterology, 81(3):481–91.
- [17] O. Ohtani, Y. Ohtani, C. J. Carati, and B. J. Gannon (2003). Fluid and cellular pathways of rat lymph nodes in relation to lymphatic labyrinths and Aquaporin-1 expression. Arch. Histol. Cytol., 66(3):261–72.
- [18] M. Halleraker, C. M. Press, and T. Landsverk (1994). Development and cell phenotypes in primary follicles of foetal sheep lymph nodes. Cell. Tissue Res., 275(1):51–62.
- [19] E. F. Brachtel, M. Washiyama, G. D. Johnson, K. Tenner-Racz, P. Racz, and I. C. MacLennan (1996). Differences in the germinal centres of palatine tonsils and lymph nodes. Scand. J. Immunol., 43(3):239–47.
- [20] N. Kasajima-Akatsuka and K. Maeda (2006). Development, maturation and subsequent activation of follicular dendritic cells (FDC): immunohistochemical observation of human fetal and adult lymph nodes. Histochem. Cell. Biol., pages 1–13.
- [21] G. T. Belz (1998). Intercellular and lymphatic pathways associated with tonsils of the soft palate in young pigs. Anat. Embryol. (Berl), 197(4):331–40.
- [22] P. Kumar and J. F. Timoney (2006). Histology, immunohistochemistry and ultrastructure of the tonsil of the soft palate of the horse. Anat. Histol. Embryol., 35(1):1–6.
- [23] T. Beyer and M. Meyer-Hermann (2006). Modeling emergent tissue organization involving high-speed migrating cells in a flow equilibrium. submitted to Phys. Rev. E.
- [24] G. Schaller and M. Meyer-Hermann (2004). Kinetic and dynamic Delaunay tetrahedralizations in three dimensions. Comput. Phys. Commun., 162:9–23.
- [25] G. Schaller and M. Meyer-Hermann (2005). Multicellular tumor spheroid in an off-lattice voronoi-delaunay cell model. Phys. Rev. E., 71(5 Pt 1):051910.
- [26] T. Beyer, G. Schaller, A. Deutsch, and M. Meyer-Hermann (2005). Parallel dynamic and kinetic regular triangulation in three dimensions. Comput. Phys. Commun., 172(2):86–108.
- [27] S. H. Wei, H. Rosen, M. P. Matheu, M. G. Sanna, S. K. Wang, E. Jo, C. H. Wong, I. Parker, and M. D. Cahalan (2005). Sphingosine 1-phosphate type 1 receptor agonism inhibits transendothelial migration of medullary T cells to lymphatic sinuses. Nat. Immunol., 6(12):1228–35.
- [28] C. K. Drinker, G. B. Wislocki, and M. E. Field (1933). The structure of the sinuses in the lymph nodes. Anat. Rec., 56(3):261–273.
- [29] W. van Ewijk and T. H. van der Kwast (1980). Migration of B lymphocytes in lymphoid organs of lethally irradiated, thymocyte-reconstituted mice. Cell. Tissue Res., 212(3):497–508.
- [30] O. Ohtani, A. Ohtsuka, and R. L. Owen (1986). Three-dimensional organization of the lymphatics in the rabbit appendix. A scanning electron and light microscopic study. Gastroenterology, 91(4):947–55.
- [31] O. Ohtani, A. Kikuta, A. Ohtsuka, and T. Murakami (1991). Organization of the reticular network of rabbit Peyer’s patches. Anat. Rec., 229(2):251–8.
- [32] C. Belisle and G. Sainte-Marie (1990). Blood vascular network of the rat lymph node: tridimensional studies by light and scanning electron microscopy. Am. J. Anat., 189(2):111–26.
- [33] T. C. Pellas and L. Weiss (1990). Deep splenic lymphatic vessels in the mouse: a route of splenic exit for recirculating lymphocytes. Am. J. Anat., 187(4):347–54.
- [34] G. T. Belz and T. J. Heath (1995). Intercellular and lymphatic pathways of the canine palatine tonsils. J. Anat., 187 (Pt1):93–105.
- [35] G. Azzali and M. L. Arcari (2000). Ultrastructural and three dimensional aspects of the lymphatic vessels of the absorbing peripheral lymphatic apparatus in Peyer’s patches of the rabbit. Anat. Rec., 258(1):71–9.
- [36] G. Azzali, M. Vitale, and M. L. Arcari (2002). Ultrastructure of absorbing peripheral lymphatic vessel (ALPA) in guinea pig Peyer’s patches. Microvasc. Res., 64(2):289–301.
- [37] G. Azzali (2003). Structure, lymphatic vascularization and lymphocyte migration in mucosa-associated lymphoid tissue. Immunol. Rev., 195:178–89.
- [38] S. Ekino, K. Matsuno, and M. Kotani (1979). Distribution and role of lymph vessels of the bursa Fabricii. Lymphology, 12(4):247–52.
- [39] H. Irjala, E. L. Johansson, R. Grenman, K. Alanen, M. Salmi, and S. Jalkanen (2001). Mannose receptor is a novel ligand for L-selectin and mediates lymphocyte binding to lymphatic endothelium. J. Exp. Med., 194(8):1033–42.
- [40] M. Matloubian, C. G. Lo, G. Cinamon, M. J. Lesneski, Y. Xu, V. Brinkmann, M. L. Allende, R. L. Proia, and J. G. Cyster (2004). Lymphocyte egress from thymus and peripheral lymphoid organs is dependent on S1P receptor 1. Nature, 427(6972):355–60.
- [41] F. Sallusto and C. R. Mackay (2004). Chemoattractants and their receptors in homeostasis and inflammation. Curr. Opin. Immunol., 16(6):724–31.
- [42] C. G. Lo, Y. Xu, R. L. Proia, and J. G. Cyster (2005). Cyclical modulation of sphingosine-1-phosphate receptor 1 surface expression during lymphocyte recirculation and relationship to lymphoid organ transit. J. Exp. Med., 201(2):291–301.
- [43] T. C. Pellas and L. Weiss (1990). Migration pathways of recirculating murine B cells and CD4+ and CD8+ T lymphocytes. Am. J. Anat., 187(4):355–73.
- [44] A. J. Young (1999). The physiology of lymphocyte migration through the single lymph node in vivo. Semin. Immunol., 11(2):73–83.
- [45] W. Srikusalanukul, F. De Bruyne, and P. McCullagh (2002). An application of linear output error modelling for studying lymphocyte migration in peripheral lymphoid tissues. Australas. Phys. Eng. Sci. Med., 25(3):132–8.
- [46] E. Crivellato and F. Mallardi (1997). Stromal cell organisation in the mouse lymph node. A light and electron microscopic investigation using the zinc iodide-osmium technique. J. Anat., 190 ( Pt 1):85–92.
- [47] E. P. Kaldjian, J. E. Gretz, A. O. Anderson, Y. Shi, and S. Shaw (2001). Spatial and molecular organization of lymph node T cell cortex: a labyrinthine cavity bounded by an epithelium-like monolayer of fibroblastic reticular cells anchored to basement membrane-like extracellular matrix. Int. Immunol., 13(10):1243–53.
- [48] M. A. Nolte, J. A. Belien, I. Schadee-Eestermans, W. Jansen, W. W. Unger, N. van Rooijen, G. Kraal, and R. E. Mebius (2003). A conduit system distributes chemokines and small blood-borne molecules through the splenic white pulp. J. Exp. Med., 198(3):505–12.
- [49] P. Balogh, G. Horvath, and A. K. Szakal (2004). Immunoarchitecture of distinct reticular fibroblastic domains in the white pulp of mouse spleen. J. Histochem. Cytochem., 52(10):1287–98.
- [50] K. van Nierop and C. de Groot (2002). Human follicular dendritic cells: function, origin and development. Semin. Immunol., 14(4):251–7.
- [51] M. Bofill, A. N. Akbar, and P. L. Amlot (2000). Follicular dendritic cells share a membrane-bound protein with fibroblasts. J. Pathol., 191(2):217–26.
- [52] A. K. Szakal, R. L. Gieringer, M. H. Kosco, and J. G. Tew (1985). Isolated follicular dendritic cells: cytochemical antigen localization, Nomarski, SEM, and TEM morphology. J. Immunol., 134(3):1349–59.
- [53] E. A. Clark, K. H. Grabstein, and G. L. Shu (1992). Cultured human follicular dendritic cells. Growth characteristics and interactions with B lymphocytes. J. Immunol., 148(11):3327–35.
- [54] K. C. Chang, X. Huang, L. J. Medeiros, and D. Jones (2003). Germinal centre-like versus undifferentiated stromal immunophenotypes in follicular lymphoma. J. Pathol., 201(3):404–12.
- [55] R. Tsunoda, A. Bosseloir, K. Onozaki, E. Heinen, K. Miyake, H. Okamura, K. Suzuki, T. Fujita, L. J. Simar, and N. Sugai (1997). Human follicular dendritic cells in vitro and follicular dendritic-cell-like cells. Cell Tissue Res., 288(2):381–9.
- [56] J. G. Cyster, K. M. Ansel, K. Reif, E. H. Ekland, P. L. Hyman, H. L. Tang, S. A. Luther, and V. N. Ngo (2000). Follicular stromal cells and lymphocyte homing to follicles. Immunol. Rev., 176:181–93.
- [57] Z. F. Kapasi, D. Qin, W. G. Kerr, M. H. Kosco-Vilbois, L. D. Shultz, J. G. Tew, and A. K. Szakal (1998). Follicular dendritic cell (FDC) precursors in primary lymphoid tissues. J. Immunol., 160(3):1078–84.
- [58] D. V. Kuprash, A. V. Tumanov, D. J. Liepinsh, E. P. Koroleva, M. S. Drutskaya, A. A. Kruglov, A. N. Shakhov, E. Southon, W. J. Murphy, L. Tessarollo, S. I. Grivennikov, and S. A. Nedospasov (2005). Novel tumor necrosis factor-knockout mice that lack Peyer’s patches. Eur. J. Immunol., 35(5):1592–600.
- [59] M. Pasparakis, S. Kousteni, J. Peschon, and G. Kollias (2000). Tumor necrosis factor and the p55TNF receptor are required for optimal development of the marginal sinus and for migration of follicular dendritic cell precursors into splenic follicles. Cell. Immunol., 201(1):33–41.
- [60] S. Lee, K. Choi, H. Ahn, K. Song, J. Choe, and I. Lee (2005). Tuj1 (class III beta-tubulin) expression suggests dynamic redistribution of follicular dendritic cells in lymphoid tissue. Eur. J. Cell Biol., 84(2-3):453–9.
- [61] E. Crivellato, A. Vacca, and D. Ribatti (2004). Setting the stage: an anatomist’s view of the immune system. Trends Immunol., 25(4):210–7.
- [62] Y. Wang, J. Wang, Y. Sun, Q. Wu, and Y. X. Fu (2001). Complementary effects of TNF and lymphotoxin on the formation of germinal center and follicular dendritic cells. J. Immunol., 166(1):330–7.
- [63] M. A. Chaplain (2000). Mathematical modelling of angiogenesis. J. Neurooncol., 50(1-2):37–51.
- [64] M. Chaplain and A. Anderson (2004). Mathematical modelling of tumour-induced angiogenesis: network growth and structure. Cancer Treat. Res., 117:51–75.
- [65] R. M. Merks, S. V. Brodsky, M. S. Goligorksy, S. A. Newman, and J. A. Glazier (2006). Cell elongation is key to in silico replication of in vitro vasculogenesis and subsequent remodeling. Dev. Biol., 289(1):44–54.
- [66] P. Namy, J. Ohayon, and P. Tracqui (2004). Critical conditions for pattern formation and in vitro tubulogenesis driven by cellular traction fields. J. Theor. Biol., 227(1):103–20.
- [67] N. F. Neel, E. Schutyser, J. Sai, G. H. Fan, and A. Richmond (2005). Chemokine receptor internalization and intracellular trafficking. Cytokine Growth Factor Rev., 16(6):637–58.
- [68] E. D. Tomhave, R. M. Richardson, J. R. Didsbury, L. Menard, R. Snyderman, and H. Ali (1994). Cross-desensitization of receptors for peptide chemoattractants. Characterization of a new form of leukocyte regulation. J. Immunol., 153(7):3267–75.
- [69] H. Arai, F. S. Monteclaro, C. L. Tsou, C. Franci, and I. F. Charo (1997). Dissociation of chemotaxis from agonist-induced receptor internalization in a lymphocyte cell line transfected with CCR2B. Evidence that directed migration does not require rapid modulation of signaling at the receptor level. J. Biol. Chem., 272(40):25037–42.
- [70] G. Bardi, M. Lipp, M. Baggiolini, and P. Loetscher (2001). The T cell chemokine receptor CCR7 is internalized on stimulation with ELC, but not with SLC. Eur. J. Immunol., 31(11):3291–7.
- [71] B. Moser, M. Wolf, A. Walz, and P. Loetscher (2004). Chemokines: multiple levels of leukocyte migration control. Trends Immunol., 25(2):75–84.
- [72] M. P. Roy, C. H. Kim, and E. C. Butcher (2002). Cytokine control of memory B cell homing machinery. J. Immunol., 169(4):1676–82.
- [73] M. Casamayor-Palleja, P. Mondiere, C. Verschelde, C. Bella, and T. Defrance (2002). BCR ligation reprograms B cells for migration to the T zone and B-cell follicle sequentially. Blood, 99(6):1913–21.
- [74] R. Yoshida, M. Nagira, M. Kitaura, N. Imagawa, T. Imai, and O. Yoshie (1998). Secondary lymphoid-tissue chemokine is a functional ligand for the CC chemokine receptor CCR7. J. Biol. Chem., 273(12):7118–22.
- [75] S. H. Wei, I. Parker, M. J. Miller, and M. D. Cahalan (2003). A stochastic view of lymphocyte motility and trafficking within the lymph node. Immunol. Rev., 195:136–59.
- [76] C. H. Kim, L. M. Pelus, J. R. White, E. Applebaum, K. Johanson, and H. E. Broxmeyer (1998). CK-11/macrophage inflammatory protein-3/EBI1-ligand chemokine is an efficacious chemoattractant for T and B cells. J. Immunol., 160(5):2418–24.
- [77] K. Willimann, D. F. Legler, M. Loetscher, R. S. Roos, M. B. Delgado, I. Clark-Lewis, M. Baggiolini, and B. Moser (1998). The chemokine SLC is expressed in T cell areas of lymph nodes and mucosal lymphoid tissues and attracts activated T cells via CCR7. Eur. J. Immunol., 28(6):2025–34.
- [78] E. F. Foxman, E. J. Kunkel, and E. C. Butcher (1999). Integrating conflicting chemotactic signals. The role of memory in leukocyte navigation. J. Cell. Biol., 147(3):577–88.
- [79] B. Heit, S. Tavener, E. Raharjo, and P. Kubes (2002). An intracellular signaling hierarchy determines direction of migration in opposing chemotactic gradients. J. Cell. Biol., 159(1):91–102.
- [80] D. Breitfeld, L. Ohl, E. Kremmer, J. Ellwart, F. Sallusto, M. Lipp, and R. Forster (2000). Follicular B helper T cells express CXC chemokine receptor 5, localize to B cell follicles, and support immunoglobulin production. J. Exp. Med., 192(11):1545–52.
- [81] K. Reif, E. H. Ekland, L. Ohl, H. Nakano, M. Lipp, R. Forster, and J. G. Cyster (2002). Balanced responsiveness to chemoattractants from adjacent zones determines B-cell position. Nature, 416(6876):94–9.
- [82] T. Okada, M. J. Miller, I. Parker, M. F. Krummel, M. Neighbors, S. B. Hartley, A. O’Garra, M. D. Cahalan, and J. G. Cyster (2005). Antigen-engaged B cells undergo chemotaxis toward the T zone and form motile conjugates with helper T cells. PLoS. Biol., 3(6):e150.
- [83] K. M. Ansel, L. J. McHeyzer-Williams, V. N. Ngo, M. G. McHeyzer-Williams, and J. G. Cyster (1999). In vivo-activated CD4 T cells upregulate CXC chemokine receptor 5 and reprogram their response to lymphoid chemokines. J. Exp. Med., 190(8):1123–34.
- [84] S. Fillatreau and D. Gray (2003). T cell accumulation in B cell follicles is regulated by dendritic cells and is independent of B cell activation. J. Exp. Med., 197(2):195–206.
- [85] M. J. Miller, S. H. Wei, I. Parker, and M. D. Cahalan (2002). Two-photon imaging of lymphocyte motility and antigen response in intact lymph node. Science, 296(5574):1869–73.
- [86] M. J. Miller, S. H. Wei, M. D. Cahalan, and I. Parker (2003). Autonomous T cell trafficking examined in vivo with intravital two-photon microscopy. Proc. Natl. Acad. Sci. U.S.A., 100(5):2604–9.
- [87] T. Okada, V. N. Ngo, E. H. Ekland, R. Forster, M. Lipp, D. R. Littman, and J. G. Cyster (2002). Chemokine requirements for B cell entry to lymph nodes and Peyer’s patches. J. Exp. Med., 196(1):65–75.
- [88] J. Rangel-Moreno, J. Moyron-Quiroz, K. Kusser, L. Hartson, H. Nakano, and T. D. Randall (2005). Role of CXC chemokine ligand 13, CC chemokine ligand (CCL) 19, and CCL21 in the organization and function of nasal-associated lymphoid tissue. J. Immunol., 175(8):4904–13.
- [89] S. A. Luther, A. Bidgol, D. C. Hargreaves, A. Schmidt, Y. Xu, J. Paniyadi, M. Matloubian, and J. G. Cyster (2002). Differing activities of homeostatic chemokines CCL19, CCL21, and CXCL12 in lymphocyte and dendritic cell recruitment and lymphoid neogenesis. J. Immunol., 169(1):424–33.
- [90] D. F. Legler, M. Loetscher, R. S. Roos, I. Clark-Lewis, M. Baggiolini, and B. Moser (1998). B cell-attracting chemokine 1, a human CXC chemokine expressed in lymphoid tissues, selectively attracts B lymphocytes via BLR1/CXCR5. J. Exp. Med., 187(4):655–60.
- [91] M. D. Gunn, V. N. Ngo, K. M. Ansel, E. H. Ekland, J. G. Cyster, and L. T. Williams (1998). A B-cell-homing chemokine made in lymphoid follicles activates Burkitt’s lymphoma receptor-1. Nature, 391(6669):799–803.
- [92] J. L. Gommerman, F. Mackay, E. Donskoy, W. Meier, P. Martin, and J. L. Browning (2002). Manipulation of lymphoid microenvironments in nonhuman primates by an inhibitor of the lymphotoxin pathway. J. Clin. Invest., 110(9):1359–69.
- [93] C. Huber, C. Thielen, H. Seeger, P. Schwarz, F. Montrasio, M. R. Wilson, E. Heinen, Y. X. Fu, G. Miele, and A. Aguzzi (2005). Lymphotoxin-beta receptor-dependent genes in lymph node and follicular dendritic cell transcriptomes. J. Immunol., 174(9):5526–36.
- [94] A. Ohtsuka, A. J. Piazza, T. H. Ermak, and R. L. Owen (1992). Correlation of extracellular matrix components with the cytoarchitecture of mouse Peyer’s patches. Cell Tissue Res., 269(3):403–10.
- [95] E. Castanos-Velez, P. Biberfeld, and M. Patarroyo (1995). Extracellular matrix proteins and integrin receptors in reactive and non-reactive lymph nodes. Immunology, 86(2):270–8.
- [96] T. Ushiki, O. Ohtani, and K. Abe (1995). Scanning electron microscopic studies of reticular framework in the rat mesenteric lymph node. Anat. Rec., 241(1):113–22.
- [97] T. Katakai, T. Hara, M. Sugai, H. Gonda, and A. Shimizu (2004). Lymph node fibroblastic reticular cells construct the stromal reticulum via contact with lymphocytes. J. Exp. Med., 200(6):783–95.
- [98] T. Satoh, R. Takeda, H. Oikawa, and R. Satodate (1997). Immunohistochemical and structural characteristics of the reticular framework of the white pulp and marginal zone in the human spleen. Anat. Rec., 249(4):486–94.
- [99] K. A. Liakka and H. I. Autio-Harmainen (1992). Distribution of the extracellular matrix proteins tenascin, fibronectin, and vitronectin in fetal, infant, and adult human spleens. J. Histochem. Cytochem., 40(8):1203–10.
- [100] M. Maatta, S. Salo, K. Tasanen, Y. Soini, A. Liakka, L. Bruckner-Tuderman, and H. Autio-Harmainen (2004). Distribution of basement membrane anchoring molecules in normal and transformed endometrium: altered expression of laminin gamma2 chain and collagen type XVII in endometrial adenocarcinomas. J. Mol. Histol., 35(8-9):715–22.
- [101] A. Braun, S. Takemura, A. N. Vallejo, J. J. Goronzy, and C. M. Weyand (2004). Lymphotoxin beta-mediated stimulation of synoviocytes in rheumatoid arthritis. Arthritis Rheum., 50(7):2140–50.
- [102] D. Kerjaschki (2005). The crucial role of macrophages in lymphangiogenesis. J. Clin. Invest., 115(9):2316–9.
- [103] P. Hamrah, L. Chen, Q. Zhang, and M. R. Dana (2003). Novel expression of vascular endothelial growth factor receptor (VEGFR)-3 and VEGF-c on corneal dendritic cells. Am. J. Pathol., 163(1):57–68.
- [104] A. B. Aurora, P. Baluk, D. Zhang, S. S. Sidhu, G. M. Dolganov, C. Basbaum, D. M. McDonald, and N. Killeen (2005). Immune complex-dependent remodeling of the airway vasculature in response to a chronic bacterial infection. J. Immunol., 175(10):6319–26.
- [105] A. Ruddell, P. Mezquita, K. A. Brandvold, A. Farr, and B. M. Iritani (2003). B lymphocyte-specific c-Myc expression stimulates early and functional expansion of the vasculature and lymphatics during lymphomagenesis. Am. J. Pathol., 163(6):2233–45.
- [106] M. Frater-Schroder, W. Risau, R. Hallmann, P. Gautschi, and P. Bohlen (1987). Tumor necrosis factor type , a potent inhibitor of endothelial cell growth in vitro, is angiogenic in vivo. Proc. Natl. Acad. Sci. U.S.A., 84(15):5277–81.
- [107] A. Corcione, L. Ottonello, G. Tortolina, P. Tasso, F. Ghiotto, I. Airoldi, G. Taborelli, F. Malavasi, F. Dallegri, and V. Pistoia (1997). Recombinant tumor necrosis factor enhances the locomotion of memory and naive B lymphocytes from human tonsils through the selective engagement of the type II receptor. Blood, 90(11):4493–501.
- [108] C. Patterson, M. A. Perrella, W. O. Endege, M. Yoshizumi, M. E. Lee, and E. Haber (1996). Downregulation of vascular endothelial growth factor receptors by tumor necrosis factor-alpha in cultured human vascular endothelial cells. J. Clin. Invest., 98(2):490–6.
- [109] H. Yoshida, K. Honda, R. Shinkura, S. Adachi, S. Nishikawa, K. Maki, K. Ikuta, and S. I. Nishikawa (1999). IL-7 receptor + CD3(-) cells in the embryonic intestine induces the organizing center of Peyer’s patches. Int. Immunol., 11(5):643–55.
- [110] H. Hashi, H. Yoshida, K. Honda, S. Fraser, H. Kubo, M. Awane, A. Takabayashi, H. Nakano, Y. Yamaoka, and S. Nishikawa (2001). Compartmentalization of Peyer’s patch anlagen before lymphocyte entry. J. Immunol., 166(6):3702–9.
- [111] D. Kim, R. E. Mebius, J. D. MacMicking, S. Jung, T. Cupedo, Y. Castellanos, J. Rho, B. R. Wong, R. Josien, N. Kim, P. D. Rennert, and Y. Choi (2000). Regulation of peripheral lymph node genesis by the tumor necrosis factor family member TRANCE. J. Exp. Med., 192(10):1467–78.
- [112] T. Cupedo, M. F. Vondenhoff, E. J. Heeregrave, A. E. De Weerd, W. Jansen, D. G. Jackson, G. Kraal, and R. E. Mebius (2004). Presumptive lymph node organizers are differentially represented in developing mesenteric and peripheral nodes. J. Immunol., 173(5):2968–75.
- [113] P. Balogh, Y. Aydar, J. G. Tew, and A. K. Szakal (2001). Ontogeny of the follicular dendritic cell phenotype and function in the postnatal murine spleen. Cell. Immunol., 214(1):45–53.
- [114] Y. X. Fu, H. Molina, M. Matsumoto, G. Huang, J. Min, and D. D. Chaplin (1997). Lymphotoxin-alpha (LTalpha) supports development of splenic follicular structure that is required for IgG responses. J. Exp. Med., 185(12):2111–20.
- [115] Y. X. Fu, G. Huang, Y. Wang, and D. D. Chaplin (1998). B lymphocytes induce the formation of follicular dendritic cell clusters in a lymphotoxin -dependent fashion. J. Exp. Med., 187(7):1009–18.
- [116] G. M. Odell, G. Oster, P. Alberch, and B. Burnside (1981). The mechanical basis of morphogenesis. I. Epithelial folding and invagination. Dev. Biol., 85(2):446–62.
- [117] E. Palsson and H. G. Othmer (2000). A model for individual and collective cell movement in Dictyostelium discoideum. Proc. Natl. Acad. Sci. U.S.A., 97(19):10448–53.
- [118] J. C. Dallon and H. G. Othmer (2004). How cellular movement determines the collective force generated by the Dictyostelium discoideum slug. J. Theor. Biol., 231(2):203–22.
- [119] D. Drasdo, R. Kree, and J. S. McCaskill (1995). Monte carlo approach to tissue-cell populations. Phys. Rev. E, 52(6):6635–57.
- [120] D. Drasdo, S. D. S. Höhme, and A. Deutsch (2004). Cell-based models of avascular tumor growth., pages 367–378. Birkhäuser, Basel.
- [121] H. Honda, M. Tanemura, and T. Nagai (2004). A three-dimensional vertex dynamics cell model of space-filling polyhedra simulating cell behavior in a cell aggregate. J. Theor. Biol., 226(4):439–53.
- [122] M. Gunzer, C. Weishaupt, A. Hillmer, Y. Basoglu, P. Friedl, K. E. Dittmar, W. Kolanus, G. Varga, and S. Grabbe (2004). A spectrum of biophysical interaction modes between T cells and different antigen-presenting cells during priming in 3-D collagen and in vivo. Blood, 104(9):2801–9.
- [123] M. E. Meyer-Hermann and P. K. Maini (2005). Interpreting two-photon imaging data of lymphocyte motility. Phys. Rev. E, 71(6 Pt 1):061912.
- [124] E. Albrecht and H. R. Petty (1998). Cellular memory: neutrophil orientation reverses during temporally decreasing chemoattractant concentrations. Proc. Natl. Acad. Sci. U.S.A., 95(9):5039–44.
- [125] M. U. Ehrengruber, D. A. Deranleau, and T. D. Coates (1996). Shape oscillations of human neutrophil leukocytes: characterization and relationship to cell motility. J. Exp. Biol., 199(4):741–7.
- [126] F. A. Meineke, C. S. Potten, and M. Loeffler (2001). Cell migration and organization in the intestinal crypt using a lattice-free model. Cell Prolif., 34(4):253–66.
- [127] K. Johnson, K. Kendall, and A. Roberts (1971). Surface energy and the contact of elastic solids. Proc. R. Soc. London A, 324(1558):303–13.
- [128] S. Schnell and T. E. Turner (2004). Reaction kinetics in intracellular environments with macromolecular crowding: simulations and rate laws. Prog. Biophys. Mol. Biol., 85(2-3):235–60.
- [129] C. B. Thompson, I. Scher, M. E. Schaefer, T. Lindsten, F. D. Finkelman, and J. J. Mond (1984). Size-dependent B lymphocyte subpopulations: relationship of cell volume to surface phenotype, cell cycle, proliferative response, and requirements for antibody production to TNP-Ficoll and TNP-BA. J. Immunol., 133(5):2333–42.
- [130] M. Bornens, M. Paintrand, and C. Celati (1989). The cortical microfilament system of lymphoblasts displays a periodic oscillatory activity in the absence of microtubules: implications for cell polarity. J. Cell Biol., 109(3):1071–83.
- [131] W. S. Haston and J. M. Shields (1984). Contraction waves in lymphocyte locomotion. J. Cell Sci., 68:227–41.
- [132] A. R. Bausch, F. Ziemann, A. A. Boulbitch, K. Jacobson, and E. Sackmann (1998). Local measurements of viscoelastic parameters of adherent cell surfaces by magnetic bead microrheometry. Biophys. J., 75(4):2038–49.
- [133] A. R. Bausch, W. Moller, and E. Sackmann (1999). Measurement of local viscoelasticity and forces in living cells by magnetic tweezers. Biophys. J., 76(1 Pt 1):573–9.
- [134] G. Forgacs, R. A. Foty, Y. Shafrir, and M. S. Steinberg (1998). Viscoelastic properties of living embryonic tissues: a quantitative study. Biophys. J., 74(5):2227–34.
- [135] Y. S. Chu, S. Dufour, J. P. Thiery, E. Perez, and F. Pincet (2005). Johnson-Kendall-Roberts theory applied to living cells. Phys. Rev. Lett., 94(2):028102.
- [136] A. J. Maniotis, C. S. Chen, and D. E. Ingber (1997). Demonstration of mechanical connections between integrins, cytoskeletal filaments, and nucleoplasm that stabilize nuclear structure. Proc. Natl. Acad. Sci. U.S.A., 94(3):849–54.
- [137] A. Hategan, R. Law, S. Kahn, and D. E. Discher (2003). Adhesively-tensed cell membranes: lysis kinetics and atomic force microscopy probing. Biophys. J., 85(4):2746–59.
- [138] V. T. Moy, Y. Jiao, T. Hillmann, H. Lehmann, and T. Sano (1999). Adhesion energy of receptor-mediated interaction measured by elastic deformation. Biophys. J., 76(3):1632–8.
- [139] C. Verdier (2003). Rheological properties of living materials. From cells to tissues. J. Theo. Med., 5(2):67–91.
- [140] N. Q. Balaban, U. S. Schwarz, D. Riveline, P. Goichberg, G. Tzur, I. Sabanay, D. Mahalu, S. Safran, A. Bershadsky, L. Addadi, and B. Geiger (2001). Force and focal adhesion assembly: a close relationship studied using elastic micropatterned substrates. Nature Cell Biol., 3:466–472.
- [141] K. Burton, J. H. Park, and D. L. Taylor (1999). Keratocytes generate traction forces in two phases. Mol. Biol. Cell, 10(11):3745–69.
- [142] U. S. Schwarz, N. Q. Balaban, D. Riveline, A. Bershadsky, B. Geiger, and S. A. Safran (2002). Calculation of forces at focal adhesions from elastic substrate data: the effect of localized force and the need for regularization. Biophys. J., 83(3):1380–94.
- [143] C. G. Galbraith and M. P. Sheetz (1999). Keratocytes pull with similar forces on their dorsal and ventral surfaces. J. Cell. Biol., 147(6):1313–24.
- [144] D. A. Lauffenburger and A. F. Horwitz (1996). Cell migration: a physically integrated molecular process. Cell, 84(3):359–69.
- [145] G. J. Randolph, V. Angeli, and M. A. Swartz (2005). Dendritic-cell trafficking to lymph nodes through lymphatic vessels. Nat. Rev. Immunol., 5(8):617–28.
- [146] R. Sacca, C. A. Cuff, W. Lesslauer, and N. H. Ruddle (1998). Differential activities of secreted lymphotoxin-alpha3 and membrane lymphotoxin-alpha1beta2 in lymphotoxin-induced inflammation: critical role of TNF receptor 1 signaling. J. Immunol., 160(1):485–91.
- [147] F. Lin, C. M. Nguyen, S. J. Wang, W. Saadi, S. P. Gross, and N. L. Jeon (2004). Effective neutrophil chemotaxis is strongly influenced by mean IL-8 concentration. Biochem. Biophys. Res. Commun., 319(2):576–81.
- [148] A. J. Pelletier, L. J. van der Laan, P. Hildbrand, M. A. Siani, D. A. Thompson, P. E. Dawson, B. E. Torbett, and D. R. Salomon (2000). Presentation of chemokine SDF-1 alpha by fibronectin mediates directed migration of T cells. Blood, 96(8):2682–90.
- [149] H. Slimani, N. Charnaux, E. Mbemba, L. Saffar, R. Vassy, C. Vita, and L. Gattegno (2003). Binding of the CC-chemokine RANTES to syndecan-1 and syndecan-4 expressed on HeLa cells. Glycobiology, 13(9):623–34.
- [150] J. L. Vissers, F. C. Hartgers, E. Lindhout, C. G. Figdor, and G. J. Adema (2001). BLC (CXCL13) is expressed by different dendritic cell subsets in vitro and in vivo. Eur. J. Immunol., 31(5):1544–9.
-
[151]
W.-S. Hu.
Stoichiometry and kinetics of cell growth and product formation.
URL http://hugroup.cems.umn.edu/Cell_Technology/cd-rom/Stoichiometry%20and%20Kinetics/Stoichiometry%20and%20Cell%20Kinetics.pdf