Modeling emergent tissue organization involving high-speed migrating cells in a flow equilibrium
Abstract
There is increasing interest in the analysis of biological tissue,
its organization and its dynamics with the help of mathematical models.
In the ideal case emergent properties
on the tissue scale can be derived from the cellular scale. However,
this has been achieved in rare examples only, in particular,
when involving high-speed migration of cells. One major difficulty
is the lack of a suitable multiscale simulation platform, which embeds
reaction-diffusion of soluble substances, fast cell migration and mechanics,
and, being of great importance in several tissue types, cell flow homeostasis.
In this paper a step into this
direction is presented by developing an agent-based mathematical model specifically
designed to incorporate these features with special emphasis on
high speed cell migration.
Cells are represented as elastic spheres migrating on a substrate
in lattice-free space.
Their movement is regulated and guided by chemoattractants that
can be derived from the substrate.
The diffusion of chemoattractants is considered to be slower than
cell migration and, thus, to be far from equilibrium.
Tissue homeostasis is not achieved by the balance of growth and death
but by a flow equilibrium of cells migrating in and out of the tissue
under consideration. In this sense the number and the distribution of the cells
in the tissue is a result of the model and not part of the assumptions.
For purpose of demonstration of the model properties and functioning,
the model is applied to a prominent example of tissue in a cellular flow
equilibrium, the secondary lymphoid tissue. The experimental data on cell speed
distributions in these tissues can be reproduced using reasonable mechanical
parameters for the simulated cell migration in dense tissue.
keywords: agent-based model, multiscale model, chemotaxis, regular triangulation
1 Introduction
There exists a number of agent-based off-lattice models to simulate tissue [1, 2, 3, 4, 5, 6, 7, 8]. Many of them describe tissue organization and pattern formation [9] by the dynamics of growth and death of cells. Other models are suitable for describing migration of a constant number of cells. The traditional research field of pattern formation involving migrating cells [10, 3, 4] is mostly based on a balance of proliferation and cell death. Cells are migrating with relatively slow speed with respect to other processes like diffusion of soluble substances. Approximations based on slow cell migration are justified even for such highly dynamic systems as the epidermis [11, 8].
The model introduced here is designed for tissue in a flow equilibrium of high-speed migrating cells as found frequently in immunological tissue. Cells can enter and leave the tissue according to some dynamics imposed by the considered biological system. Feedback mechanisms between the cells and the substrate are incorporated because homeostasis in such systems is often established by feedback interaction [12, 13, 14]. This is modeled as transient excitation of a substrate or a small sessile cell population. The excitation is thought to couple back to the cell migration thus allowing for a regulatory system in a stable flow equilibrium.
The model is based on a regular triangulation [15, 16] that provides the cell neighborship topology which is changing rapidly due to fast cell migration. The dual Voronoi tessellation [17, 16] provides information about the shape of the cells including cell contact surfaces [11, 8, 18]. The physical properties are based on previously introduced short-ranged elastic interactions and actively generated intercellular forces [5, 8, 18, 3, 4]. Each cell is modeled individually and can incorporate a set of molecular properties or internal states that is appropriate for the system under consideration. Such properties may have impact on cell migration or cell-cell and cell-substrate interaction. The deterministic internal cell dynamics exhibit memory in the sense that, for example, internal variables representing the cell state like delay times are included. Cell migration under the influence of chemotaxis is also treated deterministic. However, cell orientation is stochastic for unguided random cell migration.
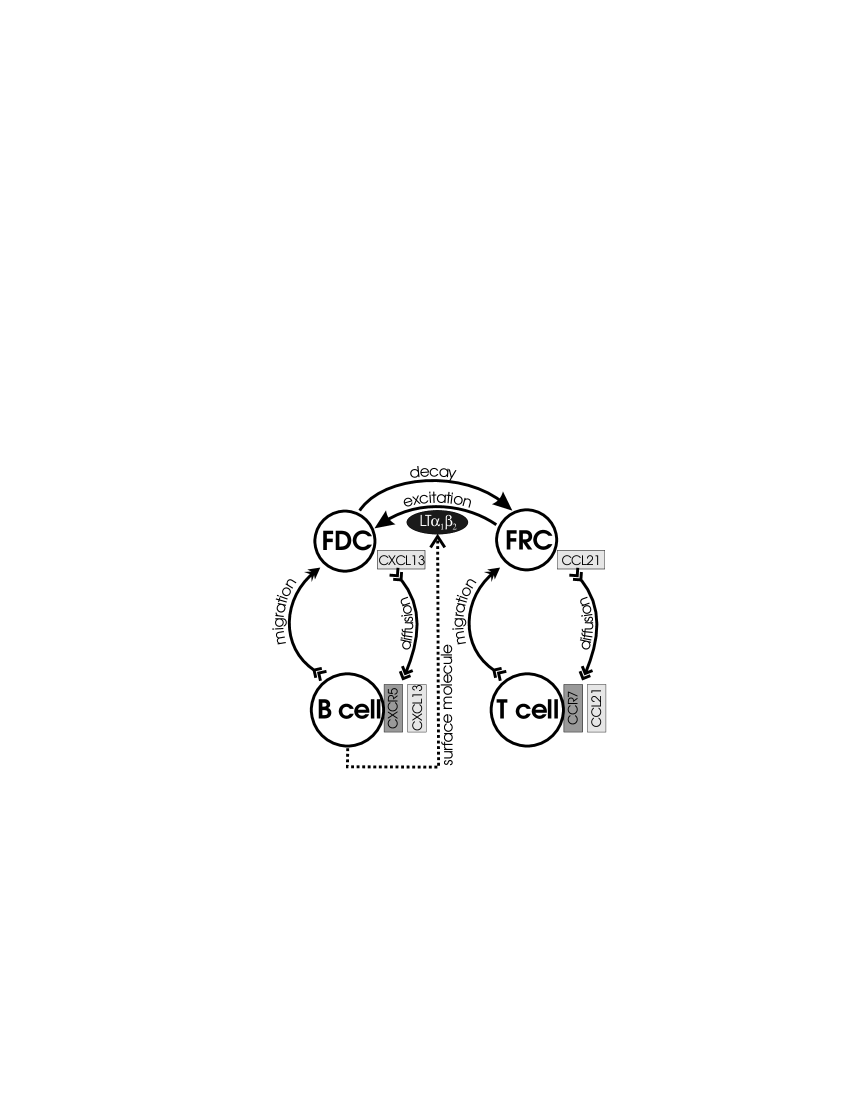
In order to illustrate the model features, the model is used to investigate certain features of cell behavior that are relevant for the formation of primary lymphoid follicles (PLF). These can be found in secondary lymphoid tissue (SLT) like the spleen and lymph nodes [12, 19, 14, 20, 21, 22]. Two lymphocyte cell populations of the PLF show fast migration: B cells and T cells. Two sessile populations, namely follicular dendritic cells (FDC) and fibroblastic reticular cells (FRC) serve as a complex 3D substrate for lymphocytes. The morphology of SLT is characterized by PLF and T zones. The PLF contains the B cells and the FDC. It is adjacent to the T zone harboring T cells and FRC. The functionality of the model features is demonstrated by analyzing the migration of the lymphocytes and their interaction with chemokines. Also the generation of a tissue in flow equilibrium is studied using a toy model inspired by PLF formation. On the basis of biologically proven interactions the model can explain a clear separation of T and B cells forming a T zone and an FDC containing follicle, as found in real tissue. However, more realistic models of PLF remain to be developed in future work.
The presented simulation technique has a direct connection to experimental constraints and exhibits the potential of building physically concise models of cell migration in tissue. It’s novelty with respect to previous work relies on the focus on tissues composed of rapidly migrating cells which exhibit cell-flow-equilibrium. This extends the range of applications of agent-based off-lattice techniques to lymphoid tissue.
2 Method
The tissue formation problem of migrating cells is simulated using an agent-based model on top of a regular triangulation [15, 16, 23, 24]. The regular triangulation is used to provide the neighborhood topology for the cells that allows for a continuous representation of cell positions and sizes in contrast to grid-based methods. The regular triangulation also provides information about the cell contacts and contact areas, and, within the limits of an approximation, about cell volume and shape [25, 8]. The regular triangulation will be briefly summarized in the next subsection.
The simulation of cells is realized in a 3-level multiscale model. The first level is the internal state of the cells representing the dynamics of the phenotype of the cell (see Sec. 2.2). The second level models the contact interaction between cells including mechanical interactions with the environment and exchange of signals by membrane bound molecules (see Sec. 2.3). The third level incorporates long range interactions via diffusive substances for example chemotaxis, i.e. directed motion of cells upwards a concentration gradient which is induced by molecular chemoattractants (see Sec. 2.4). Thus, chemoattractants are derived from cellular sources and feed back to cell migration.
2.1 Regular triangulation
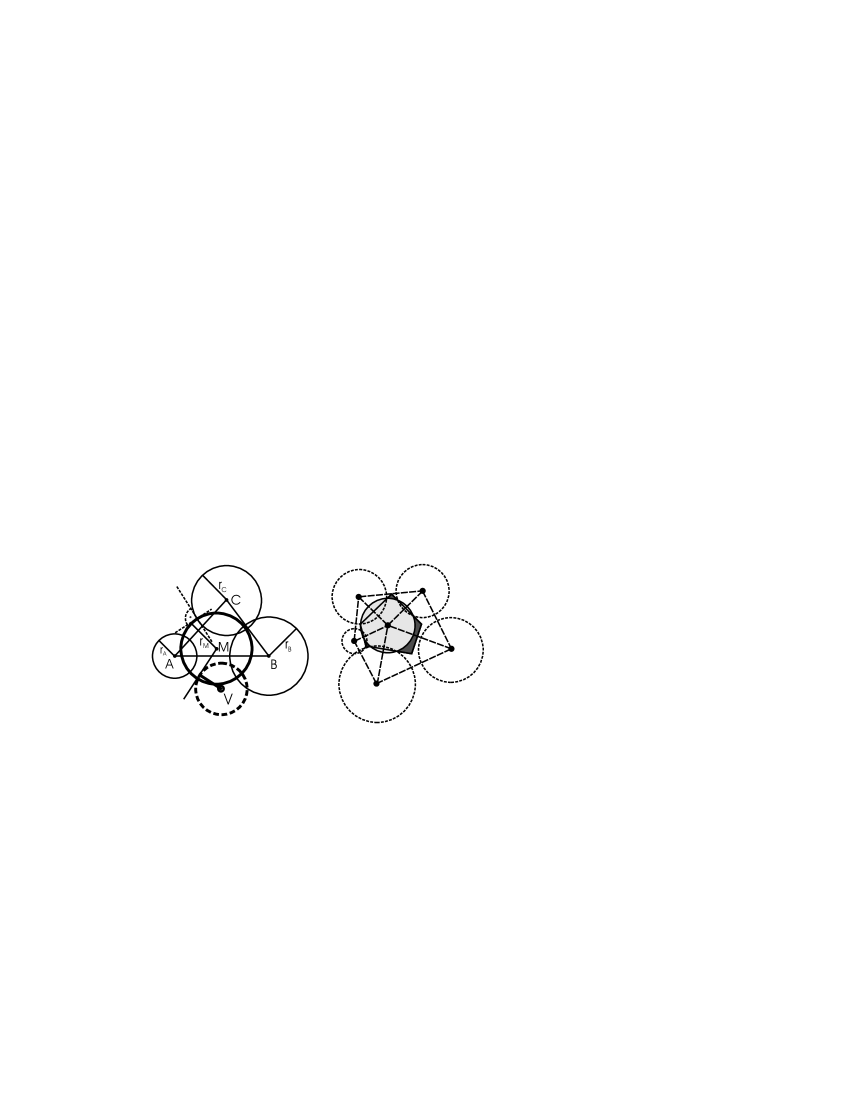
Each cell is represented as a sphere at position with radius . A vertex is defined by the pair . The regular triangulation is defined using the empty orthosphere criterion [17, 15, 16]. In three dimensions four vertices forming a tetrahedron uniquely define an orthosphere (Fig. 1). The orthosphere is empty if for any other vertex
| (5) |
holds provided that the four vertices are oriented positively, i.e. if
| (10) |
The symbols denote the coordinates of vertex at the position and the corresponding radius of the elastic sphere associated with the vertex. The notation for the vertices is analogously defined. A set of non-overlapping tetrahedras covering a set of vertices forms a regular triangulation if all orthospheres attributed to these tetrahedras do not contain any further vertex. The regular triangulation, and with it the neighborhood topology, changes when cells are moving, and when they are added or removed from the system due to cell flux, cell death or cell proliferation. The corresponding algorithms have been developed and published previously for serial [23] and parallel computer architectures [24].
2.2 Internal cell dynamics
The phenotype of a cell is described by a set of internal cell variables . These include internal times to indicate when which type of event may happen. An example is the persistence time of cells during chemotactic motion [26, 27, 28, 29, 30]. When the persistence time has past, the cell can reorient to the local chemoattractant field [31, 32].
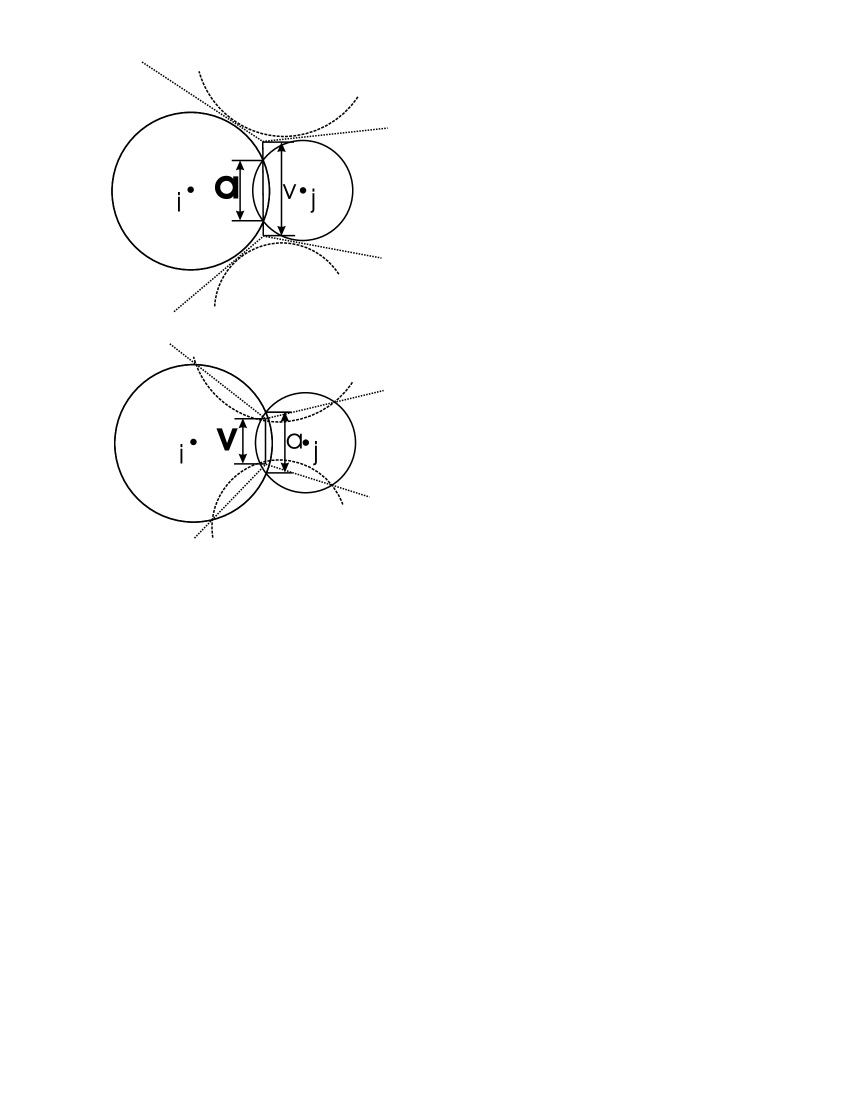
Upon contact two cells can exchange signals via the contact surface. In a simple approach with unpolarized ligand/receptor distributions the signal strength is proportional to the contact area. The contact area is computed as the minimum between a sphere overlap and the common Voronoi face of these cells (Fig. 2). This choice relies on the fact that the Voronoi-contact area is the better description for high density of cells while the virtual overlap of the spheres is more realistic for low density systems [8, 18]. In both cases the alternative measure for the shape leads to larger estimates which justifies the present choice. In general the minimum of the two contact areas is close to the realistic contact of two elastically deforming spherical cells.
Finally, a set of variables describes the mechanics of the cell: velocity, orientation, cell volume, and elasticity. These variable couple directly to the next level of description, the contact interaction of cells, and have no direct influence on other internal states but may influence the corresponding variables of neighboring cells.
2.3 Equations of motion
The contact interaction of cells is predominantly given by mechanical interactions. It is described by Newtonian equations of motion in the overdamped approximation [2, 4, 8]. In this approximation acceleration of cells and consequently conservation of moment can be ignored. With dots denoting time derivatives we then have
| (11) |
The active forces on cell (if any) at position depend on the internal state of the cell and the internal state of neighboring cells , while the passive forces depend on the positions of the cell and its neighbor cells in contact with cell . Active forces can also be exerted directly to the surrounding medium. Therefore the set includes all Delaunay-neighbors independent of whether they are in physical contact with the cell or not. All these forces are counter-balanced by the velocity-dependent drag forces . Because of the overdamped approximation this results in an ODE system of first order for the cell positions.
The passive forces are composed of forces stemming from the cell’s elasticity and compressibility
| (12) |
where recollects elastic interactions and surface energy.
2.3.1 Elastic cell-cell interaction
Elastic forces between cells are treated according to the JKR-model [33]. They depend on the virtual cell overlap where and are the cell radii.
| (13) |
with the cell’s elastic moduli and , Poisson numbers and , and the surface energy . The force acts in direction of the normal on the contact face
| (14) |
The applicability and the limits of the JKR-model for modeling elastic interactions between spherical cells have been quantified recently [34].
2.3.2 Many-body interactions
The JKR-model defines a two cell interaction which exhibits an equilibrium distance mediated by the balance of surface energy and elastic repulsion. For two cells this leads to a negligible deviation of the volume attributed to the vertex and the relaxed volume of the real cell. However, cells will frequently interact with several cells such that specific situations can occur in which cells are strongly compressed by surrounding cells without a corresponding large relaxing force being generated. Thus, cells might remain in a highly compressed state for too long times because of the neglect of many-body interactions. To account for the cell volume and approximately ensure volume conservation, a cell pressure concept is included [4, 8]. The pressure of cell is calculated as deviation of the actual cell volume from the target volume
| (15) | |||||
| (16) |
where a linear compression model with compressibility is used. The forces resulting from this pressure are exerted between cells by adding the term
| (17) |
to the passive cell forces in (12). is the contact surface of the cells with neighbor cells or the medium. In case of contact surface with the medium is calculated as minimum of the Voronoi face and the sphere overlap with an equal-sized virtual cell being at equilibrium distance with respect to the JKR forces. To get the actual volume the minimum of the sphere volume and the Voronoi cell volume is taken which is motivated by similar arguments as for the contact area of two cells [8, 18].
2.3.3 Force generation of migrating cells
Previous models that incorporate the active forces of migrating cells [2, 3, 4] use a net propulsion force that is exerted into the direction of motion by pulling on neighbor cells. However, cells also exert forces perpendicular to the direction of motion which can be even larger than the net force as it has been shown for keratocytes [35, 36]. The target application is lymphoid tissue which requires to describe lymphocytes. However, the mode of migration is different for these cells. It depends on the so-called constriction ring [37, 38, 39, 40, 41]. Therefore the active force generation model of fast migrating cells is based on the constriction ring model thus taking into account the lateral forces during active migration of lymphocytes.
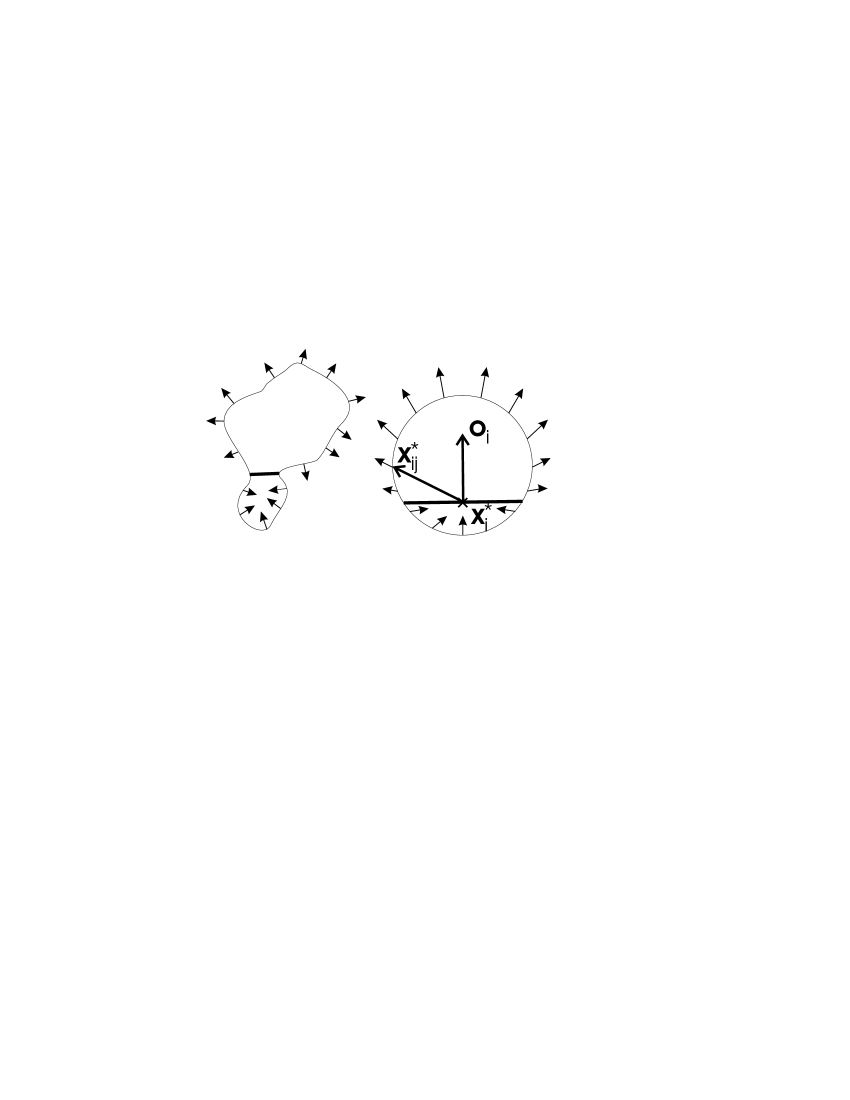
Cells use a ring to attach a part of their membrane and cytoskeleton to the extra-cellular matrix and exert outward directed pressure to their environment by contracting the rear of the cell (Fig. 3). The ring remains fixed with respect to the extracellular matrix and therefor moves towards the end of a cell during migration. In a simplified approach a new ring is generated at the front of a cell only when the preceding ring has reached the end of the cell. The force acting on cell by exerting active forces on a neighbor cell reads
| (18) |
with the cell orientation , cell surface contact point , constriction ring center (which generally differs from the cell’s center), interaction area and the pressure actively exerted by cell . Note that is a parameter of the model and shall not be confused with the pressure in (15).
Additionally a constant active force is directly exerted on the extra-cellular matrix opposite to the direction of the cell’s orientation , i.e. the cell is pushed forward against the matrix by the force in the direction . The orientation of the cell is parallel to the local chemotactic gradient (Sec. 2.4).
The motion of cells can also be characterized using a motility coefficient that is similar to diffusion coefficient in Brownian motion. However, it is not just a result of physical contacts with the environment but also involves intrinsic features of cell migration. The motility coefficient is influenced by the cell’s speed and the mean free path length [42]. In cells the latter one is determined by the persistence time during which the cell maintains its polarized structured fixing the direction of force exertion and therefore the direction of motion [26, 27, 28, 29, 30].
| (19) |
Thus the persistence time is a parameter describing the migration of cells which is required in addition to the force generation.
2.3.4 Friction forces
The component of the friction forces between two cells and in contact read
| (20) |
taking into account only the tangential parts of the relative velocity consistent with the treatment of the cell-cell interaction by the energy conserving JKR-model (13). The force depends on the relative cell velocity . The overdamped approximation and low Reynolds-numbers of cell migration justify the linear velocity-dependence [2, 4, 8]. The unit vector is the normal vector of the plane of the cell contact. The friction coefficient has the dimension of a viscosity times a length scale. is chosen proportional to the contact area between the cells. The total drag force is the sum of all friction forces with neighbor cells plus a term of the free surface of the cell having interaction with the surrounding medium. The overall drag force is then given by
| (21) |
with medium viscosity and the cell-specific viscosities . is the surface in contact with other cells. is the total surface of a cell. The friction coefficient fulfills the symmetry . The form of the friction coefficients is motivated by the Stokes relation for the friction of a sphere at velocity in a medium with viscosity
| (22) |
The geometry related factor is absorbed in the cell-specific viscosity in (21). The coefficients and are chosen such that reasonable active forces have to be generated by the cells in order to match the cell velocities measured experimentally (see Table 1).
2.4 Reaction-diffusion system of chemoattractants for long-range interactions
The chemotaxis of cells is described by coupling the direction of migration of a cell to the local chemoattractant gradient. According to the observation that leukocytes tend to have a persistence time between subsequent orientation changes [28, 20, 29, 26, 27] the gradient is sensed by the simulated cells periodically and is kept constant in between. The concentration of a chemoattractant is computed solving the time dependent diffusion equation. The time dependence is included for two reasons. First, to account for a dynamics of sources that frequently generates new or removes present sources. The time to equilibrate the concentration after changing the source is far longer than the typical times for cell migration such that the cells can sense this temporal concentration change. Second, the internalization dynamics presented in the next section acts on a time scale comparable to the cell migration but much faster than the time scale required for the chemokine diffusion to be equilibrated on the tissue scale.
2.4.1 Internalization model
The internalization of chemoattractant receptors occurs naturally when they are bound by their ligand [43, 44, 45]. Studies showed that desensitization of chemoattractant receptors exposed to high chemoattractant concentrations [46] occur probably by internalization. Alternative possibilities would be a chemical modification of the receptors which is not considered here. Of note, some experiments fail to detect chemoattractant responses of freshly isolated cells despite the presence of the corresponding receptor [47]. Thus, the presence of receptors is necessary but not sufficient to cause chemotaxis of cells. Most likely the suppression of the receptor function is mediated by a desensitization mechanism either by internalization or cross-desensitization [44].
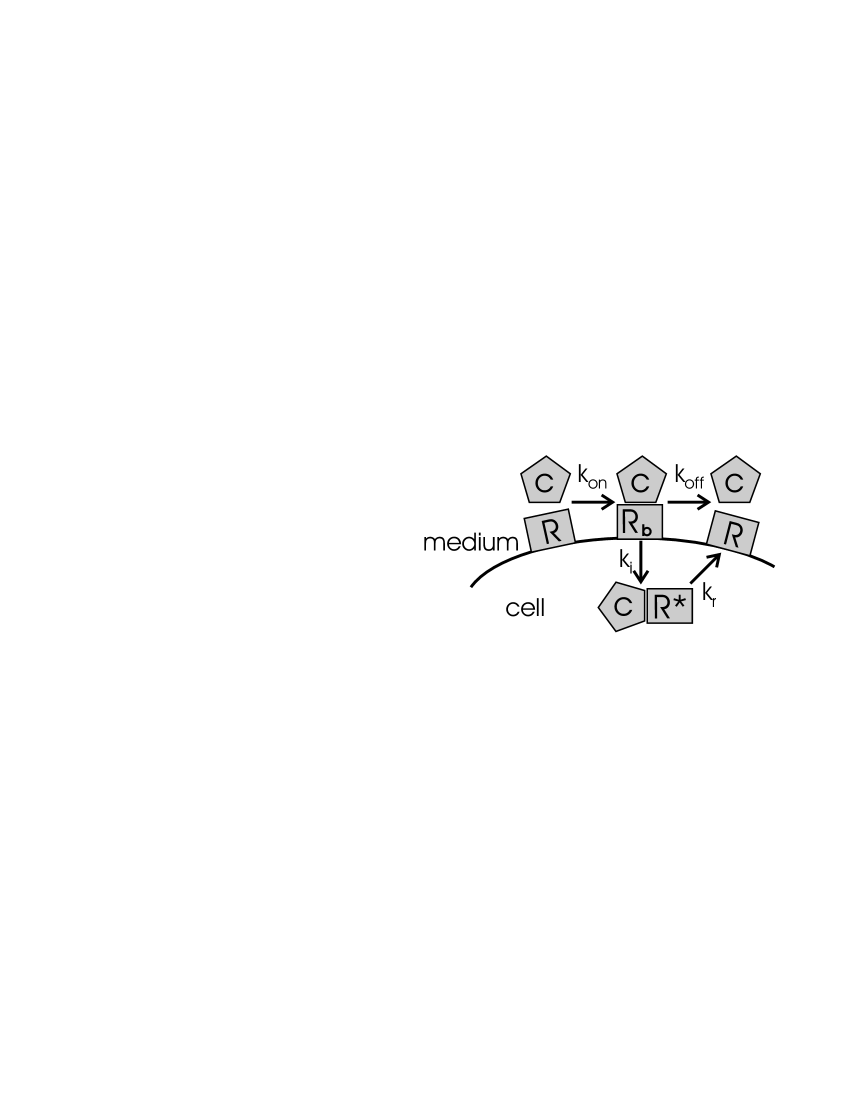
Desensitization of cells with respect to a chemoattractant is achieved by internalization of the receptors which have bound the chemoattractant with rate [45]. Thus the receptor comes in three states: free on the cell membrane (), bound to the ligand on the cell membrane (), and internalized with the ligand () (Fig. 4), leading to the dynamics:
| (23) |
The binding of the ligand is characterized by the on and off rate constants and leading to the ligand-receptor complex . The rate describes the recycling of the internalized receptor into the free membrane form . The basic assumption is that the total receptor content is conserved, i.e. no terms describing the transcription or degradation of the receptor are included in (23). This view is supported by the fact that internalized ligand-receptor complexes dissociate such that free receptor become available in the cell [45]. The assumption allows to eliminate the equation for from the system (23).
The reaction equations (23) are completed by an unspecific decay of the chemoattractant, a source term , and a diffusion term for the ligand. The decay term is in accordance with the fact that chemoattractants are inactivated and processed by all cells without reaction with the proper receptor [44]. This limits the life time of a chemoattractant molecule. The receptors are also transported by cells such that the whole system (23) is a reaction-diffusion system. It is solved using a splitting method of first order in time [48, 49].
3 Model of primary lymphoid follicle formation
This section briefly describes the underlying biological concepts of PLF dynamics. The required ingredients to study the formation of the PLF are the B and T cell flow and the dynamics of the sessile cell populations, i.e the behavior of FDC and FRC. The parameters for the simulation are given in table 1. A detailed parameter estimate for the reaction-diffusion system (23) is given in the appendix.
3.1 Flux of B and T cells
B cells are constantly entering SLT predominantly via specialized blood vessels (reviewed in [21]). It is less clear how B and T cells leave this tissue. Recent experimental data suggests that lymphatic vessels guide cells to leave SLT [21]. In a simplified model cells enter and leave the tissue through separate spherical areas that do not further interact with the system. However, one should be aware that in real SLT the lymphatic endothelium which may be involved in the efflux of cells is located exclusively outside the PLF [50, 51, 52, 53, 54, 55, 56, 57, 58, 59, 60]. Thus, there may be some interaction that couples PLF formation with the location of exit spots which we ignore in the presented toy model.
In order to allow the cells to remain and interact within the tissue for a certain time they are not permitted to use the exit areas before a minimal transit time has past. This time is about 3 hours according to a receptor dynamics [61]. This is consistent with measurements of the minimal transit time of lymphocytes [52, 62, 63]. In order to establish a sufficient cell efflux a chemoattraction towards the exit spots is assumed. This is supported by experimental evidence [61, 64, 21]. Due to a lack of information the corresponding receptor is treated with a simplified model without taking into account receptor internalization.
3.2 Migration of B and T cells
The migration of B and T cells within SLT follows similar principles. Both cells can perform chemotaxis and random motion. It has been shown experimentally that B cells are predominantly attracted by the chemoattractant CXCL13 [21]. Both, B cells and T cells respond to CCL21 with T cells being more sensitive [21]. The corresponding receptors are CXCR5 (for CXCL13) and CCR7 (for CCL21). FRC are the source for CCL21 and FDC produce CXCL13 (FIG. 5).
3.3 Dynamics of sessile cell populations
Although the origin of FDC is not clear there is strong evidence that they are derived from FRC found in the T zone of SLT [65]. Therefore, it is assumed that FDC are an excited state of FRC. The excitation is mediated by the contact signal LT provided by the B cells [12, 13, 14] (FIG. 5). The FDC-B cell interaction has been shown to be reversible [12] in the sense that the absence of the B cell signal lets the FDC vanish. In the model context that is described as the decay of the excited FDC state back into the FRC state. Note that, alternatively to the assumed scenario FRC and FDC may also have a common progenitor which can develop in either FRC or FDC depending on external stimuli. This is not considered explicitely in the present model.
Within the PLF model an FRC differentiates to an FDC when the signal threshold for LT has been exceeded for a given time . The signal is determined by summing up all LT contributions from neighbor cells, i.e. surface density of LT times contact area. The differentiation is then instantly performed changing the internal cell states of an FRC into that of an FDC, i.e. replacing a source for CCL21 by a source for CXCL13. In a similar manner FDC differentiate back to FRC after the LT signal is below the threshold for a critical time . For simplicity and considering the lack of corresponding experimental data and equal LT thresholds are assumed.
3.4 Sequence of events for follicle formation
The overall picture of PLF formation is as follows. A background of immobile FRC produces CCL21. B and T cells enter the tissue through the blood vessels which are represented by few (10) spheres of 30 diameter [66] randomly scattered in an area of 150 size. When sufficiently large B cell aggregates form, FRC are induced to become FDC by LT thus replacing a production site for CCL21 by a CXCL13 source. This attracts more B cells and enlarges the forming PLF. T cells are kept outside the PLF just by coupling to the CCL21 which is produced around the PLF by the remaining FRC. Both, B and T cells, leave the tissue through exit spots which are represented as spheres acting as sinks for cells. Any dynamics on the exit spots that may result from PLF formation are ignored (compare Sec. 3.1).
| parameter | value | remarks/ref. | |
|---|---|---|---|
| B/T cell diameter | 9 | [51, 67, 68, 69] | |
| 1 kPa | [70, 71, 72, 34] | ||
| 0.4 | [73, 74] | ||
| 0–0.3 | [75, 76] | ||
| 120–180 s | [26, 28] | ||
| 500 nN | [26, 27, 28, 29, 70, 71, 77] | ||
| 3 h | [51, 78, 79] | ||
| 10–100 | [80] | ||
| size of diffusion grid | 1200 | ||
| grid resolution | 35 | ||
| max. cell displacement | 0.9 | ||
| min. time resolution | 10 s | ||
| B : T cell ratio | 0.4 : 0.6 | [63, 81] | |
| influx of cells (B + T) | 0.1–2 | [63, 81] | |
| size of simulation area | 600 | ||
| number of FRC | 2500 |
4 Results
4.1 Biomechanics of lymphoid tissue
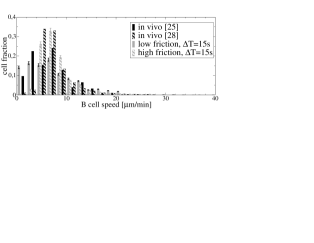
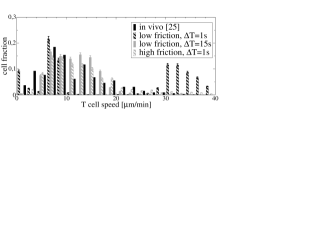
The active forces exerted by lymphocytes to the ECM () and to other cells (, (18)) are not known explicitely (there are just estimates based on experiments of other cell types [82, 35, 83, 84]). The same applies to the friction parameters ( and , (21)). For simplicity it is assumed that for all lymphocytes. As the known average speed is essentially determined by the ratio of active forces and the friction parameters only 2 parameters per cell type remain unknown. These can be determined from the measured speed distributions for B and T cells within SLT [26, 29]. A reduced cell system with a constant number of lymphocytes that respond to a chemotactic point source is used. The cell constituents are either B or T cells only or an even mix of both cell types.
The parameters for the JKR-forces are relatively well known. The parameters entering (13) are the elasticity of lymphocytes [70, 71, 72, 34], the Poisson number [73, 74], and the surface energy [75, 76]. Thus the elastic cell interactions can serve as reference forces limiting the reasonable range of friction parameters. Therefore the fit to the speed distribution was performed with two qualitatively different friction regimes. In the low friction regime () the active forces that are required to produce the correct speed distributions are of the same order as the JKR forces. In this regime it turns out that the mode of measuring the cell speed becomes crucial: The speed distribution of the real system was measured on the basis of the average displacement over an interval of [26, 29]. These data are reproduced and compared to the simulation results in the two upper panels of FIG. 6. Using a faster sampling with the speed distribution becomes different and exhibits the influence of JKR forces that lead to fluctuations at rather high speed (FIG. 6 top right panel). The JKR forces dominantly lead to reversed or perpendicular motion of cells with respect to their migration axis when cells collide due to active movement. Thus the net-displacement by JKR forces during is rather small and does only show up at lower speeds in the resulting distribution when longer sampling intervals are used.
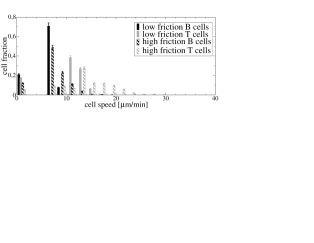
In the second regime with high friction () (FIG. 6) the average speed with and match each other (not shown). The resulting speed distribution usually fit better to the experimental ones, in particular, because low speed contributions now are shifted to the peak resulting in a sharper speed distribution. Moreover the components of the speed distribution in the low speed range are smaller as the active forces can more easily overcome the JKR forces such that cells are less likely to be immobilized in an cellular environment of high density. However, the active forces are higher than measured experimentally [82, 35, 84]. Yet, the parameter set is computationally favorable as the high speed fluctuations are missing. This allows for larger time steps in the simulation.
The effect of active forces resulting from the constriction ring model is relevant to the speed distribution. Without these active inter-cellular forces the speed distribution shows only sharp peaks (FIG. 6 lower panel). Also when the speed distribution of each lymphocyte subset is fitted using a homogeneous cell aggregate the peaks in the speed distribution tend to be sharper than in experiment. This could be compensated with larger active cell interaction forces which however produces the wrong speed distribution when B and T cells interact which each other (not shown).
4.2 Stable follicle formation
The simple model of PLF formation is able to generate stable follicle sizes of a few 100 diameter with roughly B cells. The follicle forms around the exit spots engulfing them almost completely (FIG. 7 (a)). The adjacent T zone is crescent-shaped but tends to form a closed shell around the B cells. The T zone is basically determined as non-B zone and T cells occupy the remaining space by random migration around the follicle. However, they do not diffuse freely in the whole space due to the chemoattraction to the exit spots. Thus this toy model of PLF formation generates a tissue in flow equilibrium with dynamically generated sources of cell attraction and keeps B and T cells separated.
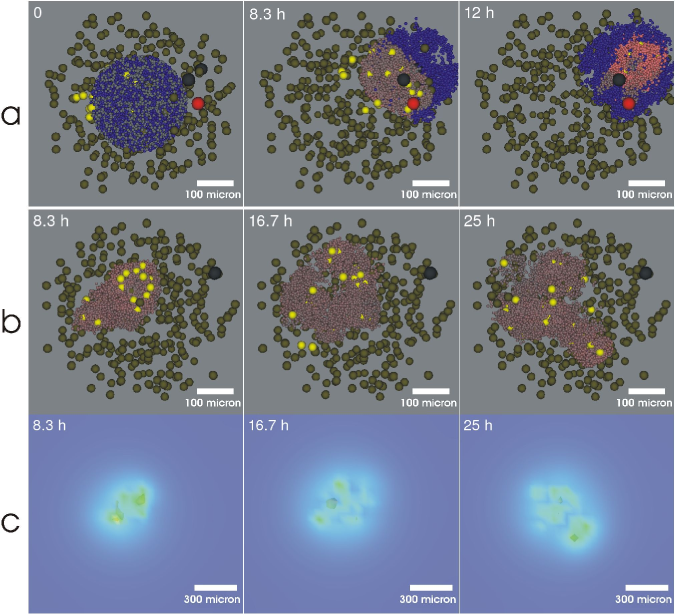
The localization of the follicle is stable (a). Even a preformed FDC network with a number of unsorted B and T cells cannot prevent the formation of the follicle around the exit spots. The remainder of the initial configuration is an orientation of the PLF in the direction of the initial FDC (a, 8.3 h) which is dissolved later on (a, 12 h).
The internalization dynamics is visualized in a simulation with a constant number of B cells (b). Receptor internalization is found to be a source of instability involving rapid morphological changes of B cell distributions. Note that the CXCL13 distribution behaves accordingly (c, CXCL13 concentration increases from dark grey (blue) to white (red)). The concentration Was visualized with OpenDX (http://www.opendx.org).
4.3 Effect of receptor internalization
When studying a stable follicle including chemotaxis towards exit spots the effect of CXCR5 internalization dynamics on the follicle shape is not visible. In order to isolate the structural effect of CXCR5 receptor internalization, the chemoattraction to the exit spots is switched off. Then a flow equilibrium of B cells is no longer possible as the efflux of cells is strongly suppressed (not shown). This reflects that randomly migrating cells rarely find the exit spots. Consequently, cell influx and efflux are completely shut off which imposes a constant B cell number. This allows to study the FRC-FDC dynamics together with the internalization dynamics of CXCR5 alone. It is found that the internalization dynamics on its own is a source of instability for the system as the forming follicle cannot maintain its shape (FIG. 7 (b)).
Note, that this result is not affected by considering the internalization dynamics under B cell flow conditions. This can be investigated by compensating the low efflux of B cells, which arises due to switched off chemoattraction to the exit spots, by distribution of the exit spots over a large area. The instability is even stronger because the outflowing B cells act as an additional sink for CXCL13 by taking surface bound CXCL13 out of the tissue.
The effect of receptor internalization can be understood by comparing the results to a simulation without CXCR5 internalization. If the binding state of the chemoattractant receptors is frozen the cells would migrate like being in a potential attracting them to FDC. This is rather independent of the B cell-induced dynamics between FDC and FRC because the migration is much faster such that the B cell distribution can equilibrate. Thus the distribution of B cells and FDC would match each other and the follicle would be stable. The internalization dynamics can however change the ’potential’ formed by the chemoattractant on a time scale comparable to the cell migration (FIG. 7(c)). As the cells act as sinks for the chemoattractant they are always generating local gradients away from their current position. This cannot be overcome by diffusion of the chemoattractant which is slower than the cell migration on the corresponding cellular length scale. Note that the instability only occurs for a sufficiently large number of B cells because otherwise the sink for the chemoattractant is too small to change CXCL13 gradients significantly.
The instability of the follicle shape is amplified by the FRC-FDC dynamics. As the B cells spread out preferentially at the boundary of the follicle, where CXCL13 concentrations are rather low, they extent beyond the follicle border and increase the B cell density outside the follicle. Thus, the area covered by the B cells is bigger than expected from a dense packing of the B cells in the FDC area. This culminates in the generation of new FDC. As on one hand B cells are very motile and on the other hand FDC need some time to dedifferentiate to FRC, on long term this results in an FDC network which is bigger than the volume required by the number of B cells. Thus the whole PLF becomes unstable in shape following the changed ’center of mass’ of the FDC network as determined by the concentration peaks of CXCL13.
5 Discussion
A model architecture was presented that allows to simulate fast cell migration taking into account subtle effects of chemoattractants and cell influx and efflux from tissues. Cells are represented as visco-elastic objects. They interact with adjacent cells by passive and active forces. The model allows to simulate detailed mechanics of single cells and individual coupling of internal cell dynamics to cell mechanics as well as to contact- and long-range-interactions. The use of an underlying regular triangulation permits a continuous description of cell positions and motility. It provides an efficient way of defining the neighborhood topology for cells of different size in tissue of different density. The advantage of the regular triangulation is to provide an effective method to implement fluxes of highly motile cells by dynamical modifications of the triangulation. In contrast, lattice-based architectures have difficulties to model fast cell migration. Either complicated rules are needed or a lattice-gas model is required [85]. In both cases the parameters coupled with the modifications are not easily converted to observable quantities. Using a physical representation of cells allows to directly access the involved parameters by experiment. This consequently requires a lattice-free description as implemented in the present model based on a regular triangulation. The triangulation is complemented by a grid for solubles like chemokines. The reaction-diffusion-equations are solved on that grid. Thus, the model acquires a hybrid model architecture. The model is based on parameters with physiological well-defined meaning such that the number of parameters is considerably reduced if the corresponding experimental values are known. This is, indeed, the case for most parameters in the present test-application.
The biomechanics of cellular aggregates of fast migrating cells has three components: passive mechanical interaction described by JKR forces, active forces exerted on extra-cellular matrix, and active forces directly acting between cells. In general the active forces dominate the JKR forces which allows cell movement in dense configurations. The speed distribution with high friction and consequently large active forces allows cells to more easily overcome the repulsion generated by JKR forces. Thus, the high friction regime mimics large deformations of cells without explicitely taking into account the shape of migrating lymphocytes which elongate in the direction of motion [26, 27, 28, 29, 30]. Alternatively, the elastic modulus of cells could be scaled to appropriate values below the physiologic values and correspondingly decreased adhesion parameters .
The constriction ring model takes into account lateral force generation by actively migrating cells which are ignored in other force-based models that consider only the generated net force [2, 4]. It is shown that the cell interaction due to the exchange of active forces is the major determinant of the width of the speed distributions. Thus this interaction might be interpreted as a Brownian motion-like fluctuation of the cell speed also it is deterministic. The parameter coupled with the constriction ring is the pressure the pressure (18). The force exerted to the extra-cellular matrix may be either generated by the integrated pressure of the constriction ring model directly exerted to the matrix or by the filopodia dynamics of the classical three-step migration model (reviewed in [77, 86]). Recent data demonstrates that both migration modes act in lymphocytes [87] although the contribution of the constriction ring is greater during chemotactic responses of migrating lymphocytes [88, 89, 87]. Especially, the characteristic time of the cytoskeleton dynamics of the ring coincides nicely with the persistence time [41, 87]. The persistence time, the time interval during which the direction of active forces is constant, is likely to be an intrinsic feature of the underlying cytoskeleton dynamics [90, 39, 41, 91, 87].
The test-application for the full model involves a simple approach to the formation of PLF and has proven the functionality of the model. More specifically, the motility properties of the cells could be adjusted to in vivo motility data of lymphocytes in lymphoid follicles. The model generates homeostatic follicles in a flow equilibrium of reasonable size of few 100 [92, 93, 94, 95, 50] demonstrating that the model architecture is able to describe systems that are in a cell flow equilibrium of fast migrating cells.
The effect of CXCR5 receptor internalization was demonstrated under non-flow conditions. Within the investigated parameter range (see appendix) the dynamics of CXCR5 and CXCL13 leads to a modification of the concentration profile such that cells temporarily migrate away from sources. This leads to a frequent change in shape of the cell aggregate. Such a behavior was not observed in vivo [28]. Therefore either internalization of CXCR5 does not occur in the PLF system or mechanisms exist that counter-balance the shape dynamics. Higher CXCL13 concentrations can overcome this effect as the internalization cannot act as a sufficient sink to locally invert the gradient of the chemoattractant (not shown). However, the cells then have strongly downregulated receptors such that they loose there chemotactic sensitivity, i.e. cells start to migrate randomly preventing efficient aggregation on long terms. We observed a stable follicle shape under flow conditions when the B cells chemotax to the exit spots without internalization dynamics. Thus, chemotaxis to the exit spots works as an independent attractor for B cells that can compenstate for locally inverted gradients of CXCL13 resulting from the receptor internalization of CXCR5.
The main purpose of this article was to establish a simulation platform suitable for modeling of homeostatic tissue dynamics on a cellular and subcellular level involving large numbers of fast migrating cells. The results have demonstrated that the proposed model design can cope with the complexity that occurs in tissue exhibiting a flow equilibrium of fast migrating cells. In particular, it clearly separates the various time and length scales and allows to localize the origin of emerging properties on the tissue level as well as on the cellular and molecular level. We, therefore, consider this simulation tool to be a suitable instrument for the analysis of morphogenesis of highly dynamic tissue. However, concerning the application to follicle formation, the assumed mechanisms are only subparts of full PLF formation dynamics that need to be refined in order to reproduce microanatomical data and to make realistic and quantitative predictions, which is left for future research.
Acknowledgments
FIAS is supported by the ALTANA AG. Meyer-Hermann is supported by the EU-NEST project MAMOCELL within FP6. *
Appendix A Estimate parameters for chemoattractant reaction-diffusion system
The parameters used in the ODE system (23) are not known but can be estimated from data of similar systems. The dissociation constant for chemoattractants and their receptors are mostly measured for other chemoattractants than the ones used here (CCL21 and CXCL13) (Table 2). The values for range from 0.2 nM to 5 nM [96, 97, 98, 99]. The dissociation constant for CCR7 with CCL21 has been measured to be 1.6 nM [100]. Considering the range of these values it is likely that adopts values in this range in the present system. A less favorable situation exists for the reaction rate constant (). Only few data exists which spread over several orders of magnitude. Values for the association rate are available for CXCL12 binding to fibronectin [98] () . The off rate measured for CXCL12 binding to fibronectin is .
The two rate constants and associated with receptor internalization and recycling (see (23)) can be estimated from experimental data on receptor desensitization and resensitization experiments which are reviewed recently [45]. It is assumed that all non-internalized receptors have bound the ligand when high chemoattractant concentrations far above are used as done in the experiment. The only equation that is left for the desensitization process is then (23) ()
| (24) |
with the solution
| (25) |
The internalized receptor fraction at equilibrium becomes
| (26) |
For the resensitization process we set and start from . In the absence of the ligand the dynamics for the internalized receptor during resensitization becomes
| (27) |
With typical values of for desensitization and typical recycling times of 60–180 minutes (to get upon resensitization [45]) one arrives at
Assuming that the internalization process is not in steady state – and solving (25) numerically – doesn’t change the results very much compared to the experimental uncertainty. The numerical results of PLF-formation are not sensitive to these parameters (data not shown).
is not known explicitly. From similar receptors the number of CCR7 molecules on T cells has been estimated to be per cell [100] and for B cells as indicated by the studies that find a factor 10 difference of CCR7 levels between B and T cells [101]. Note that the values cited above have to be converted into the receptor concentration based on the cell densities of the corresponding lymphocyte type.
References
- [1] G. M. Odell, G. Oster, P. Alberch, and B. Burnside (1981). The mechanical basis of morphogenesis. I. Epithelial folding and invagination. Dev. Biol., 85(2):446–62.
- [2] E. Palsson and H. G. Othmer (2000). A model for individual and collective cell movement in Dictyostelium discoideum. Proc. Natl. Acad. Sci. U.S.A., 97(19):10448–53.
- [3] E. Palsson (2001). A three-dimensional model of cell movement in multicellular systems. Future Gen. Comp. Sys., 17:835–852.
- [4] J. C. Dallon and H. G. Othmer (2004). How cellular movement determines the collective force generated by the Dictyostelium discoideum slug. J. Theor. Biol., 231(2):203–22.
- [5] D. Drasdo, R. Kree, and J. S. McCaskill (1995). Monte carlo approach to tissue-cell populations. Phys. Rev. E, 52(6):6635–57.
- [6] D. Drasdo, S. D. S. Höhme, and A. Deutsch (2004). Cell-based models of avascular tumor growth., pages 367–378. Birkhäuser, Basel.
- [7] H. Honda, M. Tanemura, and T. Nagai (2004). A three-dimensional vertex dynamics cell model of space-filling polyhedra simulating cell behavior in a cell aggregate. J. Theor. Biol., 226(4):439–53.
- [8] G. Schaller and M. Meyer-Hermann (2005). Multicellular tumor spheroid in an off-lattice voronoi-delaunay cell model. Phys. Rev. E., 71(5 Pt 1):051910.
- [9] H. Meinhardt (1982). Models of biological pattern formation. Academic Press, London.
- [10] Y. Jiang, H. Levine, and J. Glazier (1998). Possible cooperation of differential adhesion and chemotaxis in mound formation of Dictyostelium. Biophys. J., 75(6):2615–25.
- [11] F. A. Meineke, C. S. Potten, and M. Loeffler (2001). Cell migration and organization in the intestinal crypt using a lattice-free model. Cell Prolif., 34(4):253–66.
- [12] Y. X. Fu and D. D. Chaplin (1999). Development and maturation of secondary lymphoid tissues. Annu. Rev. Immunol., 17:399–433.
- [13] K. M. Ansel, V. N. Ngo, P. L. Hyman, S. A. Luther, R. Forster, J. D. Sedgwick, J. L. Browning, M. Lipp, and J. G. Cyster (2000). A chemokine-driven positive feedback loop organizes lymphoid follicles. Nature, 406(6793):309–14.
- [14] S. Nishikawa, K. Honda, P. Vieira, and H. Yoshida (2003). Organogenesis of peripheral lymphoid organs. Immunol. Rev., 195:72–80.
- [15] H. Edelsbrunner and N. R. Shah (1996). Incremental topological flipping works for regular triangulations. Algorithmica, 15(3):223–41.
- [16] A. Okabe, B. Boots, K. Sugihara, and S. N. Chiu (2000). Spatial tessellations: Concepts and applications of Voronoi diagrams. Probability and Statistics. Wiley, NYC, edition.
- [17] F. Aurenhammer (1987). Power diagram: properties, algorithms and applications. SIAM J., 16(1):78–96.
- [18] G. Schaller (2006). On selected numerical approaches to Cellular Tissue. Ph.D. thesis, Johann Wolfgang Goethe-University Frankfurt Main.
- [19] U. H. von Andrian and T. R. Mempel (2003). Homing and cellular traffic in lymph nodes. Nat. Rev. Immunol., 3(11):867–78.
- [20] M. Gunzer, C. Weishaupt, A. Hillmer, Y. Basoglu, P. Friedl, K. E. Dittmar, W. Kolanus, G. Varga, and S. Grabbe (2004). A spectrum of biophysical interaction modes between T cells and different antigen-presenting cells during priming in 3-D collagen and in vivo. Blood, 104(9):2801–9.
- [21] J. G. Cyster (2005). Chemokines, sphingosine-1-phosphate, and cell migration in secondary lymphoid organs. Annu. Rev. Immunol., 23:127–59.
- [22] D. Finke (2005). Fate and function of lymphoid tissue inducer cells. Curr. Opin. Immunol., 17(2):144–50.
- [23] G. Schaller and M. Meyer-Hermann (2004). Kinetic and dynamic Delaunay tetrahedralizations in three dimensions. Comput. Phys. Commun., 162:9–23.
- [24] T. Beyer, G. Schaller, A. Deutsch, and M. Meyer-Hermann (2005). Parallel dynamic and kinetic regular triangulation in three dimensions. Comput. Phys. Commun., 172(2):86–108.
- [25] F. Aurenhammer (1991). Voronoi diagram – a survey of a fundamental geometric data structure. ACM Computing Survey, 23(3):345–405.
- [26] M. J. Miller, S. H. Wei, I. Parker, and M. D. Cahalan (2002). Two-photon imaging of lymphocyte motility and antigen response in intact lymph node. Science, 296(5574):1869–73.
- [27] M. J. Miller, S. H. Wei, M. D. Cahalan, and I. Parker (2003). Autonomous T cell trafficking examined in vivo with intravital two-photon microscopy. Proc. Natl. Acad. Sci. U.S.A., 100(5):2604–9.
- [28] S. H. Wei, I. Parker, M. J. Miller, and M. D. Cahalan (2003). A stochastic view of lymphocyte motility and trafficking within the lymph node. Immunol. Rev., 195:136–59.
- [29] T. Okada, M. J. Miller, I. Parker, M. F. Krummel, M. Neighbors, S. B. Hartley, A. O’Garra, M. D. Cahalan, and J. G. Cyster (2005). Antigen-engaged B cells undergo chemotaxis toward the T zone and form motile conjugates with helper T cells. PLoS. Biol., 3(6):e150.
- [30] M. E. Meyer-Hermann and P. K. Maini (2005). Interpreting two-photon imaging data of lymphocyte motility. Phys. Rev. E, 71(6 Pt 1):061912.
- [31] E. Albrecht and H. R. Petty (1998). Cellular memory: neutrophil orientation reverses during temporally decreasing chemoattractant concentrations. Proc. Natl. Acad. Sci. U.S.A., 95(9):5039–44.
- [32] M. U. Ehrengruber, D. A. Deranleau, and T. D. Coates (1996). Shape oscillations of human neutrophil leukocytes: characterization and relationship to cell motility. J. Exp. Biol., 199(4):741–7.
- [33] K. Johnson, K. Kendall, and A. Roberts (1971). Surface energy and the contact of elastic solids. Proc. R. Soc. London A, 324(1558):303–13.
- [34] Y. S. Chu, S. Dufour, J. P. Thiery, E. Perez, and F. Pincet (2005). Johnson-Kendall-Roberts theory applied to living cells. Phys. Rev. Lett., 94(2):028102.
- [35] K. Burton, J. H. Park, and D. L. Taylor (1999). Keratocytes generate traction forces in two phases. Mol. Biol. Cell, 10(11):3745–69.
- [36] T. Oliver, M. Dembo, and K. Jacobson (1999). Separation of propulsive and adhesive traction stresses in locomoting keratocytes. J. Cell Biol., 145(3):589–604.
- [37] W. Lewis (1931). Locomotion of lymphocytes. Bull. Johns Hopkins Hosp., 49:29–30.
- [38] J. Murray, H. Vawter-Hugart, E. Voss, and D. R. Soll (1992). Three-dimensional motility cycle in leukocytes. Cell. Motil. Cytoskeleton, 22(3):211–23.
- [39] H. Keller and P. Eggli (1998). Protrusive activity, cytoplasmic compartmentalization, and restriction rings in locomoting blebbing Walker carcinosarcoma cells are related to detachment of cortical actin from the plasma membrane. Cell Motil. Cytoskeleton, 41(2):181–93.
- [40] K. Wolf, R. Muller, S. Borgmann, E. B. Brocker, and P. Friedl (2003). Amoeboid shape change and contact guidance: T-lymphocyte crawling through fibrillar collagen is independent of matrix remodeling by MMPs and other proteases. Blood, 102(9):3262–9.
- [41] E. Paluch, M. Piel, J. Prost, M. Bornens, and C. Sykes (2005). Cortical actomyosin breakage triggers shape oscillations in cells and cell fragments. Biophys. J., 89(1):724–33.
- [42] R. B. Dickinson and R. T. Tranquillo (1993). Optimal estimation of cell movement indices from the statistical analysis of cell tracking data. Am. Inst. Chem. Eng. J. , 39(12):1995–2010.
- [43] H. Arai, F. S. Monteclaro, C. L. Tsou, C. Franci, and I. F. Charo (1997). Dissociation of chemotaxis from agonist-induced receptor internalization in a lymphocyte cell line transfected with CCR2B. Evidence that directed migration does not require rapid modulation of signaling at the receptor level. J. Biol. Chem., 272(40):25037–42.
- [44] B. Moser, M. Wolf, A. Walz, and P. Loetscher (2004). Chemokines: multiple levels of leukocyte migration control. Trends Immunol., 25(2):75–84.
- [45] N. F. Neel, E. Schutyser, J. Sai, G. H. Fan, and A. Richmond (2005). Chemokine receptor internalization and intracellular trafficking. Cytokine Growth Factor Rev., 16(6):637–58.
- [46] E. D. Tomhave, R. M. Richardson, J. R. Didsbury, L. Menard, R. Snyderman, and H. Ali (1994). Cross-desensitization of receptors for peptide chemoattractants. Characterization of a new form of leukocyte regulation. J. Immunol., 153(7):3267–75.
- [47] M. P. Roy, C. H. Kim, and E. C. Butcher (2002). Cytokine control of memory B cell homing machinery. J. Immunol., 169(4):1676–82.
- [48] K. H. Karlsen and K.-A. Lie (1999). An unconditionally stable splitting scheme for a class of nonlinear parabolic equations. IMA J. Num. Anal., 19:609–35.
-
[49]
R. Tyson, L. Stern, and R. LeVeque (1996).
Fractional step methods applied to a chemotaxis model.
URL ftp://amath.washington.edu/pub/rjl/papers/rt-lgs-rjl:ch%emotaxis.ps.Z - [50] G. T. Belz (1998). Intercellular and lymphatic pathways associated with tonsils of the soft palate in young pigs. Anat. Embryol. (Berl), 197(4):331–40.
- [51] W. van Ewijk and T. H. van der Kwast (1980). Migration of B lymphocytes in lymphoid organs of lethally irradiated, thymocyte-reconstituted mice. Cell. Tissue Res., 212(3):497–508.
- [52] T. C. Pellas and L. Weiss (1990). Deep splenic lymphatic vessels in the mouse: a route of splenic exit for recirculating lymphocytes. Am. J. Anat., 187(4):347–54.
- [53] C. Belisle and G. Sainte-Marie (1990). Blood vascular network of the rat lymph node: tridimensional studies by light and scanning electron microscopy. Am. J. Anat., 189(2):111–26.
- [54] G. Azzali and M. L. Arcari (2000). Ultrastructural and three dimensional aspects of the lymphatic vessels of the absorbing peripheral lymphatic apparatus in Peyer’s patches of the rabbit. Anat. Rec., 258(1):71–9.
- [55] G. Azzali, M. Vitale, and M. L. Arcari (2002). Ultrastructure of absorbing peripheral lymphatic vessel (ALPA) in guinea pig Peyer’s patches. Microvasc. Res., 64(2):289–301.
- [56] G. Azzali (2003). Structure, lymphatic vascularization and lymphocyte migration in mucosa-associated lymphoid tissue. Immunol. Rev., 195:178–89.
- [57] C. K. Drinker, G. B. Wislocki, and M. E. Field (1933). The structure of the sinuses in the lymph nodes. Anat. Rec., 56(3):261–273.
- [58] O. Ohtani, A. Ohtsuka, and R. L. Owen (1986). Three-dimensional organization of the lymphatics in the rabbit appendix. A scanning electron and light microscopic study. Gastroenterology, 91(4):947–55.
- [59] O. Ohtani, A. Kikuta, A. Ohtsuka, and T. Murakami (1991). Organization of the reticular network of rabbit Peyer’s patches. Anat. Rec., 229(2):251–8.
- [60] G. T. Belz and T. J. Heath (1995). Intercellular and lymphatic pathways of the canine palatine tonsils. J. Anat., 187 (Pt1):93–105.
- [61] C. G. Lo, Y. Xu, R. L. Proia, and J. G. Cyster (2005). Cyclical modulation of sphingosine-1-phosphate receptor 1 surface expression during lymphocyte recirculation and relationship to lymphoid organ transit. J. Exp. Med., 201(2):291–301.
- [62] T. C. Pellas and L. Weiss (1990). Migration pathways of recirculating murine B cells and CD4+ and CD8+ T lymphocytes. Am. J. Anat., 187(4):355–73.
- [63] A. J. Young (1999). The physiology of lymphocyte migration through the single lymph node in vivo. Semin. Immunol., 11(2):73–83.
- [64] S. R. Schwab, J. P. Pereira, M. Matloubian, Y. Xu, Y. Huang, and J. G. Cyster (2005). Lymphocyte sequestration through S1p lyase inhibition and disruption of S1p gradients. Science, 309(5741):1735–9.
- [65] K. van Nierop and C. de Groot (2002). Human follicular dendritic cells: function, origin and development. Semin. Immunol., 14(4):251–7.
- [66] M. H. Grayson, R. S. Hotchkiss, I. E. Karl, M. J. Holtzman, and D. D. Chaplin (2003). Intravital microscopy comparing T lymphocyte trafficking to the spleen and the mesenteric lymph node. Am. J. Physiol. Heart Circ. Physiol., 284(6):H2213–26.
- [67] C. B. Thompson, I. Scher, M. E. Schaefer, T. Lindsten, F. D. Finkelman, and J. J. Mond (1984). Size-dependent B lymphocyte subpopulations: relationship of cell volume to surface phenotype, cell cycle, proliferative response, and requirements for antibody production to TNP-Ficoll and TNP-BA. J. Immunol., 133(5):2333–42.
- [68] M. Bornens, M. Paintrand, and C. Celati (1989). The cortical microfilament system of lymphoblasts displays a periodic oscillatory activity in the absence of microtubules: implications for cell polarity. J. Cell Biol., 109(3):1071–83.
- [69] W. S. Haston and J. M. Shields (1984). Contraction waves in lymphocyte locomotion. J. Cell Sci., 68:227–41.
- [70] A. R. Bausch, F. Ziemann, A. A. Boulbitch, K. Jacobson, and E. Sackmann (1998). Local measurements of viscoelastic parameters of adherent cell surfaces by magnetic bead microrheometry. Biophys. J., 75(4):2038–49.
- [71] A. R. Bausch, W. Moller, and E. Sackmann (1999). Measurement of local viscoelasticity and forces in living cells by magnetic tweezers. Biophys. J., 76(1 Pt 1):573–9.
- [72] G. Forgacs, R. A. Foty, Y. Shafrir, and M. S. Steinberg (1998). Viscoelastic properties of living embryonic tissues: a quantitative study. Biophys. J., 74(5):2227–34.
- [73] A. J. Maniotis, C. S. Chen, and D. E. Ingber (1997). Demonstration of mechanical connections between integrins, cytoskeletal filaments, and nucleoplasm that stabilize nuclear structure. Proc. Natl. Acad. Sci. U.S.A., 94(3):849–54.
- [74] A. Hategan, R. Law, S. Kahn, and D. E. Discher (2003). Adhesively-tensed cell membranes: lysis kinetics and atomic force microscopy probing. Biophys. J., 85(4):2746–59.
- [75] V. T. Moy, Y. Jiao, T. Hillmann, H. Lehmann, and T. Sano (1999). Adhesion energy of receptor-mediated interaction measured by elastic deformation. Biophys. J., 76(3):1632–8.
- [76] C. Verdier (2003). Rheological properties of living materials. From cells to tissues. J. Theo. Med., 5(2):67–91.
- [77] D. A. Lauffenburger and A. F. Horwitz (1996). Cell migration: a physically integrated molecular process. Cell, 84(3):359–69.
- [78] F. Mackay and J. L. Browning (1998). Turning off follicular dendritic cells. Nature, 395(6697):26–7.
- [79] R. E. Mebius, P. Rennert, and I. L. Weissman (1997). Developing lymph nodes collect CD4+CD3- LT+ cells that can differentiate to APC, NK cells, and follicular cells but not T or B cells. Immunity, 7(4):493–504.
- [80] G. J. Randolph, V. Angeli, and M. A. Swartz (2005). Dendritic-cell trafficking to lymph nodes through lymphatic vessels. Nat. Rev. Immunol., 5(8):617–28.
- [81] R. Sacca, C. A. Cuff, W. Lesslauer, and N. H. Ruddle (1998). Differential activities of secreted lymphotoxin-alpha3 and membrane lymphotoxin-alpha1beta2 in lymphotoxin-induced inflammation: critical role of TNF receptor 1 signaling. J. Immunol., 160(1):485–91.
- [82] N. Q. Balaban, U. S. Schwarz, D. Riveline, P. Goichberg, G. Tzur, I. Sabanay, D. Mahalu, S. Safran, A. Bershadsky, L. Addadi, and B. Geiger (2001). Force and focal adhesion assembly: a close relationship studied using elastic micropatterned substrates. Nature Cell Biol., 3:466–472.
- [83] C. G. Galbraith and M. P. Sheetz (1999). Keratocytes pull with similar forces on their dorsal and ventral surfaces. J. Cell. Biol., 147(6):1313–24.
- [84] U. S. Schwarz, N. Q. Balaban, D. Riveline, A. Bershadsky, B. Geiger, and S. A. Safran (2002). Calculation of forces at focal adhesions from elastic substrate data: the effect of localized force and the need for regularization. Biophys. J., 83(3):1380–94.
- [85] A. Deutsch and S. Dormann (2003). Cellular Automaton Modeling of Biological Pattern Formation. Birkhäuser, Basel, 1st edition. ISBN 0817642811.
- [86] T. J. Mitchison and L. P. Cramer (1996). Actin-based cell motility and cell locomotion. Cell, 84(3):371–9.
- [87] K. Yoshida and T. Soldati (2006). Dissection of amoeboid movement into two mechanically distinct modes. J. Cell. Sci., 119(Pt 18):3833–44.
- [88] P. Friedl and E. B. Brocker (2000). The biology of cell locomotion within three-dimensional extracellular matrix. Cell Mol. Life Sci., 57(1):41–64.
- [89] P. Friedl, S. Borgmann, and E. B. Brocker (2001). Amoeboid leukocyte crawling through extracellular matrix: lessons from the Dictyostelium paradigm of cell movement. J. Leukoc. Biol., 70(4):491–509.
- [90] C. C. Cunningham (1995). Actin polymerization and intracellular solvent flow in cell surface blebbing. J. Cell Biol., 129(6):1589–99.
- [91] E. Paluch, C. Sykes, J. Prost, and M. Bornens (2006). Dynamic modes of the cortical actomyosin gel during cell locomotion and division. Trends Cell Biol., 16(1):5–10.
- [92] D. K. Bhalla, T. Murakami, and R. L. Owen (1981). Microcirculation of intestinal lymphoid follicles in rat Peyer’s patches. Gastroenterology, 81(3):481–91.
- [93] O. Ohtani, Y. Ohtani, C. J. Carati, and B. J. Gannon (2003). Fluid and cellular pathways of rat lymph nodes in relation to lymphatic labyrinths and Aquaporin-1 expression. Arch. Histol. Cytol., 66(3):261–72.
- [94] M. Halleraker, C. M. Press, and T. Landsverk (1994). Development and cell phenotypes in primary follicles of foetal sheep lymph nodes. Cell. Tissue Res., 275(1):51–62.
- [95] N. Kasajima-Akatsuka and K. Maeda (2006). Development, maturation and subsequent activation of follicular dendritic cells (FDC): immunohistochemical observation of human fetal and adult lymph nodes. Histochem. Cell. Biol., pages 1–13.
- [96] R. Yoshida, M. Nagira, M. Kitaura, N. Imagawa, T. Imai, and O. Yoshie (1998). Secondary lymphoid-tissue chemokine is a functional ligand for the CC chemokine receptor CCR7. J. Biol. Chem., 273(12):7118–22.
- [97] F. Lin, C. M. Nguyen, S. J. Wang, W. Saadi, S. P. Gross, and N. L. Jeon (2004). Effective neutrophil chemotaxis is strongly influenced by mean IL-8 concentration. Biochem. Biophys. Res. Commun., 319(2):576–81.
- [98] A. J. Pelletier, L. J. van der Laan, P. Hildbrand, M. A. Siani, D. A. Thompson, P. E. Dawson, B. E. Torbett, and D. R. Salomon (2000). Presentation of chemokine SDF-1 alpha by fibronectin mediates directed migration of T cells. Blood, 96(8):2682–90.
- [99] H. Slimani, N. Charnaux, E. Mbemba, L. Saffar, R. Vassy, C. Vita, and L. Gattegno (2003). Binding of the CC-chemokine RANTES to syndecan-1 and syndecan-4 expressed on HeLa cells. Glycobiology, 13(9):623–34.
- [100] K. Willimann, D. F. Legler, M. Loetscher, R. S. Roos, M. B. Delgado, I. Clark-Lewis, M. Baggiolini, and B. Moser (1998). The chemokine SLC is expressed in T cell areas of lymph nodes and mucosal lymphoid tissues and attracts activated T cells via CCR7. Eur. J. Immunol., 28(6):2025–34.
- [101] T. Okada, V. N. Ngo, E. H. Ekland, R. Forster, M. Lipp, D. R. Littman, and J. G. Cyster (2002). Chemokine requirements for B cell entry to lymph nodes and Peyer’s patches. J. Exp. Med., 196(1):65–75.
- [102] A. Bar-Even, J. Paulsson, N. Maheshri, M. Carmi, E. O’Shea, Y. Pilpel, and N. Barkai (2006). Noise in protein expression scales with natural protein abundance. Nat. Genet., 38:636–43.
- [103] J. L. Vissers, F. C. Hartgers, E. Lindhout, C. G. Figdor, and G. J. Adema (2001). BLC (CXCL13) is expressed by different dendritic cell subsets in vitro and in vivo. Eur. J. Immunol., 31(5):1544–9.
-
[104]
W.-S. Hu.
Stoichiometry and kinetics of cell growth and product formation.
URL http://hugroup.cems.umn.edu/Cell_Technology/cd-rom/Stoichiometry%20and%20Kinetics/Stoichiometry%20and%20Cell%20Kinetics.pdf