Senescence Can Explain Microbial Persistence
Abstract
It has been known for many years that small fractions of persister cells resist killing in many bacterial colony-antimicrobial confrontations. These persisters are not believed to be mutants. Rather it has been hypothesized that they are phenotypic variants. Current models allow cells to switch in and out of the persister phenotype. Here we suggest a different explanation, namely senescence, for persister formation. Using a mathematical model including age structure, we show that senescence provides a natural explanation for persister-related phenomena including the observations that persister fraction depends on growth phase in batch culture and dilution rate in continuous culture.
aDepartment of Mathematical Sciences, Montana State University,
Bozeman, MT 59717
bCenter for Biofilm Engineering, Montana State University, Bozeman, MT
59717
cSchool of Pharmacy and Pharmaceutical Sciences, University
of Manchester, Manchester, UK
dDepartment of Mathematics, Southern Methodist University,
Dallas, TX 75205
eDepartment of Chemical and Biological Engineering, Montana State University, Bozeman, MT 59717.
Corresponding author: Isaac Klapper, Department of Mathematical
Sciences, Montana State University, Bozeman, MT 59717. Tel. (406)-994-5231.
Fax. (406)-994-1789. email: klapper@math.montana.edu.
persisters senescence batch culture continuous culture
1 Introduction
It has been observed (Balaban et al., 2004; Bigger, 1944; Gilbert et al., 1990; Greenwood and O’Grady, 1970; Keren et al., 2004; McDermott, 1958; Moyed and Bertrand, 1983; Sufya et al., 2003; Haarison et al., 2005; Wiuff et al., 2005), dating to Bigger (1944), that many antimicrobials while effective in reducing bacterial populations are unable to eliminate them entirely, even with prolonged exposure. The surviving cells, called persisters, may be small in number – Bigger (1944) reported less than 100 persisters out of cells of Staphylococcus pyogenes after exposure to penicillin in some cases for example – but nevertheless are subsequently able upon removal of the challenging agent to repopulate. See Lewis (2001) for a general discussion. This phenomonon has recently gained increased attention in the context of biofilms (Spoering and Lewis, 2001) where the persisting cells have the added protection of a polymeric matrix, making them particularly dangerous (see, e.g., models of Roberts and Stewart, 2004, 2005). The protection of microbial populations by persisters, whether formed by senescence or some other mechanism, is expected to be enhanced in biofilms because of the propensity of biofilms to harbor slow-growing or non-growing cells.
Persisters have a number of interesting characteristics:
-
•
Upon reculturing, persister cells enable repopulation. See, for example, Balaban et al. (2004).
-
•
Persisters do not pass their tolerance to their progeny, and progeny do not inherit any greater tendency to be persisters. That is, persisters do not appear to be genetic variants. See for example Keren et al. (2003) and Balaban et al. (2004).
-
•
It is observed that persister cells apparently grow slowly or not at all in the presence of antimicrobial. See for example Balaban et al. (2004).
-
•
Persister cells demonstrate resistance upon exposure to multiple anti-microbial agents. That is, persister cells with respect to one antimicrobial agent can also be resistant upon exposure to different antimicrobial agents. As an example see Sufya et al. (2003), where survivors (from an E. coli batch culture) of a tetracycline challenge were also tolerant to ciprofloxacin and quaternary ammonium compound.
-
•
Bacterial cultures demonstrate biphasic killing patterns in response to antimicrobial challenge. It has been suggested that this plateauing is a consequence of the presence of persisters. See for example Balaban et al. (2004).
-
•
In continuous culture experiments, persister fractions are observed to increase with decreasing dilution rates, see Sufya et al. (2003).
-
•
All other things being equal, a culture with an initially richer growth medium will produce more persisters, see for example Bigger (1944).
-
•
One of the more puzzling observations is that changes in the population fraction of persister cells are growth-phase dependent – generally, though not always, population increases do not occur until the later stages of the log phase or even until the stationary phase. For example, Keren et al. (2004) observed an increasing ratio of persister to total cell numbers over time in E. coli, P. aeruginosa, and S. aureus batch cultures. In Balaban et al. (2004) the authors went as far as to posit that differences in onset of persister cell increases between different strains of E. coli imply the existence of more than one type of persister.
It been suggested that that persistence is a phenotypic phenomenon, (e.g. Balaban et al. 2004; Cogan, 2006; Roberts and Stewart, 2005). These references propose models in which cells are able to switch in and out of a protected, slow- or non-growing persister state with probablilities that are dependent possibly on environmental conditions. In this paper, based on observations of microbial senescence (Ackerman et al., 2003; Barker and Walmsley, 1999; Mortimer and Johnston, 1959; Stewart et al., 2005), we instead propose an alternative simple mechanism that can explain all of the above mentioned properties.
We make only three essential assumptions:
-
1.
bacterial cells age,
-
2.
older cells are more resistant than younger cells to antimicrobial challenge, and
-
3.
growth manifests as production of new cells. That is, upon division one progenic cell inherits the effects of age while the other does not.
We thus regard older cells to be the persisters. In fact, one might well label senescent cells to be a separate persister phenotype (as opposed to a youthful phenotype) though we do not stress this interpretation.
The second assumption could be a consequence for example of decreased metabolic activity but the particular mechanism does not really matter for our results. (The genetic bases for senescence and persistence are just beginning to emerge; see for example Nystrom, 2005, Vásquez-Laslop et al., 2006, and Spoering et al., 2006.) In reference to the third assumption, we can interpret cell division as a new, youthful cell being born from an old one.
We make the following additional non-essential specific assumptions for definiteness:
-
4.
production rate of new cells decreases with age but remains greater than zero,
-
5.
cell death occurs at a constant rate, and
-
6.
a given concentration of applied antimicrobial will kill cells of sufficiently young age but will not affect older cells.
These extra assumptions matter in the details but do not affect the qualitative results that we report with the exception that a non-zero growth rate (in assumption 4) is necessary in order to enable persister cells to repopulate after antimicrobial application. For consistency with the notion of decreasing activity, we suppose that older cells grow more slowly than younger cells although this assumption is again not really necessary here; rather the focus is on senescence as a mechanism for resistance.
2 Persister Model
2.1 Functional forms
We define to be the size of the bacterial population between ages and at time , and to be the growth media concentration at time . Following observations reported by Stewart et al. (2005), we suppose that cells senesce at a linear rate in time; other functional forms of age increasing senescence could be used instead. In particular for a parameter that we will call the senescence time, we define , the media usage at time of cells between ages and , by
where is a first-order rate constant and is a base usage factor.
Similarly, we define , the new cells born at time from cells between ages and , by
where is a yield coefficient. Additionally, by assumption 5, the death rate takes the form
where is a death rate constant. Finally, functional forms for antimicrobial application will be made below.
We stress that these choices are made for simplicity and for consistency with available data from the literature. The only essential condition we require is that the applied antimicrobial agent exhibit less potency as cells age (see below). For example, age-dependence in and is unnecessary. Conversely, could be made functionally dependent, for example, on , or if so desired.
2.2 Age Structure
A mathematical description of age structure was first introduced in Lotka (1907), McKendrick (1926), and many such representations have been used since. Define to be the bacterial population density of age at time , and to be the amount of available media at time . The equation governing is then
| (1) |
where the term on the right-hand side reflects cell death. The death coefficient can be expected, in general, to depend on and . We suppress such dependence here for simplicity as it does not affect our results in a qualitative way.
Equation (1) is valid for . To obtain an equation for , i.e., the new cells at time , we observe that such cells are “born” at time from the existing population , . For example, the subpopulation of cells between ages and produces new cells. Summing then over the entire existing population at time , we obtain
| (2) |
A similar equation applies for the media concentration:
| (3) |
Equations (1)-(3) are supplemented by initial conditions for some supplied function , and for some supplied constant . For discussion of mathematical issues involved in age-differentiated systems such as the one considered here, see e.g. Cushing (1998), Webb (1985).
We can write where
( is the senescence factor) and so define a senescence-weighted total bacteria population
| (4) | |||||
| (5) | |||||
| (6) |
with initial conditions , . In the computations to follow we use kg/m3 and
With this choice, the total initial population is cfu distributed linearly in age over the age interval .
2.3 Antimicrobial Application
We include the effect of applied antimicrobial consistently with assumption 6: a given antimicrobial concentration applied at time to the bacteria population results in killing at rate of sufficiently young (and hence susceptible) cells and does not effect older (and hence tolerant) cells. We assume for definiteness and consistency with our senescence assumption that tolerance age increases linearly with antimicrobial concentration. Other choices of age dependence, as long as they are monotone in age, can be made.
Then equation (4) is replaced by
| (7) |
where the rate is defined to be
| (8) |
Here is an adjustable tolerance coefficient. For a given antimicrobial concentration , small means that cells become resistant at a relatively young age, and large means that cells become resistant at a relatively old age. For numerical reasons, we slightly smooth the discontinuity in in the results reported below.
Based on (8) then, for a given antimicrobial concentration , cells of age or greater are designated as persisters.
2.4 Chemostat Model
2.5 Parameters
The model we describe contains seven parameters , , , , , , and (plus two, and for the chemostat), see Table 1.
| Table 1: Variables and Parameters | ||
|---|---|---|
| weighted population at time | cfu | |
| population per age at age and time | cfu/hr | |
| reservoir substrate concentration | kg/m3 | |
| substrate concentration at time | kg/m3 | |
| antimicrobial dosage | kg/m3 | |
| senescence factor | - | |
| substrate usage rate | hrcfu-1 | |
| cell yield coefficient | cfum3/kg | |
| cell killing rate | hr-1 | |
| tolerance coefficient | hrm3/kg | |
| senescence time | hr | |
| nominal cell death rate | hr-1 | |
| chemostat dilution rate | hr-1 | |
| minimum substrate usage factor | - | |
In fact, the only essential constraints on these parameters necessary for the results we report are that , i.e., the antimicrobial killing rate is greater than the cell death rate, that , i.e., cells become more tolerant with age, and that so that persister cells are capable of repopulation. We set the parameter values as follows:
-
•
Growth and substrate usage parameters: for definiteness, we set the length of the log phase to be approximately 10 hr and the bacteria doubling time to be approximately 0.75 hr, resulting in approximately 13.3 doublings in the log phase. Given an initial value of cfu, we thus obtain approximately cfu at the end of the log phase. These constraints require and (in units as in Table 1). We set kg/m3 as a reasonable value for initial media concentration, and then use hr-1cfu-1, cfum3/kg. (Roughly speaking, fixes the population at the end of the log phase and determines the length of the log phase via the doubling time.) The minimum substrate usage parameter is presumed to be small compared to 1, and needs to be larger than zero in order for persister cells to repopulate. Otherwise its value is unimportant. We set . The value of the cell death rate is unimportant as well (and could even be set to zero). We use hr-1.
-
•
Senescence parameter: Supposing significant senescence after about 16 generations (Stewart et al. (2005) reports 1-2% per generation) with a cell division time of 0.75 hr, we then obtain hr.
-
•
Antimicrobial parameters (except ): As a typical antimicrobial dosage, we use kg/m3. As a typical antimicrobial killing rate, we use hr-1.
-
•
Chemostat parameters: we allow , the dilution rate, to vary. The other parameter, reservoir concentration , does not affect our results so is arbitrary.
The only important quantity without an estimate is the onset age at which bacteria become resistant to the antimicrobial (see equation (8)). We assume that the onset age be equal to , the senescence time, and thus hrm3/kg. Increasing (decreasing) has the effect of increasing (decreasing) the onset age.
2.6 Numerical Methods
Equation (7) along with (5), (6) are solved numerically. We use a moving-grid Galerkin method in age with discontinuous piecewise linear functions post-processed to cubic splines for the approximation space in age (Ayati and Dupont, 2002). We use a step-doubling method in time, Ayati and Dupont (2005). This combination was illustrated in Section 5, Ayati and Dupont (2002), using the same code as used for this paper.
3 Results
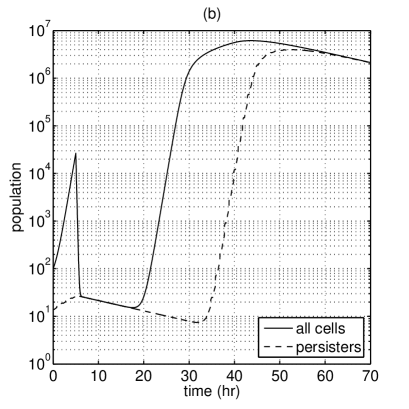
In Figure 1 we apply antimicrobial to a stationary phase culture, Fig. 1(a), and to a log phase culture, Fig. 1(b), and then “reculture” afterwards by removing the antimicrobial and adding fresh medium. Note the biphasic survival in each case: there is an initial sharp die-off immediately after antimicrobial application followed by a second phase of die-off of older (persister) cells due to natural causes. We also note that the number of persisters in this example does not grow substantially until the stationary phase – this is a consequence of the delay between birth of new cells in the log phase and aging of those cells into persisters. That delay time depends on , our only free coefficient. Small results in short delay in the generation of persisters (i.e., growth in persister numbers even in the log phase) while large results in long delay in the generation of persisters. The growth at early times in persister numbers seen in both Fig. 1(a) and Fig. 1(b) is solely a consequence of our initial age distribution in the innoculum. Note for example that persister numbers actually decline during the second log phase in both Fig. 1(a) and Fig. 1(b).

In Figure 2 we present a computational version of the persister elimination experiment conducted in Keren et al. (2004), see Figure 4 of that reference, qualitatively matching the results reported there. These authors observed that persister numbers could be driven downwards by frequent reculturing. In addition to serving as a comparison test of the persistence model to experiment, our (computer) experiment serves to further emphasize the point that the senescence mechanism presented here reproduces observational evidence that persisters are not formed in early log phase, and that by suppressing production of senescent cells, it is possible to suppress persister frequency as in Kener et al. (2004).
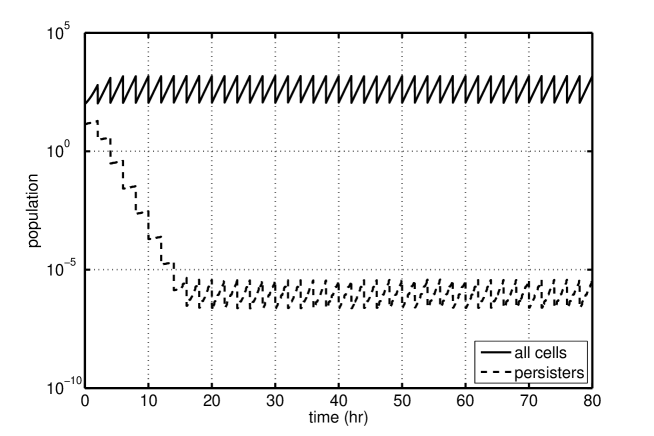
In fact, the persister elimination experiment illustrated in Fig. 2 might be considered as an approximation to a chemostat with roughly 2 hour turnover. So we also consider persister numbers in the chemostat system (9)-(11) at steady state (see Sufya et al., 2003). In particular, by setting in (9) and suppressing dependence, we obtain
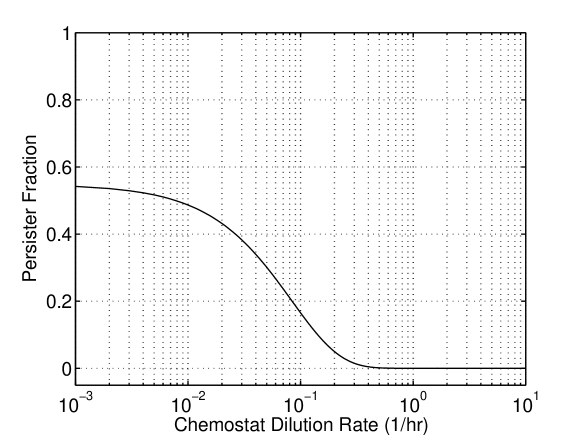
Thus the persister population fraction is given by
see Figure 3. We again note the qualitative match to the experimentally reported results in Sufya et al. (2003). In particular, note the rapid transition from high to low persister fraction separating the two regimes smaller than and larger than the persister age . For small , i.e., slow dilution, persister fraction tends to a constant controlled by , namely for the parameter values used here. For large , i.e., fast dilution, persister fraction tends to zero. We remark that this characterization of persister fraction with respect to dilution rate, see Fig. 3, is independent of the details of substrate usage. That is, it is independent of equations (10) and (11). It is also independent of the form of the senescence factor. We note though that at sufficiently high dilution rate, washout of cells exceeds the maximum specific growth rate and thus the biomass concentration, including persisters, becomes zero in steady state.
4 Discussion
The explanation of persistence as a symptom of senescence is an attractive one. Tolerance (or resistance) due to age, possibly because of reduced metabolic activity, explains in a simple manner the persister characteristics listed in the Introduction:
-
•
Offspring of old cells are of course young, and able to quickly repopulate.
-
•
Offspring of old cells are young and metabolically active cells, and hence do not inherit low activity tolerance, i.e., are not themselves persisters.
-
•
Old cells grow slowly.
-
•
Metabolic activity is independent of choice of antimicrobial agent so that metabolically inactive cells can demonstrate resistance to multiple agents.
-
•
In the presence of an antimicrobial agent, non-persisters are killed quickly followed by slow die-off of persisters, i.e., biphasic behavior occurs.
-
•
Decreasing the dilution rate in a continuous culture allows more cells to age longer before washout, hence increasing the persister fraction.
-
•
Increasing the amount of initial growth medium allows more new cells to be generated and hence, once these new cells have aged, more persisters.
-
•
Increase in persister numbers can appear to depend on growth phase. In particular new cells are, obviously, young cells and so log phase growth does not affect persister numbers until enough time has passed for those new cells to age sufficiently. Hence persister numbers do not significantly increase until later in the log phase or even the stationary phase (and may actually decrease before).
All of these observations are qualitative properties of our model depending on assumptions (1)-(3) and, we believe, essentially independent of the particular choices made in the other assumptions.
A number of authors have previously suggested persisters to be switching phenotypic variants (e.g. Balaban et al., 2004, Cogan, 2006, Kussell et al., 2005, Roberts and Stewart, 2005, Sufya et al., 2005, Wiuff et al., 2005), that is, that persisters are cells with the same genome but with different sets of genetic expression as “normal” cells, and that a given cell can switch back and forth between the two states. The resulting phenotype switching model consists then of cells transiting between persister and non-persister phenotypes. Available data does not distinguish between the alternative persister explanations of senescence and phenotypic switching. However, phenotype switching models require transitions between phenotypes to be growth phase dependent in order to explain phase dependence of persister numbers – persisters are more abundant in late stationary phase than in earlier stages. Hence, it becomes necessary to introduce stage-dependent transition rates, perhaps by making those rates nutrient dependent. Further, observations indicate that persistence in a given colony is antimicrobial dependent, that is, the number of surviving persister cells can depend on the choice of antimicrobial. Thus a phenotype switching model would seem to require a special parameter set (indicating, possibly, a special persister) for each distinguished antimicrobial. On the other hand, the senescence model can handle this issue simply by allowing for different antimicrobials to be effective up until different levels of senescence, amounting in our presentation to making the parameter be antimicrobial dependent. So, while we are unable yet to distinguish between phenotypic and senescent explanations of persisters based on available data, we can argue that the mechanism of senescence provides a simpler explanation at least with regards to the phenomenon discussed in this paragraph.
We remark in conclusion that since (i) the segregation of chromosomes between mother and daughter cell is non-random and favors the parent with respect to the original rather than the copy strand, and (ii) mutations accumulate with successive replications of the chromosome then senescence/persistence/conservation of the older cells, particularly at times of antimicrobial stress, will ensure that following catastrophic stress of a population, repopulation will be from older, demonstrably successful “archive” cells. This would avoid evolutionary dog-legs and possible extinction. Furthermore, consequent reliance upon the younger, mutation-prone cells to populate the community would increase the chance of adventitous genotypes being available in times of stress, whilst maintaining the “fall-back” position of reincarnation for the archived persisters.
5 Acknowledgements
I.K., J.D., and P.S. would like to acknowledge support from NIH award 5R01GM67245. I.K. and B.A. would like to thank IPAM, where much of this work was conducted, for its hospitality.
6 Bibliography
Ackerman, M., Stearns, S.C., Jenal, U., 2003.
Senescence in a bacterium with asymmetric division,
Science, 300 1920.
Ayati, B.P., Dupont, T.F., 2002.
Galerkin methods in age and space for a
population model with nonlinear diffusion,
SIAM J. Numer. Anal., 40 1064-1076.
Ayati, B.P., Dupont, T.F., 2005.
Convergence of a step-doubling Galerkin
method for parabolic problems,
Math. Comp., 74 1053-1065.
Balaban, N.Q., Merrin, J., Chait, R., Kowalik, L., Leibler, S., 2004.
Bacterial persistence as a phenotypic switch,
Science, 305 1622-1625.
Barker, M.G., Walmsley, R.M., 1999.
Replicative ageing in the fission yeast Schizosaccharomyces pombe,
Yeast, 15 1511-1518.
Bigger, J.W., 1944.
Lancet, ii:497-500.
Cogan, N.G., 2006.
Effects of persister formation on bacterial response to dosing,
J. Theor. Biol., 3 694-703.
Cushing, J.M., 1998. An Introduction to Structured Population Dynamics,
SIAM, Philadelphia.
Gilbert, P., Collier, P.J., Brown, M.R.W., 1990.
Influence of growth rate on susceptibility to antimicrobial agents:
biofilms, cell cycle, dormancy, and stringent response,
Antimicrob. Agents Chemother., 34 1865-1868.
Greenwood, D., O’Grady, F., 1970.
Trimodal response of Escherichia coli and Proteus Mirabilis
to penicillins,
Nature, 228 457-458.
Harrison, J.J., Ceri, H., Roper, N.J., Badry, E.A., Sproule, K.M., Turner, R.J., 2005, Persister cells mediate tolerance to metal oxyanions in Escherichia coli, Microbiology, 151 3181-3195.
Keren, I., Shah, D., Spoering, A., Kaldalu, N., Lewis, K. (2004)
Specialized persister cells and the mechanism of multidrug
tolerance in Escherichia coli,
J. Bacteriol., 186 8172-8180.
Kussell, E., Kishony, R., Balaban, N.Q., Leibler, S. (2005)
Bacterial persistence: a model of survival in changing environments,
Genetics, 169 1807-1814.
Lewis, K., 2001.
Riddle of biofilm resistance,
Antimicrob. Agents Chemother., 45 999-1007.
Lotka, A.J., 1907.
Studies on the mode of growth of material aggregates,
American J. Science, 24 141-158.
McDermott, W., 1958.
Microbial Persistence,
Yale J. Biol. Med., 30 257-291.
McKendrick, A.G., 1926.
Applications of mathematics to medical problems,
Proc. Edin. Math. Soc., 44 98-130.
Mortimer, R.K., Johnston, J.R., 1959.
Life span of individual yeast cells,
Nature, 183 1751-1752.
Moyed, H.S., Bertrand, K.P., 1983.
hipA, a newly recognized gene of Escherichia coli K-12
that affects frequency of persistence after inhibition of murein synthesis,
J. Bacteriol., 155 768-775.
Nystrom, T. 2005.
Bacterial senescence, programmed death, and premeditated
sterility. ASM News, 71 363-369.
Roberts, M.E., Stewart, P.S., 2004.
Modeling antibiotic tolerance in biofilms by accounting for nutrient limitation,
Antimicrob. Agents Chemother., 48 48-52.
Roberts, M.E., Stewart, P.S., 2005.
Modelling protection from antimicrobial agents in biofilms
through the formation of persister cells,
Microbiology, 151 75-80.
Spoering, A.L., Lewis, K., 2001.
Biofilms and planktonic cells of Pseudomonas aeruginosa
have similar resistance to killing by antimicrobials,
J. Bacteriol., 183 6746-6751.
Spoering, A.L., Vulic, M., Lewis, K., 2006.
GlpD and PlsB participate in
persister cell formation in Escherichia coli,
J. Bacteriol., 188 5136-5144.
Stewart, E.J., Madden, R., Paul, G., Taddei, F., 2005.
Aging and death in an organism that reproduces by morphologically
symmetric division,
PLoS Biology, 3 295-300 (2005).
Sufya, N., Allison, D.G., Gilbert, P., 2003.
Clonal variation in maximum specific growth rate and
susceptibility towards antimicrobials,
J. Appl. Microbiol. 95, 1261-1267.
Vázquez-Laslop, N., Lee, H., Neyfakh, A., 2006. Increased persistence in Escherichia coli caused by controlled expression of toxins and other unrelated proteins. J. Bacteriol., 188 3493-3497.
Wiuff, C., Zappala, R.M., Regoes, R.R., Garner, K.N., Baquero, F.,
Levin, B.R., 2005.
Phenotypic tolerance: antibiotic enrichment of noninherited
resistance in bacterial populations,
Antimicrob. Agents Chemother., 49 1483-1494.
Webb, G.F., 1985. Theory of Nonlinear Age-Dependent Population Dynamics,
Marcel Dekker, Inc., New York.