Sequence sensitivity of breathing dynamics in heteropolymer DNA
Abstract
We study the fluctuation dynamics of localized denaturation bubbles in heteropolymer DNA with a master equation and complementary stochastic simulation based on novel DNA stability data. A significant dependence of opening probability and waiting time between bubble events on the local DNA sequence is revealed and quantified for a biological sequence of the T7 bacteriophage. Quantitative agreement with data from fluorescence correlation spectroscopy (FCS) is demonstrated.
pacs:
05.40.-a,82.37.-j,87.15.-v,02.50.-rThe biological function of DNA largely relies on its physical properties: Protein binding is sensitive to local DNA structure alberts , DNA looping facilitates the search of binding proteins for their specific site michael , and DNA knots impair transcription or act as barriers between different genome regions knots . Similarly, local denaturation of DNA is necessary for protein binding to DNA single-strand mark ; mark1 ; tobias , and is implicated in transcription initiation kalo ; yeramian . DNA melting has a long tradition in statistical physics poland . Its biological relevance is due to the fact that the free energy for breaking a single base pair (bp) at physiological temperature is blake ; FK . Renewed interest in DNA melting, from a physics perspective is nourished by the possibility to measure the fluctuation dynamics of local denaturation bubbles by single molecule FCS oleg .
We present a master equation (ME) and complementary stochastic simulation, that provides the time series of the bubble fluctuations. A full two-variable formulation in terms of bubble size and left fork location allows to investigate an arbitrary sequence of bps, beyond previous homopolymer tobias and random energy models hwa . In certain limits, the ME can be solved analytically. We employ DNA stability data from a novel approach measuring the ten stacking interactions separately and, inter alia predicting a distinct asymmetry between AT/AT and AT/TA nearest neighbour bps FK . As proved on recent FCS experimental data our model describes well the bubble dynamics with only one free parameter. We demonstrate the delicate sensitivity of bubble dynamics to the local sequence of heterogeneous DNA on the promoter sequence of the T7 bacteriophage, and illustrate good potential for nanosensor applications.
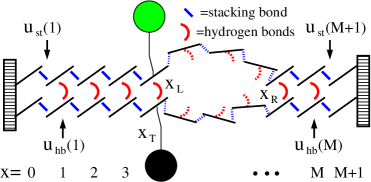
Model. With typical experimental setups oleg in mind, we consider a segment of double-stranded DNA with internal bps, that are clamped at both ends (Fig. 1). The full sequence of bps enters via the position-dependence of the statistical weights for breaking the hydrogen-bonds of the bp at position , and for disrupting the stacking interactions between bps and . Due to the high free energy barrier for bubble initiation (), opening and merging of multiple bubbles are rare events, such that a one-bubble description is appropriate. The positions and of the zipper forks correspond to the right- and leftmost closed bp of the bubble. and are stochastic variables, whose time evolution in the energy landscape defined by the partition factor ()
| (1) |
characterizes the bubble dynamics. is written in terms of and bubble size , with . Here, , where is the ring factor for bubble initiation from Ref. FK that is related to the cooperativity parameter poland ; blake by FK . For the entropy loss on forming a closed polymer loop we assign the factor blake ; fixman and take for the critical exponent richard . Note that a bubble with open bps requires breaking of hydrogen bonds and stacking interactions.
The zipper forks move stepwise with rates . We define for bubble size decrease
| (2) |
for the two forks REM . The rate characterizes a single bp zipping. Its independence of corresponds to the view that bp closure requires the diffusional encounter of the two bases and bond formation; as sterically AT and GC bps are very similar, should not significantly vary with bp stacking. is the only adjustable parameter of our model, and has to be determined from experiment or future MD simulations. The factor is introduced for consistency tobias . Bubble size increase is controlled by
| (3) |
for , where . Finally, bubble initiation and annihilation from and to the zero-bubble ground state, occur with rates
| (4) |
The rates fulfill detailed balance conditions. The annihilation rate is twice the zipping rate of a single fork, since the last open bp can close either from the left or right. Due to the clamping, and , ensured by reflecting conditions . The rates together with the boundary conditions fully determine the bubble dynamics.
In the FCS experiment fluorescence occurs if the bps in a -neighbourhood of the fluorophore position are open oleg . Measured fluorescence time series thus correspond to the stochastic variable , that takes the value 1 if at least all bps in are open, else it is 0. The time averaged () fluorescence autocorrelation
| (5) |
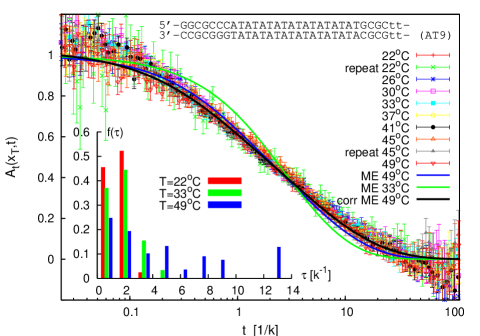
for the sequence AT9 from oleg are rescaled in Fig. 2 remm .
ME. DNA breathing is described by the probability distribution to find a bubble of size located at whose time evolution follows the ME . The transfer matrix incorporates the rates . Detailed balance guarantees equilibration toward , with tobias ; vankampen . The ME and the explicit construction of are discussed at length in Refs. tobias ; unp . Eigenmode analysis and matrix diagonalization produces all quantities of interest such as the ensemble averaged autocorrelation function
| (6) |
is proportional to the survival density that the bp is open at and that it was open initially tobias ; unp .
In Fig. 2 the blue curve shows the predicted behaviour of , calculated for C with the parameters from FK . As in the experiment we assumed that fluorophore and quencher attach to bps and , that both are required open to produce a fluorescence signal. From the scaling plot, we calibrate the zipping rate as s, in good agreement with the findings from Ref. oleg ; REM1 . The calculated behaviour reproduces the data within the error bars, while the model prediction at C shows more pronounced deviation. Potential causes are destabilizing effects of the fluorophore and quencher, and additional modes that broaden the decay of the autocorrelation. The latter is underlined by the fact that for lower temperatures the relaxation time distribution , defined by , becomes narrower (Fig. 2 inset). Deviations may also be associated with the correction for diffusional motion of the DNA construct, measured without quencher and neglecting contributions from internal dynamics oleg1 . Indeed, the black curve shown in Fig. 2 was obtained by a 3% reduction of the diffusion time REM2 ; see details in unp .
Stochastic simulation. Based on the rates , stochastic simulations give access to single bubble fluctuations suman ; unp . Our customized Gillespie algorithm uses the joint probability density of waiting time and path ,
| (7) |
defining for given state after what time the next step of fork occurs. The formulation via the waiting time density is economical computationally, avoiding a large number of unsuccessful opening attempts in traditional Langevin simulations. Using (7) we obtain the single bubble time series in Fig. 3.
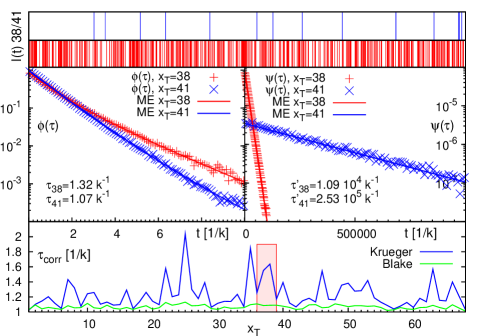
Phage T7 analysis. By ME and stochastic simulation we investigate the promoter sequence of the T7 phage,
| (8) |
whose TATA motif is marked red kalo . Fig. 3 shows the time series of at C for the tag positions in the core of TATA, and at the second GC bp after TATA: Bubble events occur much more frequently in TATA (AT/TA bps are particularly weak FK ). This is quantified by the density of waiting times in the state, whose characteristic time scale is more than an order of magnitude longer at . In contrast, we observe similar behaviour for the density in the state for and 41. Both and decay exponentially for long ; the overlaid lines represent numerical evaluation of the ME, see unp . As shown in the bottom for the parameters from FK , the variation of the mean correlation time obtained from the ME is small for the entire sequence, consistent with the low sequence sensitivity of . Note the even smaller variation predicted for the parameters of blake .
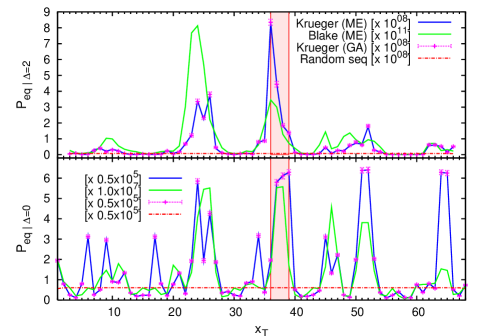
Fig. 4 shows the equilibrium probability that the bps are open, as necessary for fluorescence to occur. We plot data obtained from the zeroth mode of the ME together with the time average from the Gillespie algorithm (GA), finding excellent agreement. Whereas for several segments show increased tendency to opening, for the case , one major peak is observed; the data from FK coincide precisely with TATA, while the data from blake peak upstream. Also shown is a comparison to the opening probability of a random sequence demonstrating that the enhanced opening probability at TATA is significant, compare unp . Analysis for various indicate best discrimination of the TATA sequence being open for . For future FCS or energy transfer experiments, it therefore appears important to optimise the -dependence for best resolution, e.g., by adjusting the linker lengths of fluorophore and quencher NB .
Nanosensing. Fig. 5 shows the dependence of the mean correlation time of the AT9 sequence on salt concentration and . The variation with and is significant, pointing toward potential applications of DNA fluorescence constructs as nanosensors nanosens . The triangles denote the melting concentration of infinitely long random AT and GC stretches, respectively (see FK ). The maxima of the curves hallmark the critical slowing down of the autocorrelation at the phase transition point beyond which the bubble is preferentially open, see also bicout . Note that the maxima coincide with the melting concentrations in the bottom panel. The dashed line ( 2D) corresponds to the longest relaxation time obtained numerically from the ME; it agrees well with close to the maximum, analogously for the other . The horizontal line ( 1D) represents the longest relaxation time obtained from the homopolymer model of Ref. tobias in the limit , and (, length of the AT9 construct), with the same scaling as the first exit of unbiased diffusion.
Discussion. Previous bulk melting studies provided DNA stability data FK ; blake , on whose basis the relation between local sequence stability and coding properties of the associated genes was shown yeramian ; carlon . However, it is single molecule experiments that permit to study the dynamics of DNA denaturation and renaturation oleg . We here derive a physical framework for the opening and closing fluctuations of intermittent DNA bubbles in an arbitrary sequence of bps using the position of the two bubble zipper forks as fundamental coordinates. By comparison with previously unpublished FCS data we prove the predictive power of our model. As complementary approach based on the same (un)zipping rates, we introduced the stochastic Gillespie simulation, that provides the time series of single bubble fluctuations. The time averages from the stochastic simulation agree well with the ensemble properties derived from the ME. By its computationally attractive formulation based on the waiting time the Gillespie approach allows to include additional effects such as protein binding dynamics, or to consider longer chains and multibubble states. For a long homopolymer our model is analytically tractable tobias ; unp .
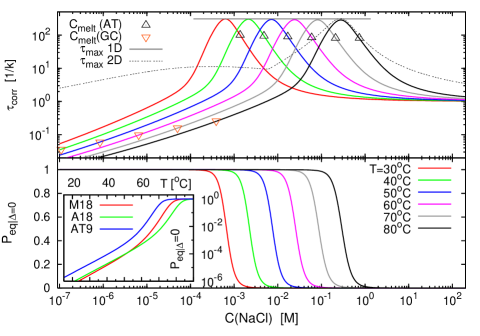
We used recent DNA stability data from FK based on separation of hydrogen bond and stacking energies, a distinct feature being the low stacking in a TA/AT stack, translating into a pronounced instability of the TATA motif, as shown for the T7 promoter sequence. The relevance of stacking interactions is also shown in the inset in Fig. 5 exhibiting pronouncedly different melting behaviour despite identical AT and GC contents for the constructs in oleg ; rusu . Regarding the biological relevance of TATA, from our analysis it may be speculated that it is not primarily the bubble lifetime (typically shorter than the timescale of protein conformational changes) but the recurrence frequency of bubble events that triggers the initiation of transcription. Note that typical binding energies of TATA binding proteins exceed the free energy to break up TATA, while both energies are comparable for a random sequence of the same length.
Given the high sensitivity of bubble dynamics to the stability parameters it should be of interest to employ FCS on designed DNA constructs to more accurately obtain stability data for different DNA structures and to calibrate the (un)zipping rates.
We thank G. Altan-Bonnet and A. Libchaber for sharing the data for Fig. 2, M. Frank-Kamenetskii for discussion and access to the new stability data prior to publication, and M. A. Lomholt and K. Splitorff for discussion.
References
- (1) B. Alberts et al, The molecular biology of the cell (Garland, New York, 1994).
- (2) M.A. Lomholt, T. Ambjörnsson, and R. Metzler, Phys. Rev. Lett. 95, 260603 (2005); G. Wuite (unpublished).
- (3) T. J. Pollock and H. A. Nash, J. Mol. Biol. 170, 1 (1983); P. Staczek and N. P. Higgins, Mol. Microb. 29, 1435 (1998).
- (4) K. Pant, R. L. Karpel, and M. C. Williams, J. Mol. Biol. 327, 571 (2003).
- (5) T. Ambjörnsson and R. Metzler, Phys. Rev. E 72, 030901(R) (2005); J. Phys. Cond. Mat. 17, S1841 (2005).
- (6) I.M. Sokolov, R. Metzler, K. Pant, and M.C. Williams, Biophys. J. 89, 895 (2005); Phys. Rev. E 72, 041102 (2005).
- (7) E. Yeramian, Gene 255, 139 (2000); ibid. p. 151.
- (8) C. H. Choi et al, Nucl. Acids Res. 32, 1584 (2004); G. Kalosakas et al, Europhys. Lett. 68, 127 (2004).
- (9) D. Poland and H.A. Scheraga, Theory of Helix-Coil Transitions in Biopolymers (Academic, New York, 1970); R.M.Wartell and A.S.Benight, Phys.Rep. 126, 67 (1985).
- (10) R. D. Blake et al., Bioinf. 15, 370 (1999); S. G. Delcourt and R.D. Blake, J. Biol. Chem. 266, 15160 (1991); J. SantaLucia Jr., Proc. Natl. Acad. Sci. 95, 1460 (1998).
- (11) A. Krueger, E. Protozanova, and M. D. Frank-Kamenetskii, Biophys. J. 90, 3091 (2006); E. Protozanova, P. Yakovchuk, and M. D. Frank-Kamenetskii, J. Mol. Biol. 342, 775 (2004).
- (12) G. Altan-Bonnet, A. Libchaber, and O. Krichevsky, Phys. Rev. Lett. 90, 138101 (2003).
- (13) T. Hwa et al, Proc. Natl. Acad. Sci. 100, 4411 (2003).
- (14) M. Fixman and J. J. Freire, Biopol. 16, 2693 (1997).
- (15) See C. Richard and A. J. Guttmann, J. Stat. Phys. 115, 925 (2004), and Refs. therein. The bubble dynamics is only marginally influenced by taking slightly above 2.
- (16) Due to intrachain coupling (e.g., Rouse), larger bubbles may involve an additional ‘hook factor’ tobias .
- (17) Except for Fig. 5, the parameters are for 100mM NaCl.
- (18) N. G. van Kampen, Stochastic Processes in Physics and Chemistry (North-Holland, Amsterdam, 1992).
- (19) T. Ambjörnsson et al. (unpublished).
- (20) Note that the zipping rate is the only free parameter in our model. Its value from the FCS studies is significantly lower than from NMR experiments (-/s, M. Guéron, M. Kochoyan, and J.-L. Leroy, Nature 328, 89 (1987)). The difference may stem from the higher temperatures and longer AT sequences probed in the FCS experiments. However, a perturbing effect of the fluorophore-quencher pair in the FCS approach cannot be excluded.
- (21) O. Krichevsky and G. Bonnet, Rep. Prog. Phys. 65, 251 (2002).
- (22) For diffusion time s measured for an RNA construct of comparable length in oleg1 .
- (23) S. K. Banik, T. Ambjörnsson, and R. Metzler, Europhys. Lett. 71, 852 (2005).
- (24) T. Ambjörnsson and R. Metzler, J. Phys. Cond. Mat. 17, S4305 (2005); J. Comp. Theor. Nanosc. 2, 389 (2005).
- (25) Note that, assuming a circular bubble of 5 open bps with bp-bp distance 3.4Å, the distance between fluorophore and quencher on bubble opening increases by 6.5Å, the same magnitude as the Förster transfer radius.
- (26) D. J. Bicout and E. Kats, Phys. Rev. E 70, 010902(R) (2004).
- (27) E. Carlon, M. L. Malki, and R. Blossey, Phys. Rev. Lett. 94, 178101 (2005).
- (28) We also found from our analysis of the FCS data from oleg that the M18 and A18 compounds with B’ domains of repeated AT bps show significantly different dynamics, similar to modified exchange rates of B’ in bulk data: C. Chen and I. M. Russu, Biophys. J. 87, 2545 (2004).