also CSDC and INFN, sez. Firenze. 22institutetext: Computer Laboratory, University of Cambridge, CB3 0FD Cambridge, UK.
The influence of risk perception in epidemics: a cellular agent model
Abstract
Our work stems from the consideration that the spreading of a disease is modulated by the individual’s perception of the infected neighborhood and his/her strategy to avoid being infected as well. We introduced a general “cellular agent” model that accounts for a hetereogeneous and variable network of connections. The probability of infection is assumed to depend on the perception that an individual has about the spreading of the disease in her local neighborhood and on broadcasting media. In the one-dimensional homogeneous case the model reduces to the DK one, while for long-range coupling the dynamics exhibits large fluctuations that may lead to the complete extinction of the disease.
1 Introduction
In “Les rois thaumaturges: étude sur le caractère surnaturel attribué à la puissance royale particulièrement en France et en Angleterre” the historian Marc Bloch [1] wrote that until about 1700, sick people in England and France tried to be touched by the king who they believed was a miraculous physician whose mere touch would cure physical illness. Since then, much time has passed, we do no more touch the king but we still have to face with illness and different pathologies. Now that we know viruses and bacteria, we are addressing the issue of studying the mutual influences between collective behaviour, disease spreading and viral evolution. In fact, HIV epidemics has changed many of our sexual and social behaviors [2] and selection on viral strains has been in act by social groups [3, 4]. Zanotto and collaborators [5] have shown that viral evolution depends on differences in modes of dispersal, propagation, and changes in the size of host populations. They also suggest a link between the growing and fluidity of the human population and its exposure to an expanding range of increasingly diverse viral strains.
Understanding the role of social behaviour has potentiality of giving better answers to the pressing public health questions about whether and how we can contain or slow the spread of an emerging epidemics to give time for vaccine development. Moreover, the understanding of key properties of contact networks may allow to reduce disease transmission, avoid both costly and time consuming universal vaccination or leaving hidden pockets of poor coverage that will seed again the epidemics.
Previous epidemiological models have investigated the effect of a wide variety of parameters, such as use of antiviral agents, super spreaders and individual variation [6], quarantine and pre-vaccination to contain the spread of disease at source. However, an outmost important factor that has been ignored so far is how the perception of the epidemics, as perceived from a neighborhood (short range information contacts) or from the media (long range), will change the diffusion parameters.
Here we concentrate on the study of the risk perception on disease spreading in the case of a homogeneous population. Although spatial variables can play a major role, it is important to study average statistical properties (mean field analysis) before taking into consideration more complex geometries. In general, populations do not experience full-mixing condition. However, well-stirred conditions are recovered whenever conditions of people crowdedness are considered or if it is possible to focus on a given scale of observation. Noteworthy the former conditions occur very frequently in urban contexts, for example in tubes and buses at peak times and aerial spreading of cold-related virus particles from coughing and sneezing disregards the casual contact. Other examples are children in a nursery who have large number of contacts during the day. On the other hand, we can concentrate on a homogeneous scale of observation if we study disease spreading in the hubs constituted by airports and train stations. Similarly, if we are interested in the interplay between cities and the countryside in disease evolution, we may address the problem considering the interaction between those two distinct entities, each characterized by homogeneous properties.
Different models for spreading of epidemics have been proposed, either considering homogeneous populations [7, 8], or in the framework of complex networks [9]. This kind of approach allows assessing the relative importance of local and long-range contacts not only in spreading the infection but also in spreading information on the infection risk and thus potentially stand as a very useful tool for public health managing and decision making processes.
The paper is organized as follows. In the next section we present a general cellular agent model for the study of the perceptive dynamics of a disease spreading. In section III we present the mean field approximation of the model, then we present the results of the performed simulations and finally we draw our conclusions.
2 The Model: partying with your neighbors or stay home, spy them and read the news?
We shall develop a quite general agent-based model, allowing age classes (progression of the illness) and different types of communication networks. We propose to use the term cellular agent for it, since it reduces to cellular automata for a regular lattice of connections, but connections may also change in time.
The single agent (representing an individual or a group of strongly connected individuals like a family) is implemented as a set of (directional) incoming connections, an internal state and an output state. Let us denote as the connection from site to site . In our model a connection represents the propensity of being infected, which is proportional to the fraction of time spent together by the two individuals and , but also depends on the type of contact. For this last reason, the connection needs not to be symmetric: while it may be true for friendly contacts, the risk of being infected is quite asymmetrical for professionals (nurses, physicians, etc.) and also for parents vs. children, and so on. In the simplest case of unweighted connection, , is the number of neighbors and 111We use the notation to indicate the truth function, which gives 1 if statement is true and 0 otherwise. is the number of infected neighbors. In the case of weighted connections, and are no more integers. The network of connections may be fixed, or evolving in time. The degree (or connectivity) of a node is defined as the number of the incoming/outcoming links, while the degree distributions of a network, , represents the fraction of nodes with degree . Many social networks have a scale-free structure [10], and this kind of networks can only be grown using a connection rule. So, it is natural to assume that new connections may be established, and old one removed, following a dynamical rule. Actually, one could work with a fully-connected network, and implement the evolution of connection as a rule for the intensities (possibly introducing a threshold value for the efficacy of a connection), but this would be quite expensive in computer terms. We limit the present investigations to fixed connection all of the same intensity.
We represent the internal state (progression of illness) of the individual as a bitstring . Each bit in (represented as a base-2 number) indicates the presence of a given strain. In this way we can account for the geographic distribution of different strains (important for immunization strategies), multiple infections (co-infection or delayed re-infection) and recombination among strains. To each possible value of is associated an infection probability (infectivity) , with . The internal state contains also a time counter, for timing the progression of the illness. In the present model, we simply assume that the individual becomes healthy after a certain interval from the last infection. We do not consider here immunization, nor the internal dynamics between infective pathogens and the immune system [11].
The output state indicate if an individual is infective, and if it is visibly ill. In this way we can represent incubation periods. In this first study, we assume that the illness become visible the unit of time (day) after infection, thus obtaining a parallel evolution.
We assume that the probability of infection is proportional to the frequency of contacts , but that it is also modulated by the individual’s perception of the percentage of infected people in her neighborhood as well as by the strategy for avoiding being infected. If an individual realizes that a large fraction of her neighbors is infected, or is alerted by broadcasting media, then she may change her habits. She may rise the level of precautions (thus lowering the effective infectivity of the illness) or alter her connection patterns. Since this last choice implies a large rearrangement of individual lifestyle, this dramatic change is assumed to take place only in extreme cases. However, even without changing lifestyle it is possible to lower the infection probability by simply taking elementary precautions. We assume this to be the most common reaction. Therefore we keep constant during the simulation, but make the infection probability of a single contact to vary according with the fraction of infected people among the neighbors (weighted with the connection strengths) and with the influence by media information. We also assume that the recovering is immediate, and that the individual becomes immediately susceptible.
The perception (information) about the disease is written as . The parameter modulates individual’s response to the the local infection load. The role of the intensity of the external fields, like public healths alerts and media influences, is accounted for by the parameter. In the following we assume , but it’s worth noting that this parameter can play a major role in scenarios of low perception of the risk of infection. This could be the case of infections characterized by a long-asymptomatic phase, in which many contacts occurs without the perception of any risk of being infected. In such scenarios, turns out to be the only mean to downregulate the spreading of the disease.
The microscopic infection process is the following: for all the contacts of the individual , the bitstring is OR-ed with , the bitstring representing the neighboring individual , if the contact is effective in propagating the infection. This happens with a probability .
The total infection probability is therefore
| (1) |
In the unweighted case, with single-valued connectivity, , and assuming the same infectivity for all strains, equation (1) becomes:
| (2) |
3 Results
3.1 One Dimensional Case
Here we consider the simplest case where defines a 1D regular lattice with (nearest neighbors), and where all the contacts have the same strength. The status of node is represented by a single bit, and the infectivity parameter, , is single valued.
This case can be mapped on the Domany-Kinzel model [12]. This latter is defined as a one-dimensional totalistic cellular automaton with , and its evolution rule depends on two parameters: , the probability becoming infected if only one of the neighbors is infected, and , the probability of being infected if both neighbors are infected. The correspondence with our model is therefore and .
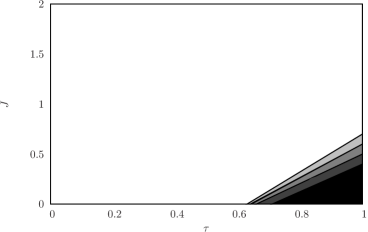
We have obtained the phase space () using the (,) parameters. The results are shown in Fig. 1. The model exhibits a continuous transition (second-order) from a healthy state to the complete infection, as the infectivity increases. As far as is subsequently increased over a threshold value, the infection can no longer subsist and the population recovers completely from the disease.
3.2 Long-range Case
3.2.1 Mean-field Approximation.
The average asymptotic behavior of networks can be investigated by means of mean field approach. Let us call number of nodes with connectivity ; , probability of a node with connectivity being connected to a node with connectivity ; : number of nodes with connectivity being infected; is the average frequency of contact between two individuals. If only one infective strain is considered, i.e. , the probability of being infected of a node with connectivity , , is given by:
| (3) | |||||
If a non assortative network is considered, i.e. :
| (4) |
and, if is fixed, i.e. and ,
| (5) |
3.2.2 Estimation of the infection reproductive rate.
A meaningful epidemiological parameter is the basic reproductive rate, , which is defined as the mean number of infections caused by an infected individual in a susceptible population [13, 6]. This parameter can be considered an epidemiological threshold. When , each person who contracts the disease will infect fewer than one person before dying or recovering, so the outbreak will cease. When , each person who gets the disease will infect more than one person, so the epidemic will spread.
A more careful investigation of this parameter can lead to a better insight in the dynamics of the epidemics, at the same time allowing to assess the efficacy of different strategies of containment on the spreading of the disease. For example Lloyd-Smith and colleagues have shown that the distribution of individual infectiousness around is often highly skewed [6]. Longini and collaborators have investigated bird flu pandemia scenarios. They found that if was below 1.60, a prepared response with targeted antivirals would have a high probability of containing the disease. If pre-vaccination occurred, then targeted antiviral prophylaxis could be effective for containing strains with an as high as 2.1. Combinations of targeted antiviral prophylaxis, pre-vaccination, and quarantine could contain strains with an R0 as high as 2.4 [13].
With reference to the model we propose, we can derive the expression of the basic reproductive ratio, by considering the variation of with respect to , when a small fraction of infected population is considered, i.e.
| (6) |
In this way we recover the expression of the basic reproductive ratio, when a unitary mean time of infectivity per individual is considered. From this we derive the critical value of J, below which the fraction of infected individuals is different from zero,
| (7) |
3.2.3 Numerical Simulations.
To better characterize the role of the mean connectivity of individuals (randomly chosen), we plot the value of the fraction of infected individuals, , as a function of , for different values of . In Fig.2 we report the results of the numerical simulations for the mean field approximation of the model, plot (a), and for the microscopic dynamics, plot(b).
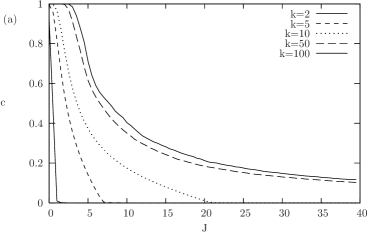
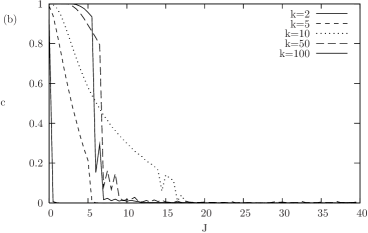
We can first notice that, for a growing number of neighbors, the fraction of infected individuals increases. This suggest that if we consider bounded the strength of the individual perception of the disease, an ever growing influence of the external field is necessary to keep low the number of infected individuals. By comparing the mean field model with the microscopic dynamics a good agreement is shown for small values of (depending on . For larger values of , the infected population exhibits large coherent oscillations, that may may lead to a complete recover from the infection and to the disappearing of the epidemics. In the mean field approximation, for increasing values of , the model begins to show a high variation in the fraction of infected individuals, without reaching extinction.
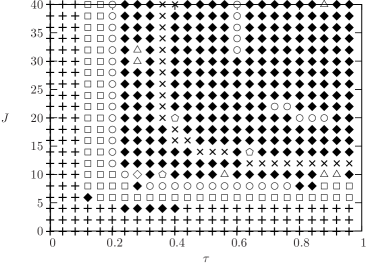
By keeping fixed the value of the mean connectivity and setting , we analyzed the mean-field phase space. In Fig.3, the case for is reported. It’s interesting to observe the rich dynamics exhibited by the model phase space, with oscillations and chaotic behavior.

4 Inching Towards Reality
As the amount of epidemiological data in the public domain grows, so does the range of social science topics that it influences through dynamical considerations. In recent years, a number of developments have enabled modeling methodology to keep pace. Aims of research that combine information from social sciences and biology/medicine are to setting policies to alarm, slow and contain a possible pandemic. For highly transmissible diseases policies may include social distancing deleted policies, nurseries and schools closure, transport and travel restrictions, as well as production and distribution of sufficient quantities of vaccine. The application of those policies will have great effect on the quality of life of the population, the job market and the economy. An example of this coupling is given by the fact that the lack of information from neighbors and media on the disease has the same effect of the disease incubation period i.e. the lack of symptoms when the virus is not demonstrable. Similarly a chronic disease, which represent a latent but infectious state, may reduce the level of surveillance as well as continuous media and neighborhood alarm. Viral diseases have different intrinsic biological characteristics which become coupled with different social and psychological behaviors of the neighborhood, generating a vast combinatorial of dynamics. Representative examples are acute diseases such as the common cold (rhinovirus) and influenza Yellow Fever; acute infection with rare late complications and virus not readily demonstrable such as measles and SSPE; latent persistent diseases where the virus is not readily demonstrable such as Herpes simplex, Varicella-zoster, Measles; chronic persistent diseases such as Hepatitis B, LCMV in Newborn Mice; chronic infection, late diseases such as HTLV-1 leukemia and HIV; finally, very slow infection such the prion responsible for the Creutzfeld-Jakob disease. The probability of contacts leading to infection can be calibrated against seasonal or environmental effects and total and age-specific illness attack rates of data in past pandemics. Age dependent distributions is important to take into account whether an infected person becomes ill or remains asymptomatic and, if symptomatic, when (if ever) the person withdraws to household-only contacts [14]. Glass and collaborators [15] found that heterogeneity in measles vaccination coverage can lead to an increased rate of infection among non-vaccinated individuals, with a simultaneous drop in the average age at infection. Note that since measles and pertussis are first world vaccine-preventable diseases, the public health problem in developing countries will affect the contact networks in a different ways from first world. A major factor is the correct identification of target age groups. Recent works show that pre-scholar children aged 3 to 4 drive influenza epidemics and are most strongly linked with mortality in the vulnerable groups (elderly) and general population than other children [16]. In fact they present flu-like respiratory illness as early as late September, while children aged 0-2 began arriving a week or two later and older children first arrived in October and adults began arriving only in November. This example points to the difference between high-risk individuals, for example babies under 24 months or the elderly, and those who are transmitting the disease to everyone else . The former should be vaccinated first [17]. The above examples show that the field is at the early stage and will benefit from an interdisciplinary approach and from a methodic and careful analysis of the contribution of each parameter.
References
- [1] M. Bloch, The Royal Touch: Monarchy and Miracles in France and England (Dorset Press, New York 1990).
- [2] Fredrik Liljeros, Christofer R. Edling, Luis A. Nunes Amaral Sexual networks: implications for the transmission of sexually transmitted. infections Microbes and Infection 5 (2003) 189–196
- [3] P. Schliekelman, C. Garner and M. Slatkin, Nature 411, 545 (2001).
- [4] J. Novembre, A.P. Galvani and M. Slatkin, PLoS Biol.3 339 (2005).
- [5] P.M. Zanotto, E.A. Gould, G.F. Gao, P.H. Harvey and E.C. Holmes, Population dynamics of flaviviruses revealed by molecular phylogenies, Proc. Natl. Acad. Sci. USA. 93, 548 (1996).
- [6] J.O. Lloyd-Smith, S. J. Schreiber, P. E. Kopp and W.M. Getz, Nature 438, 355 (2005).
- [7] J.D. Murray, Mathematical biology (Springer-Verlag, NY 2002).
- [8] R.M. Anderson and R.M. May, Infectious Diseases of Humans: Dynamics and Control (Oxford Univ. Press, Oxford, 1991).
- [9] R. Pastor-Satorras and A. Vespignani, Phys. Rev. Lett. 86, 3200 (2001); R. Pastor-Satorras and A. Vespignani, Phys. Rev. E 63, 066117 (2001). A. L. Lloyd and R.M. May, Science 292, 1316 (2001).
- [10] A.L. Barabasi and R. Albert, Science 286, 509 (1999); R. Albert and A.L. Barabasi, Rev. Mod. Phys. 74, 47 (2002); S. Boccaletti, V. Latora, Y. Moreno, M. Chavez and D.U. Hwang, Phys. Rep. 424, 175 (2006).
- [11] F. Bagnoli, P. Lió and L. Sguanci, Physica A, In Press, Corrected Proof, Available online 28 November 2005.
- [12] E. Domany and W. Kinzel, Phys. Rev. Lett. 53, 311 (1984).
- [13] I.M. Longini, A. Nizam, S. Xu, K. Ungchusak, W. Hanshaoworakul, D.A.T. Cummings and E.M. Halloran, Science 309, 1083 (2005).
- [14] T.C. Germann, K. Kadau, I.M. Longini, and C.A. Macken Proc. Natl. Acad. Sc. USA 103, 15 (2006)
- [15] K. Glass, K. Kappey and B.T. Grenfell Epidemiol Infect. 132, 675 (2004).
- [16] J.S. Brownstein, K.P. Kleinman and K.D. Mandl, Amer. J. Epidemiol. 162 686 (2005).
- [17] M.B. Aldous AAP Grand Rounds 15, 6 (2006).