Distribution of Bubble Lengths in DNA
Abstract
The distribution of bubble lengths in double-stranded DNA is presented for segments of varying guanine-cytosine (GC) content, obtained with Monte Carlo simulations using the Peyrard-Bishop-Dauxois model at 310 K. An analytical description of the obtained distribution in the whole regime investigated, i.e., up to bubble widths of the order of tens of nanometers, is available. We find that the decay lengths and characteristic exponents of this distribution show two distinct regimes as a function of GC content. The observed distribution is attributed to the anharmonic interactions within base-pairs. The results are discussed in the framework of the Poland-Scheraga and the Peyrard-Bishop (with linear instead of nonlinear stacking interaction) models.
pacs:
87.15.Ya, 87.15.Aa, 87.14.Gg, 87.15.HeFluctuating thermal openings of the double helix of DNA (bubbles) are known to exist in a regime extending well below the denaturation transition, which includes physiological temperatures. These openings could be exploited by regulatory proteins or functional enzymes to perform their work sobell . It has been recently suggested that there is an increased probability for large bubbles to appear at functionally relevant sites of gene promoter DNA segments NAR ; EPL . More accurate numerical calculations vanerp ; rapti have unadvertedly reinforced this idea comm , by finding an increased opening probability at functional binding sites of the promoter region upstream of a gene initiation site. Such a picture is in analogy to the functional role of fluctuations in proteins fenimore . This has led to an increased interest for equilibrium and dynamical studies of thermally induced bubbles in DNA.
In a different context, recent experiments on cyclization of short DNA fragments cloutier ; du have drawn attention toward the possibility that regions of very low rigidity may appear in double stranded DNA wiggins . It has been proposed yan ; ranjith that these bending kinks may be caused by the formation of denaturation bubbles, letting the higher flexibility of single stranded DNA explain the sharp bending observed in experiments cloutier . In this context, the question of how frequently denaturation bubbles arise is one of the keys for the understanding of this phenomenon.
Here we present the distribution of bubble lengths, for lengths ranging from 0.34 nm (single base-pair openings) up to a few tens of nanometers (corresponding to openings of size several tens of base-pairs). The bubble length distributions have been obtained with Monte Carlo simulations, using the Peyrard-Bishop-Dauxois (PBD) model DPB for describing the energy of base-pair openings. We discuss equilibrium distributions at K, averaged over DNA segments with total size of one thousand base-pairs. The bubble length distributions depend on the guanine-cytosine (GC) content, i.e., the fraction of GC base-pairs in the sequence. The variation of the distribution as a function of the GC content is investigated. Note that the size of a bubble is characterized by its length (width) and its amplitude. Here we fix a threshold for the amplitude and when a bubble of length base-pairs (or nm) is mentioned, it means that all the successive base-pairs have openings larger than the fixed amplitude threshold , while the limiting base-pairs (the first neighbors to the left and to the right of the stretch of the successive base-pairs) have smaller openings than that. Periodic boundary conditions are used, so our study considers only bubbles in the middle of a sequence, disregarding end effects. Fraying, i.e. the opening of the DNA molecule starting at one of its ends, is a very interesting problem that will be addressed elsewhere.
In this Letter we show that the bubble length distributions, obtained within the PBD model, follow a nonexponential law and, further, an analytical description (see Eq. (2) below) is available describing the observed, slower than exponential, decay with the length. This behavior has been quantified for various GC contents and remains qualitatively the same independently on the value of the fixed amplitude. The fact that the same distribution law is also predicted by the completely unrelated Poland-Scheraga poland model of DNA, strongly suggests that our findings are beyond theoretical speculation and might be a proper description of actual DNA physics.
In recent investigations, numerically exact equilibrium properties vanerp ; rapti and Langevin dynamics up to nanosecond time-scales averaged over several hundred realizations NAR ; EPL ; krastan have been achieved taking advantage of the efficiency of the simple PBD model for describing base-pair openings in double-stranded DNA. The PBD model coarse-grains the relatively rigid internal structure of the nucleotides and considers their anharmonic stretching interactions at the single base-pair level DPB ; DP ; nlinpeyr . Its accuracy has been demonstrated by several comparisons with different experiments CG ; NAR ; saul .
The potential energy of the PBD model is given by:
| (1) |
The sum is over all the base-pairs of the molecule and denotes the relative displacement from equilibrium at the base pair. The first term is an on-site Morse potential, representing the hydrogen bonds between bases in the same pair as well as other effective interactions between complementary nucleotides. The second term is an anharmonic coupling between adjacent base pairs that models the stacking interaction. The heterogeneity of the genetic sequence is taken into account giving different values to the parameters of the Morse potential for adenine-thymine (AT) or guanine-cytosine (GC) base pairs. The values of the parameters we have used params were fitted in Ref. CG to reproduce thermodynamic properties of DNA. The same parameters have been subsequently used, without additional fitting procedures, to successfully describe experimental observations NAR ; saul .
To study the statistics of bubbles we have performed Monte Carlo simulations of the PBD model using the same procedure introduced in Ref. saul . The Metropolis algorithm was used to produce equilibrium configurations of the molecule at K. Results were averaged, after proper thermalization, over several realizations (typically 25, each one consisting of Monte Carlo steps, which makes a total of steps) with different initial conditions. As we used quite large DNA sequences (containing 1000 base-pairs) and the temperature studied is well below the melting temperature, the probability that a complete melting occurred during the time of a simulation was so low that no melting events (that, for long enough simulations, would eventually take place for this model at any temperature DP ; zhang ) were observed. We show results for bubbles of amplitude equal or greater than Å. We have also studied bubbles of amplitude 0.5 Å, 3 Åand 5 Å, finding the same qualitative results presented here. We have checked that our results are independent of the length of the sequences studied, provided they are longer than the longest observed bubble and there is no complete melting.
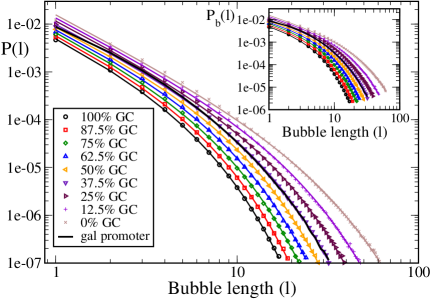
Figure 1 shows the bubble length distribution per base-pair, , obtained from our Monte Carlo simulations. This histogram is defined as , where N(l) is the averaged (during the Monte Carlo simulation) number of bubbles of length base pairs on a sequence of total size , and the average is over different realizations of an uncorrelated random sequence with a given GC content. The limit in the definition of has the meaning that the total size of the DNA segment should be sufficiently larger than the considered bubble lengths. Under this condition, the distribution should be interpreted as follows: for a given DNA sequence of total length base-pairs, the quantity gives the average number of occurrences of a bubble of length base-pairs, in thermal equilibrium.
From we obtain the probability that an individual base-pair forms part of a bubble of length as for , while the probability of not belonging to any bubble (i.e., that the base-pair has an opening smaller than ) is . From the definition of follows that , thus ensuring correct normalization of the probability .
As a check of our simulations, we have also computed for pure GC and AT sequences the probability of i) a single base-pair to have an opening larger than the considered fixed amplitude and ii) two neighboring base-pairs to simultaneously have openings larger than the fixed amplitude, using the transfer integral operator method ti1 ; ti2 ; bsg . The probabilities calculated in these two cases, using a different but numerically exact method, are in a very good agreement (up to numerical accuracy) with those obtained through the Monte Carlo simulation from the distributions , as and , respectively.
We find that the distributions per base-pair can be fitted in the whole range of bubble sizes studied stexp , with a single function of the form:
| (2) |
A fit with a stretched exponential function having a stretching exponent smaller than 1 is also accurate preprint , but we have preferred Eq. (2) because this functional form can be derived from existing theories both for a simplified version of the used model sung (the Peyrard-Bishop model, with linear stacking interactions comment ) and for the independent Poland-Scheraga model poland .
In order to investigate which interactions of those present in the model are responsible for the observed behavior of the distribution, we have performed similar calculations varying different terms of the potential of Eq.(Distribution of Bubble Lengths in DNA). When , i.e. the stacking interaction is linearized, the distribution remains nonexponential, although it is described by smaller , in complete agreement with previous studies sung . However, when the on-site Morse potential is linearized (substituting the Morse potential by its harmonic approximation), then the obtained distribution is exponential. This happens independently of setting or . Therefore, we infer that the nonlinear interactions between the bases within base-pairs result in the observed bubble length distribution. These anharmonic on-site interactions have been found to qualitatively affect other properties of the model as well charge . This kind of interaction appears also in modified models where the stacking interaction has a qualitatively different shape joyeux .
In Figure 1 is also shown, for sake of comparison, a result for a natural sequence; a segment from Escherichia coli’s gal promoter genbank , extending from the position (upstream) up to the site +91 (downstream) around the transcription start site of galE gene. This sequence has a GC fraction of 37.45%, and, as can be seen from Figure 1, its results are indistinguishable from those of a random sequence with almost the same GC content (37.5%). This is expected, as it is in agreement with the known fact univ that, despite statistical correlations in the sequence and local properties, equilibrium averaged physical properties of large DNA molecules are basically similar to those of random sequences.
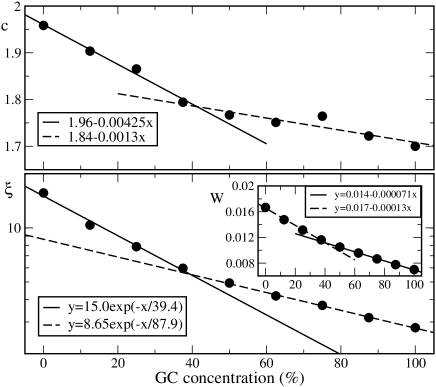
DNA molecules with higher GC content exhibit a faster decay (see Figure 1), as the stronger bound GC pairs make large bubbles less likely. The change of the distribution with the GC content is quantified in Figure 2, where the dependence of the parameters of Eq. (2) on the GC fraction is shown. All the parameters decrease monotonically with the GC percentage. The decay of signifies that the higher the GC content the more difficult it is to excite large openings in the double strand, therefore in AT rich sequences bubbles have a higher statistical weight. The decay length is smaller for GC-rich sequences, in which the distribution decays faster. The variation of all these parameters can be fitted by a bilinear or a biexponential function (see Figure 2), revealing two distinct regimes on the GC-fraction dependency: above and below a GC content of about 40%. Previous studies rapti have shown that the nucleation of bubbles depends strongly on the sequence: the weaker AT base-pairs have to go over the potential barrier imposed by their GC neighbors in order to break the bonds. Our findings suggest that for GC concentrations over 40%, the formation of bubbles is a GC-dominated process, as AT base pairs are not in average free to melt without GC opposition. But below 40% GC content, large AT regions are possible that form bubbles freely, hence dominating the bubble formation process.
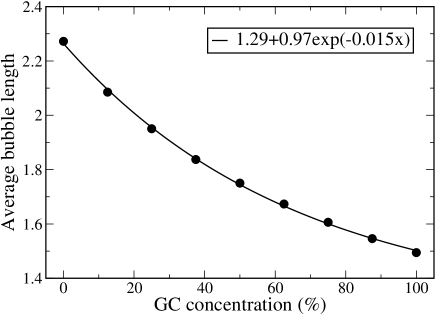
Figure 3 presents the average bubble length , which is given by the total number of base-pairs in bubble states divided by the total number of bubbles:
| (3) |
depends strongly on the GC content, showing an exponential decay. This stresses the importance the sequence has on the typical size of denaturation bubbles.
A recent work reports exponential decay of the bubble length probability krastan . Although this seems to contradict our present results, this is not the case because the study krastan considers only a restricted regime of lengths, extending from up to . Therefore, a restricted portion of the distribution may appear as a seemingly straight line in a semilogarithmic plot, indicating exponential decay. However, if one looks for either smaller () or larger lengths, below or above this regime, the exponential law fails. On the contrary the formula (2), or a stretched exponential law preprint , describes accurately the whole regime from up to several tens of base-pairs. This means that large bubbles are more probable than what it would have been implied by exponential decay. Earlier studies of a simplified version of the PBD model (using a linearized stacking interaction) have also shown a slower than exponential decay of the distribution function DPB2 ; sung .
Importantly, the Poland-Scheraga (PS) model of DNA melting predicts a bubble length distribution described by Eq.(2) coluzzi ; kafri ; baiesi . Hence our results establish a bridge between these two different theoretical approaches, which could help to future better understanding of the principles underlying the models, and henceforth a more effective modeling approach to DNA. In the PS model, the exponent has a very important physical meaning, as its value at the critical temperature (where diverges and the distribution is given by a pure power-law) indicates the order of the melting transition: for there is no phase transition, the transition is smooth for , second order for and first order for . It is interesting to characterize this exponent also for the PBD model; work in this direction is in progress and a detailed temperature dependence of bubble length distributions will be presented elsewhere us . Independently of the model, for the average bubble length remains finite as , and it diverges for , thus presenting a discontinuous or a continuous transition, respectively.
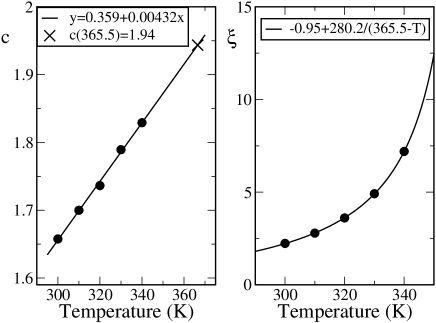
As an advance of our work in progress, in Figure 4 we depict a preliminary result for the exponent and the decay length obtained for pure GC sequences at different temperatures. As happens in the PS model coluzzi , also here the exponent increases linearly with temperature below the critical temperature. The PS model also predicts that diverges as coluzzi . Using this to fit the data, we obtain a value GC K, in agreement with transfer integral calculations we have performed. Hence the predicted value of the exponent at is (compatible with the value used in biological studies yeramian ): we would have a very sharp transition, but still not first order, if the PS scheme applies. But we have to be very careful: for AT at K, Figure 2 shows that . A transfer integral calculation yields AT K, so the exponent at is expected to be higher than 2. Work in this direction is necessary, but the possibility to speculate that not only the transition temperature but also the nature of the phase transition itself depends on the sequence, is too tempting to let it go. The role that the parameters of the model play in this has also to be carefully investigated. Interestingly, previous work using the Peyrard-Bishop model without the anharmonic stacking interaction () yields a value of much lower than 2 sung . Thus, regardless whether the transition in the full PBD model is first order or not, the analysis of bubble distributions shows once again DPB ; DP that the anharmonic stacking interaction is responsible for the sharp () transition in the model.
We are not aware of any experimental technique able to track individual bubbles in long sequences in order to study their size distributions. However, with study of the probabilities of complete melting of molecules of different sizes, the power law behavior we have described may appear. The probability of complete melting of a given sequence has already been experimentally measured zocchi using a novel technique based on hairpin quenching. This same technique, applied at constant temperature to sequences of varying length but similar composition, should clarify how the formation of bubbles depends on their size below the melting temperature. However, it should be noted that this experiment measuring complete melting is not exactly equivalent to our study of bubble formation: sequence, finite-size and boundary effects may play an important role.
In summary, using the Peyrard-Bishop-Dauxois model we have shown that at physiological temperatures the formation of thermally induced bubbles of different sizes follows a nonexponential distribution with long tails, due to nonlinear interactions within base-pairs. The occurrence of these openings may have an important effect, which should be taken into account in biological processes involving the opening of double stranded DNA. Moreover, structural properties of the DNA molecule may also depend on the frequency of occurrence of these bubbles.
We acknowledge useful discussions with K.Ø. Rasmussen, N.K. Voulgarakis, M. Peyrard and A.R. Bishop. S. A. acknowledges financial support from Ministerio de Educación y Ciencia (Spain) through grant MOSAICO.
References
- (1) Banerjee, A.; Sobell, H. M. J. Biomol. Struct. Dyn. 1983, 1, 253; Sobell, H. M. Proc. Natl. Acad. Sci. U.S.A. 1985, 82, 5328.
- (2) Choi, C. H.; Kalosakas, G.; Rasmussen, K. Ø.; Hiromura, M.; Bishop, A. R.; Usheva, A. Nucleic Acids Res. 2004, 32, 1584.
- (3) Kalosakas, G.; Rasmussen, K. Ø.; Bishop, A. R.; Choi, C. H.; Usheva, A. Europhys. Lett. 2004, 68, 127.
- (4) van Erp, T. S.; Cuesta-López, S.; Hagmann, J.-G.; Peyrard, M. Phys. Rev. Lett. 2005, 95, 218104.
- (5) Rapti, Z.; Smerzi, A.; Rasmussen, K. Ø.; Bishop, A.; Choi, C. H.; Usheva, A. Europhys. Lett. 2006, 74, 540; Phys. Rev. E 2006, 73, 051902.
- (6) Choi, C. H.; Usheva, A.; Kalosakas, G.; Rasmussen, K. Ø.; Bishop, A. R. Phys. Rev. Lett. 2006, 96, 239801; van Erp, T. S.; Cuesta-López, S.; Hagmann, J.-G.; Peyrard, M. Phys. Rev. Lett. 2006, 96, 239802.
- (7) Fenimore, P. W.; Frauenfelder, H.; McMahon, B. H.; Young, R. D. Physica A 2005, 351, 1.
- (8) Cloutier, T. E.; Widom, J. Mol. Cell 2004, 14, 355.
- (9) Du, Q.; Smith, C.; Shiffeldrim, N.; Vologodskaia, M.; Vologodskii, A. Proc. Natl. Acad. Sci. U.S.A. 2005, 102, 5397.
- (10) Wiggins, P. A.; Phillips, R.; Nelson, P. C. Phys. Rev. E 2005, 71 021909.
- (11) Yan, J.; Marko, J. F. Phys. Rev. Lett. 2004, 93, 108108.
- (12) Ranjith, P.; Sunil Kumar, P. B.; Menon, G. I. Phys. Rev. Lett. 2005, 94, 138102.
- (13) Dauxois, T.; Peyrard, M.; Bishop, A. R. Phys. Rev. E 1993, 47, R44.
- (14) Poland, D.; Scheraga, H. A. J. Chem. Phys 1966, 45, 1456; J. Chem. Phys 1966, 45, 1464.
- (15) Alexandrov, B. S.; Wille, L. T.; Rasmussen, K. Ø.; Bishop, A. R.; Blagoev, K. B. arXiv:cond-mat/0601555
- (16) Dauxois, T.; Peyrard, M. Phys. Rev. E 1995, 51, 4027.
- (17) Peyrard, M. Nonlinearity 2004, 17 R1.
- (18) Campa, A.; Giansanti, A. Phys. Rev. E 1998, 58, 3585.
- (19) Ares, S.; Voulgarakis, N. K.; Rasmussen, K. Ø.; Bishop, A. R. Phys. Rev. Lett. 2005, 94, 035504.
- (20) The parameter values are eV/Å2, , Å-1, eV, Å-1 for a GC base pair, and eV, Å-1 for an AT pair.
- (21) Zhang, Y-L.; Zheng, W-M.; Liu, J-X.; Chen, Y. Z. Phys. Rev. E 1997, 56, 7100.
- (22) Scalapino, D. J.; Sears, M.; Ferrell, R. A. Phys. Rev. B 1972, 6, 3409.
- (23) Aubry, S. J. Chem. Phys. 1975, 62, 3217; Krumhansl, J. A.; Schrieffer, J. R. Phys. Rev. B 1975, 11, 3535.
- (24) Ares, S.; Sánchez, A. Phys. Rev. E 2004, 70, 061607.
- (25) The fitting has been made using the least squares method with a weight proportional to .
- (26) Ares, S; Kalosakas, G. q-bio.BM/0607009 2006.
- (27) Sung, W.; Jeon, J.-H. Phys. Rev. E 2004, 69, 031902; Jeon, J.-H.; Sung, W.; Ree, F. H. J. Chem. Phys. 2006, 124, 164905; Jeon, J.-H.; Park, P. J.; Sung, W.;J. Chem. Phys. 2006, 125, 164901.
- (28) It has to be remarked that, although insightful and interesting, the model with does not give a quantitatively correct description of DNA melting DPB ; DP .
- (29) Kalosakas, G.; Rasmussen, K. Ø.; Bishop, A. R. J. Chem. Phys. 2003, 118, 3731; Kalosakas, G.; Ngai, K. L.; Flach, S. Phys. Rev. E 2005, 71, 061901.
- (30) Joyeux, M.; Buyukdagli, S. Phys. Rev. E 2005, 72, 051902; Buyukdagli, S.; Sanrey, M.; Joyeux, M. Chem. Phys. Lett. 2006, 419, 434.
- (31) NCBI RefSeq ID: gi48994873gbU00096, positions 791214-791464.
- (32) Ares, S.; Sánchez, A. Submitted for publication.
- (33) Dauxois, T.; Peyrard, M.; Bishop, A. R. Phys. Rev. E 1993, 47, 684.
- (34) Coluzzi, B; Yeramian, E. cond-mat/0611715 2006.
- (35) Kafri, Y.; Mukamel, D.; Peliti, L. Phys. Rev. Lett. 2000, 85, 4988; Eur. Phys. J. B 2002, 27, 135.
- (36) Baiesi, M.; Carlon, E.; Kafri, Y.; Mukamel, D.; Orlandini, E.; Stella, A. L.; Phys. Rev. E 2003, 67, 021911.
- (37) Ares, S. et al. to be published.
- (38) Yeramian, E. Gene 2000, 255, 139.
- (39) Montrichok, A.; Gruner, G.; Zocchi, G. Europhys. Lett. 2003, 62, 452; Zeng, Y.; Montrichok, A.; Zocchi, G. Phys. Rev. Lett. 2003, 91, 148101; Zeng, Y.; Montrichok, A.; Zocchi, G. J. Mol. Biol. 2004, 339, 67; Zeng, Y.; Zocchi G. Biophys. J. 2006, 90, 4522.