Glassy Dynamics in the Adaptive Immune Response Prevents Autoimmune Disease
Abstract
The immune system normally protects the human host against death by infection. However, when an immune response is mistakenly directed at self antigens, autoimmune disease can occur. We describe a model of protein evolution to simulate the dynamics of the adaptive immune response to antigens. Computer simulations of the dynamics of antibody evolution show that different evolutionary mechanisms, namely gene segment swapping and point mutation, lead to different evolved antibody binding affinities. Although a combination of gene segment swapping and point mutation can yield a greater affinity to a specific antigen than point mutation alone, the antibodies so evolved are highly cross-reactive and would cause autoimmune disease, and this is not the chosen dynamics of the immune system. We suggest that in the immune system a balance has evolved between binding affinity and specificity in the mechanism for searching the amino acid sequence space of antibodies.
pacs:
87.10.+e, 87.15.Aa, 87.17.-d, 87.23.KgOne of the main functions of the immune system is to generate B cells that secrete antibodies, protein molecules that recognize and bind to antigen. The immune system has evolved a hierarchical strategy to produce antibodies that combat invading pathogens Janeway et al. (2004). The first level is VDJ recombination, in which gene fragments are rearranged to encode functional antibodies, producing a range of antibodies with a diversity on the order of to . Upon invasion of the body by a foreign antigen, the second level of B cell somatic hypermutation evolution is initiated, in which division, mutation, and selection of B cells occurs. Those B cells that produce antibodies that bind the antigen with higher affinities are selected and propagated. Thus, the individual point mutations of somatic hypermutation essentially perform an optimizing local search of amino acid sequence space.
When an immune response is mistakenly directed at self antigens, autoimmune disease occurs Janeway et al. (2004). In most cases, the antibody/antigen interaction is highly specific. Sometimes, however, the antibody evolved in response to one antigen can bind other antigens, and this phenomenon is called cross-reactivity Goldsby et al. (2002). Cross-reactivity happens when the other antigen has chemical features in common with the original antigen and is quantified experimentally by measuring the affinity of the antibody for the other antigen. Cross-reactivity is one mechanism by which autoimmune disease may develop.
In this Letter, we present two major results. First, we show how different evolutionary mechanisms influence the relaxation dynamics of an evolving population of proteins. Specifically we study the dynamics of antibody generation by the immune system in response to pathogen invasion. These dynamics are crucial to the efficacy of the immune response. The hierarchical structure of our model protein Hamiltonian plays a critical role in the dynamics. The hierarchical structure also distinguishes our model from traditional short- or long-range spin glass energy models Fischer and Hertz (1991); Gross and Mézard (1984). Second, we show that antibodies with significantly higher affinities to antigen than those produced in a primary immune response can be found with a biologically-plausible evolution process, but are more cross-reactive and would greatly increase susceptibility to autoimmune disorders. The concept of cross-reactivity is related to that of the chaos exponent in traditional spin glasses Ney-Nifle and Young (1997); Azcoiti et al. (1995), except that for cross-reactivity we are interested in the immediate energy response rather than in the equilibrated response of the system to a change in the couplings. Taking our two results together, we show that in the primary adaptive immune response a careful balance has evolved between specificity for and binding affinity to foreign antigen.
To express the interaction energy between antibodies and antigen, we use the generalized model, a model that captures important features of the immune response to vaccination and disease and of protein molecular evolution Bogarad and Deem (1999); Deem and Lee (2003); Earl and Deem (2004). The energy of interaction for a given protein or antibody sequence is defined in the model as
| (1) |
The term includes interactions within a secondary structure. Interactions between secondary structures are essential to protein folding and function. These terms are in . The total number of interactions with a typical amino acid is roughly 12, and half of these are in (), and the other half in (). The term is the direct binding interaction between the antibody and antigen. The number of antibody secondary structural subdomains is , and the number of antibody amino acids involved directly in the binding is known to be approximately Bogarad and Deem (1999). We define the binding constant between antibody and antigen to be equal to where and are constants found by comparison to immunological data Deem and Lee (2003). Thus, the lower the overall energy, the better the binding affinity of the antibody to the given antigen. The secondary structure energy is
| (2) |
where is the number of amino acids in a subdomain, and Kauffman and Levin (1987) specifies the range of the local interactions within the secondary structure. We consider five chemically distinct amino acid classes (negative, positive, polar, hydrophobic, and other), and all subdomains belong to one of different types (helices, strands, loops, turns, and others). The quenched Gaussian random number is different for each value of its argument for a given subdomain type, . All of the Gaussian values have zero mean and unit variance. The energy of interaction between secondary structures and is
| (3) |
where specifies the number of interactions between secondary structures. Here and the interacting amino acids, , are selected at random for each interaction . The chemical binding energy of each antibody amino acid to the antigen is given by . The contributing amino acid, , and the unit-normal weight of the binding, , are chosen at random.
In our first study, we replicate the immune system dynamics. Each protein sequence is of the length of amino acids, corresponding to the length of the heavy chain variable region of an antibody. Initially there are sequences, as in the human immune response Deem and Lee (2003). Two different strategies are used in our simulations to search protein sequence space for high affinity antibodies. The first strategy mimics the normal adaptive humoral immune response. It starts with the combinatorial joining of optimized subdomains, after which the sequences undergo rounds of point mutation (PM) and selection. This is a simulation of the VDJ recombination, somatic hypermutation, and clonal selection that occurs in B cell development Goldsby et al. (2002). We generate five optimized subdomain pools, each composed of low-energy subdomains, corresponding to the types. We use three sequences from each subdomain pool in our VDJ recombination, mimicking the known diversity Deem and Lee (2003).
In our second study, we include a more powerful search of sequence space in the antibody evolution dynamics. VDJ recombination is used to generate an initial population, as in the normal immune response, but in addition to somatic hypermutation, we perform gene segment swapping (GSS) during each round of evolution and selection. GSS-type processes are used by experimentalists to produce antibodies with binding constants l/mol et al (1996), and exist within the natural hierarchy of evolutionary events Kidwell and Lisch (2001); Earl and Deem (2004).
In the process of GSS, a subdomain belonging to one of the five types is replaced by another one from the optimized subdomain pool of the same type. Each sequence undergoes an average of point mutations in each round of selection in both strategies. In GSS+PM, each subdomain in a sequence has a probability of of being replaced in the process of GSS. Following mutation, selection occurs, and the 20% lowest energy antibodies are kept and are amplified to form the population of sequences for the next round of mutation and selection. The primary response is comprised of rounds of affinity maturation, corresponding to a lag phase of approximately 10 days Deem and Lee (2003), during which B cells undergo clonal selection in response to antigen and differentiate into plasma cells and memory cells. The results that follow are averaged over instances of the ensemble.
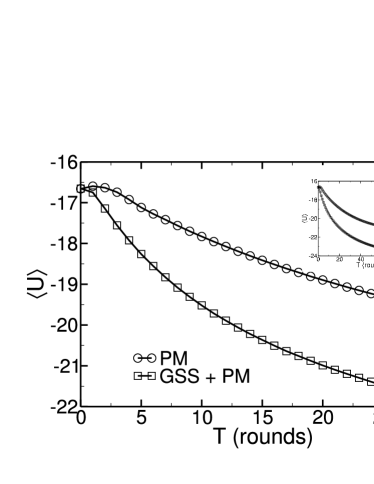
The average affinity of the population of antibodies evolves during mutation and selection. The evolution of the affinity energy under the two different strategies is shown in Fig. 1. The GSS+PM yields sequences with a lower energy than those from PM. The gap is due to each of the subdomains having an energy improved from an average to an exceptional one, , and due to better sd-sd interactions found by GSS. In other words, the former is a better mechanism than the latter in searching sequence space for higher affinity antibodies to the given antigen. The best binding energy averaged over 5000 instances of the ensemble is in the GSS+PM case and in the PM only case at round , corresponding to affinities of l/mol and l/mol, respectively. So, GSS+PM yields an affinity more than an order of magnitude improved, which is even better than the affinity obtained from a secondary response by PM only Deem and Lee (2003). That is, the multi-spin flips of GSS+PM especially accelerate the optimization of in amino acid sequence space. Antibodies with a higher affinity to the antigen work more effectively in many ways. For example they can neutralize bacterial toxins, inhibit the infectiousness of viruses, and block the adhesion of bacteria to host cells at lower serum concentrations of antibody Goldsby et al. (2002). Based solely on Fig. 2, it is hard to understand why Darwinian evolution did not result in GSS+PM or any other more efficient strategy, rather than somatic hypermutation, as the preferred strategy for B cell expansion.
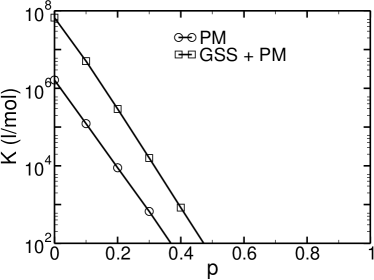
A calculation of cross-reactivity, which quantifies the specificity of the antibody, is used to compare the antibodies generated by the two strategies. Thirty rounds of primary response affinity maturation are conducted for both PM and GSS+PM. The antigen is then changed by , and so each interaction parameter in the Hamiltonian is changed with probability . The affinity constants are calculated for the new antigen in the two cases. As shown in Fig. 2, we find that cross-reactivity ceases approximately later in the GSS+PM case. We also find that the affinity constant, , decreases exponentially with the degree of antigenic change, i.e. the binding energy, , increases linearly with the change in the antigen, . Within the region of specific binding ( l/mol), affinity is always better in the GSS+PM case. These cross-reactivity experiments show that the antibodies generated by the dynamics of GSS+PM can recognize more antigens and with higher affinity than those given by the PM dynamics only. Such cross reactivity has recently been observed Holler et al. (2003). Interestingly, , since at the only correlation is that remains unchanged 20% of the time. The fraction of new values in and are centered around zero and negligible compared to the original, negative evolved values. In , a fraction of the are changed, and the original, evolved sequence gives a value of roughly zero in a changed type . The overall energy lost in is, thus, proportional to , Fig. 2
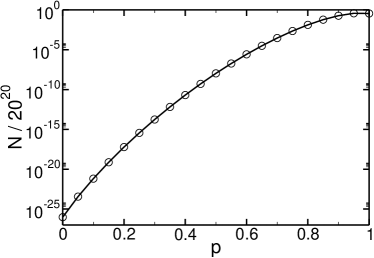
Now the question we must answer is how many protein molecules are there between and that can be recognized by the antibodies produced through VDJ recombination and GSS+PM, but cannot be recognized by the antibodies produced through VDJ recombination and PM only. Antibodies recognize and bind to epitope regions of an antigen, so we are interested in how many epitopes these two different classes of antibodies are likely to recognize. We now show that the abnormal antibodies recognize times more epitopes than do the antibodies produced by the normal primary immune response. We take the typical epitope length to be amino acids Goldsby et al. (2002); Muñoz and Deem (2004). In the theory, the antigenic distance is defined by the chemical composition of the epitope. The total number of possible epitopes is, therefore, since there are different amino acids Campbell and Reece (2004). In Fig. 3 we show the normalized number of epitopes that are at an antigenic distance of from the native epitope of the antibody, given by , where . This number is and . The number of epitopes between and and the number between and is approximately and , respectively, since grows exponentially with . In the limit of large , . This ratio is for 20 amino acids. The ratio varies between 160 and 4900 at the 15–25 amino acid limits of known epitope sizes. The ratio varies by only 30% with % variation of both values, the precision to which the generalized model values agree with experiment Deem and Lee (2003); Gupta et al. (2005).
In order to answer the question of why selection has favored the relatively slower dynamics in the immune response, we consider the function of the immune system as a whole rather than just the function of a single antibody binding to a single foreign antigen. The immune system is a delicate balance of a strong response to invading non-self antigens and weak or no response to self antigens. Thus, it is very important for the antibodies produced by the immune system to discriminate self from non-self Percus et al. (1993); Detours et al. (1994); Sulzer et al. (1993). An immune system incapable of recognizing an invading pathogen and initiating a response is an inadequate defense mechanism. On the other hand, production of antibodies binding to self antigens results in autoimmune diseases, e.g. diseases such as type I diabetes and rheumatoid arthritis. It might be thought that GSS+PM would be superior dynamics, if only the immune system were able to perform 10 rounds. However, each subsequent exposure to related antigen would lead to another 10 rounds. After a couple such exposures, GSS+PM has evolved an an unacceptably large binding constant, which saturates after several exposures to of the order of l/mol, whereas PM saturates at the value of l/mol. Even with PM dynamics, our model predicts that chronic infection may lead to autoimmune disease, a mechanism postulated to be responsible for some fraction of rheumatic diseases, including arthritis Leirisalo-Repo (2005). To resolve the significance of this mechanism, it would be interesting to see whether the distribution of onset times is broad, as predicted by our model.
It has been experimentally shown that cross-reactivity can lead to autoimmune disease Janeway et al. (2004). From Figs. 2–3, we know that the antibodies obtained at the end of a primary immune response can recognize a random epitope with a length of amino acids with a probability of . It is also known that in a typical cell there are proteins, each with a length of amino acids Tan and Deem (2004). Antibodies binding to proteins recognize only surface epitopes. The amino acids exposed on the surface of proteins are typically part of a loop or turn, and typically 1/3 of the loop or turn is exposed. Thus, a typical contiguous recognition fragment length is 6–7 amino acids. Given a typical length of 20 amino acids for the entire loop or turn, and the typical epitope size of 20 amino acids, an antibody will recognize roughly 3 non-contiguous regions of length 6–7 amino acids in the protein sequence of 500 amino acids. There are approximately such epitopes. Given the proteins in a cell, there will be total epitopes expressed in each cell. Thus, the number of epitopes recognized by a typical antibody in each cell is . Even taking an exceptional protein of length 1000 amino acids, the number increases only to 10.
This remarkable result shows that the antibodies produced by the immune system recognize on average only their intended target. Conversely, antibodies that would be evolved through an immune response composed of VDJ recombination followed by a period of GSS+PM would recognize on average epitopes in each cell. Such antibodies, while having higher affinities for the intended target, would also lead to many more instances of autoimmune disease. Such promiscuous antibodies would place too large a burden on the regulatory mechanisms that eliminate the occasional aberrant antibody Larché and Wraith (2005). Thus, we find that selection has successfully evolved the human immune system to generate antibodies that recognize on average only the intended epitope after a humoral immune response. Inclusion of “more efficient” moves is generally excluded by the bound .
References
- Janeway et al. (2004) C. A. Janeway, P. Travers, M. Walport, and M. J. Shlomchik, Immunobiology (Garland Publishing, New York, 2004), 6th ed.
- Goldsby et al. (2002) R. A. Goldsby, T. J. Kindt, B. A. Osborne, and J. Kuby, Immunobiology (W. H. Freeman and Company, New York, 2002), 5th ed.
- Fischer and Hertz (1991) K. H. Fischer and J. A. Hertz, Spin Glasses (Cambridge University Press, New York, 1991).
- Gross and Mézard (1984) D. J. Gross and M. Mézard, Nucl. Phys. B 240, 431 (1984).
- Ney-Nifle and Young (1997) M. Ney-Nifle and A. P. Young, J. Phys. A 30, 5311 (1997).
- Azcoiti et al. (1995) V. Azcoiti, E. Follana, and F. Ritort, J. Phys. A 28, 3863 (1995).
- Earl and Deem (2004) D. J. Earl and M. W. Deem, Proc. Natl. Acad. Sci. USA 101, 11531 (2004).
- Bogarad and Deem (1999) L. D. Bogarad and M. W. Deem, Proc. Natl. Acad. Sci. USA 96, 2591 (1999).
- Deem and Lee (2003) M. W. Deem and H.-Y. Lee, Phys. Rev. Lett. 91, 068101 (2003).
- Kauffman and Levin (1987) S. Kauffman and S. Levin, J. Theor. Biol. 128, 11 (1987).
- et al (1996) R. S. et al, J. Mol. Bio. 263, 551 (1996).
- Kidwell and Lisch (2001) M. G. Kidwell and D. R. Lisch, Evolution 55, 1 (2001).
- Holler et al. (2003) P. D. Holler, L. K. Chlewicki, and D. M. Kranz, Nature Im. 4, 55 (2003).
- Muñoz and Deem (2004) E. T. Muñoz and M. W. Deem, Vaccine 23, 1142 (2004).
- Campbell and Reece (2004) N. A. Campbell and J. B. Reece, Biology (Benjamin Cummings, San Francisco, 2004), 7th ed.
- Gupta et al. (2005) V. Gupta, D. J. Earl, and M. W. Deem (2005), q-bio.BM/0503030.
- Percus et al. (1993) J. K. Percus, O. E. Percus, and A. S. Perelson, Proc. Natl. Acad. Sci. USA 90, 1691 (1993).
- Detours et al. (1994) V. Detours, H. Bersini, J. Stewart, and F. Varela, J. Theor. Biol. 170, 401 (1994).
- Sulzer et al. (1993) J. Sulzer, L. van Hemmen, A. U. Newmann, and U. Behn, Bull. Math. Biol. 55, 1133 (1993).
- Leirisalo-Repo (2005) M. Leirisalo-Repo, Curr. Opin. in Rheumatology 17, 433 (2005).
- Tan and Deem (2004) T. Tan and M. W. Deem, Physica A 350, 52 (2004).
- Larché and Wraith (2005) M. Larché and D. C. Wraith, Nature Med. 11, S69 (2005).