Hierarchy, Fractality, Small-World and Resilience of Haversian Bone Structure: A Complex Network Study
Abstract
This article describes the application of recently introduced complex networks concepts and methods to the characterization and analysis of cortical bone structure. Three-dimensional reconstructions of the system of channels underlying bone structure are obtained by using histological and computer graphics methods and then represented in terms of complex networks. Confluences of two or more channels are represented as nodes, while the interconnecting channels are expressed as edges. The hierarchical backbone (the tree with maximum depth) of such a network is obtained and understood to correspond to the main structure underlying the channel system. The remainder of the network is shown to correspond to geographical communities, suggesting that the bone channel structure involves a number of regular communities appended along the hierarchical backbone. It is shown that such additional edges play a crucial role in enhancing the network resilience and in reducing the shortest paths in both topology and geometry. The recently introduced concept of fractal dimension of a network (cond-mat/0503078) is then correlated with the resilience of the several components of the bone channel structure to obstruction and failure, with important implications for the understanding of the organization and robustness of cortical bone structure.
I Introduction
Most biological structures and phenomena involve interactions between several components, required in order to obtain proper functionality and behavior. For instance, the nervous system involves a large number of neuronal cells interconnected through synapses, while the skeleton consists of many bones attached one another. Because of such a type of organization, biological structures are often properly represented and modeled in terms of graphs or networks of interconnected nodes. Therefore, the nervous system can be modeled in terms of a graph whose nodes are understood to represent the neurons and the edges the synaptic connections (e.g. costa05morphological ). Interestingly, despite the continuing interest in complex networks research (e.g. barabasi02statistical ; newman03structure ), relatively little attention has been focused on their use to represent geometrical structures in biology. One of the few exceptions is the application of complex networks to analyze the channel network underlying cortical bones, which was reported only recently viana04complex . The current work considerably extends that preliminary work in several important aspects by taking into account recently introduced powerful concepts costa05characterization such as the fractal dimension of a network havlin05self , the hierarchical backbones of networks costa04hierarchical , as well as communities (e.g. newman02community ), resilience to attack (e.g. costa04reiforcing ) and shortest paths. By treating such concepts in an integrated fashion, it has been possible to infer a series of insights about the network of channels underlying cortical bone structures.
II The Haversian System
Visual observation of the diaphysis of transversally sectioned long bones immediately reveals that this part in the bone is formed mainly by compact structures. However, at microscopic level, such a structure is verified to be composed of collagen fibers organized as lamellas with 3 to 7 of thickness which are either parallel one another or concentric to the microscopy canal, constituting the Havers System or Osteon. Such a network, which is called the Havers channels, follows the long axis of the bone, communicating with itself, with the medullary cavity and with the external surface of the bone through transversal or oblique channels called in honor of Volkmann. These channels have as main function to contain the sanguineous vases to nourish and supply oxygen to the deepest cells of the bone tissue. During bone growth, its structure is constantly modified by undoing old and forming new Havers systems. In case the distribution of blood vessels through the bone were implemented exclusively by a dichotomic tree, the elimination of specific channels could hinder nutrient and oxygen supply. Some type of architectural redundancy is therefore expected in order to compensate for eventual channel elimination through anastomosis during the growth or pathologies in adults.
III Methodology
The umerous of the adult cat used in this work was obtained from an animal necropsed in the Pathology Sector of the Veterinary Hospital of the Federal University at Uberlândia, Brazil. After dissection, a 5cm thick bone ring was extracted and sliced according to histology traditional procedures. After digitally imaged ( pixes), the sections were registered in size, translation and orientation, and the Havers and Volkman channels were manually identified, in order to allow three-dimensional reconstruction of the Haversian system by using computer graphics techniques foley95computer . A undirected graph was extracted from the three-dimensional structure by assigning a node to each channel confluence and an edge to each channel. Channels shaped as a “V” were understood to correspond to confluence of two channels, being therefore represented as a node with degree 2. The complete graph included 852 vertices and 1016 edges, implying average degree .
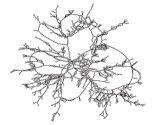
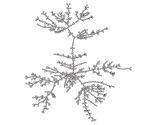
Figure 1(a) shows the non-geographic representation of the network obtained from the Haversian system. The respective hierarchical backbone corresponding to the longest underlying tree was obtained as described in costa04hierarchical and is shown in Figure 1(b). More specifically, a tree was extracted starting at each of the network nodes. Such trees were obtained by following the hierarchical levels from the starting node, while removing all cycles. The hierarchical backbone was chosen as the longest of such trees, but the widest tree was also identified and considered in our investigations. Such an approach was motivated by the assumption that the Havers channels are meant for blood supply along the bone structure.
Given the spatial adjacency restrictions imposed by the 3D space where the network lives havlin03geographical , it is reasonable to expect a branched channel organization such as those found in body vascularization and lungs. However, by being internal to a rigid structure (bones), such a structure would imply a serious shortcoming in the sense that eventual obstructions of one of the channels would mean the congestion of all downstream channels ross02histology . Therefore, we expect to find additional channels providing bypasses along the bone channel system, yielding a more resilient hybrid network.
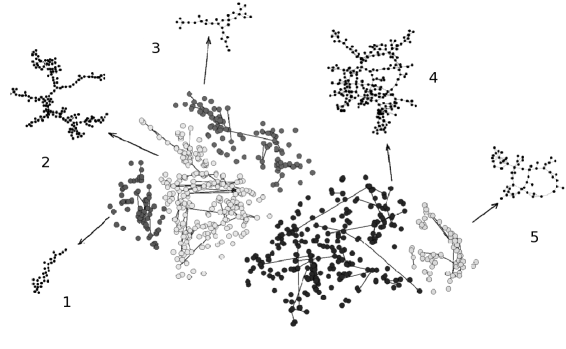
In order to verify the hypothesis above, the original channel network was removed from the original Haversian network (by using the concept of difference between two graphs). The obtained results are shown in Figure 2, which includes the two-dimensional projection of the geographic bone network (center) with its five identified geographical communities (different gray levels), as well as the respectively subnetworks defined by each geographical community. Note that the edges shown in the central structure in the previous figure correspond to those which are part of cycles in the original net. Such a fact is compatible with the above hypotheses that the Haversian system involves a tree backbone complemented by additional bypass edges (those in the five communities), also indicating that the latter are organized so as to form well-defined geographical communities. Interestingly, the same communities were obtained when considering the widest hierarchical backbone.
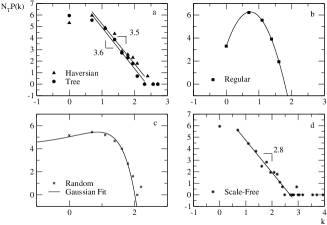
The loglog distributions of the node degrees of the Haversian network and its tree backbone are shown in Figure 3(a), from which it is clear that both graphs exhibit quite similar node degrees. The node degree distributions of regular, random and scale free equivalent networks, i.e. with the same number of edges and nodes, are shown in Figure 3(b-d), clearly illustrating that the node degree structure of the Haversian system is not similar to any of these alternative models, except the scale-free case in (d).
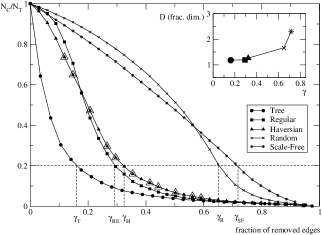
Because the resilience of the Haversian network is one of the most important features from the functional point of view, we subjected the original bone network to random edge attack, and the result (size of dominant cluster) is shown in Figure 4 (triangles) in terms of the fraction of removed edges. This figure also includes results obtained for equivalent tree, regular, random and scale-free models with approximately the same number of nodes and edges. Note that the Haversian network presents resilience behavior which is quite similar to that of regular networks, suggesting that the bone structure could have a marked degree of regularity. However, the node degree distributions shown in the loglog diagrams in Figure 3 clearly indicate that this is not the case. In other words, the investigated Haversian channel system presents a node degree distribution which is similar to its tree backbone (see Figure 3(a)) or even a scale-free model, but a substantially enhanced resilience which follows closely that of the equivalent regular model. The explanation for such mixed topological features is provided by the fact that the Haversian system can be understood as a hybrid, involving a tree backbone to which spatial communities are attached in order to provide robustness to flow obstruction, as illustrated in Figure 2.
In order to obtain a more comprehensive characterization of the topological features of the Haversian network, we calculated the network fractal dimension as proposed by Song, Havlin and Makse havlin05self , which expresses the degree of topological self-similarity of a network. Several interesting networks, including protein interaction and internet, have been verified to exhibit such a fractal organization. The algorithm involves the coverage of the network by boxes of size , such that all vertices inside one of such boxes connect one another at a distance which is smaller or equal to . The number of boxes required to cover the whole network, expressed as , is calculated for different values of . The topological self-similarity is characterized by the following power law relationship
| (1) |
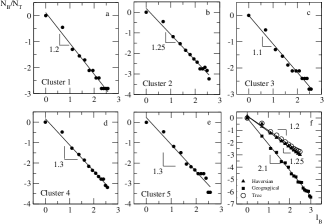
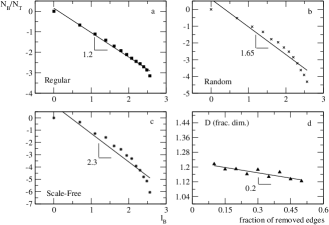
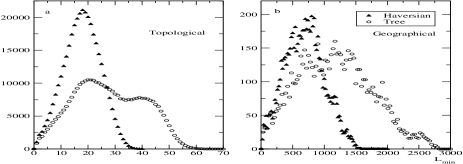
Figures 5(a-e) show the loglog curve of , where is the number of nodes in each case, obtained for each of the subgraphs, while Figure 5(f) shows the fractal dimension for the complete Haversian network as well as its respective tree backbone and the geometrical fractal dimension of the bone structure, calculated by the box-counting methodology (e.g. russel80dimension ). The topological fractal dimensions of equivalent regular, random and scale free models are presented in Figure 6. The fractal nature of the regular network is clear from (a), while the highest topological fractal dimension is obtained for the scale free case in (c). The topological fractal dimension of the instances of the attacked Haversian system shown by triangles in Figure 6 are presented in terms of the rate of edge attack in (d), which indicates that the topological fractal dimension is negatively correlated with the edge attack rate, suggesting the use of the former as an indication of the resilience of the investigated network. The shortest paths between any two nodes in the Haversian network and its related tree backbone have also been estimated and the respective histograms are shown in Figure 7(a), while the histogram in (b) indicates the shortest Euclidean distances. It is clear from these results that the addition of the communities to the tree backbone have the major effect of reducing substantially the shortest paths.
IV Concluding remarks
The present work investigated the possibility of using recently introduced complex networks concepts to represent and characterize biological 3D structures, namely the Haversian channel system underlying cortical bones. The Haversian system of channels has been found to involve a hierarchical backbone (the longest tree) to which a series of geographically well defined communities are attached in order to provide bypasses ensuring some degree of robustness to eventual channel obstruction. Such a feature of the Haversian network has been corroborated by simulated random edge attack, which indicated that, though exhibiting a node degree distribution similar to that of an equivalent tree, the bone structure presents robustness close to that of a regular network of similar size and average degree. Additional quantification of the topological redundancy of the Haversian system was obtained by using the recently introduced concept of network fractal dimension, which was found to be negatively correlated to the intensity of the attack, suggesting the use of this measurement as an indication of the network resilience. The presence of the geographical communities along the tree backbone was also found to contribute significantly to reducing the overall shortest paths in the channel system both in topological and distance terms.
Acknowledgements.
Luciano da F. Costa thanks HFSP RGP39/2002, FAPESP (proc. 99/12765-2) and CNPq (proc. 3082231/03-1) for financial support. Matheus P. Viana is grateful to FAPESP for his MSc grant.References
- [1] L.F. Costa. Morphological complex networks: Can individual morphology determine the general connectivity and dynamics of networks? q-bio.MN/0503041, 2005.
- [2] R. Albert and A.-L. Barabási. Statistical mechanics of complex networks. Rev. Mod. Phys., 74:47, 2002.
- [3] M.E.J. Newman. The structure and function of complex networks. SIAM Review, 45:167, 2003.
- [4] M.P. Viana, L. F. Costa, and M. E. Beletti. The complex channel networks of bone structure. q-bio.TO/0412042, 2004.
- [5] L.F. Costa, F.A. Rodrigues, G. Travieso, and P.R. Villas Boas. Characterization of complex networks: A survey of measurements. cond-mat/0505185, 2005.
- [6] C. Song, S. Havlin, and H.A. Makse. Self-similarity of complex networks. Nature, 433:392, 2005.
- [7] L.F. Costa. The hierarchical backbone of complex networks. Phys. Rev. Lett., 93:098702, 2004.
- [8] M. Girvan and M. E. J. Newman. Community structure in social and biological networks. Proc. Natl. Acad. Sci., 99:7821, 2002.
- [9] L. F.Costa. Reinforcing the resilience of complex networks. Phys. Rev. E, 69:066127, 2004.
- [10] J.D. Foley, A.van Dam, S.K. Feiner, and J.F. Hughes. Computer Graphics: Principles and Practice in C. Addison-Wesley, 1997.
- [11] D. ben Avraham, A.F. Rozenfeld, R. Cohen, and S. Havlin. Geographical embedding of scale-free networks. Physica A, 330:107, 2003.
- [12] M.H. Ross, G.I. Kaye, and W. Pawlina. Histology: A Text and Atlas. Lippincott Williams & Wilkins, 2002.
- [13] D.A. Russell, J.D. Hanson, and E. Ott. Dimension of strange attractors. Phys. Rev. Lett., 45:1175, 1983.