Parc Club Orsay Universit é, ZAC des vignes, 4 rue Jacques Monod, 91893 Orsay Cedex France
Characterizing Self-Developing Biological Neural Networks: A First Step Towards their Application To Computing Systems
Abstract
Carbon nanotubes are often seen as the only alternative technology
to silicon transistors. While they are the most likely short-term
alternative, other longer-term alternatives should be studied as
well, even if their properties are less familiar to chip designers.
While contemplating biological neurons as an alternative component
may seem preposterous at first sight, significant recent progress in
CMOS-neuron interface suggests this direction may not be
unrealistic; moreover, biological neurons are known to self-assemble
into very large networks capable of complex information processing
tasks, something that has yet to be achieved with other emerging
technologies.
The first step to designing computing systems on top of biological neurons is to build an abstract model of self-assembled biological neural networks, much like computer architects manipulate abstract models of transistors and circuits. In this article, we propose a first model of the structure of biological neural networks. We provide empirical evidence that this model matches the biological neural networks found in living organisms, and exhibits the small-world graph structure properties commonly found in many large and self-organized systems, including biological neural networks. More importantly, we extract the simple local rules and characteristics governing the growth of such networks, enabling the development of potentially large but realistic biological neural networks, as would be needed for complex information processing/computing tasks. Based on this model, future work will be targeted to understanding the evolution and learning properties of such networks, and how they can be used to build computing systems.
1 Introduction
Carbon nanotubes look like a promising alternative technology to silicon chips because the manufacturing process, possibly based upon self-assembly, will be much cheaper than current CMOS processes. On the other hand, these individual components may turn out to be much slower than current transistors, exhibit lots of manufacturing defects, and may be difficult to assemble into complex and irregular structures like today’s custom processors. Current research are focused on building increasingly large structures of carbon nanotubes and understanding how they can be transformed into computing devices.
However, carbon nanotubes, though the most promising and short-term, is not the only possible alternative to silicon chips. Other emerging technologies, even if they are less familiar to chip designers, should be explored as well. In this article, we focus our attention on biological neurons. They share some properties with carbon nanotubes: they have a low design cost, but they will provide even slower components, a significant percentage of these components will be similarly faulty, and it will be hard to assemble them into complex, irregular pre-determined structures. On the other hand, they have a significant asset over carbon nanotubes: we already know it is possible to self-assemble them into very large structures capable of complex information processing tasks.
While proposing computing structures based on biological neurons may seem preposterous at first sight, G. Zeck and P. Fromherz [12, 30] at the Max Planck Institute for Biochemistry in Martinsried, Germany, have recently demonstrated they can interface standard silicon chips with biological neurons, pass electrical signals back and forth through one or several biological neurons, much like we intend to do with carbon nanotubes, i.e., hybrid carbon nanotures/standard CMOS chips [13]. Moreover, based on this research work, Infineon (one of the main European chip manufacturers) has recently announced it is investigating a prototype of a chip (called ”NeuroChip”) that can interconnect a grid of transistors with a network of biological neurons [16], based on Fromherz’s research work. So, while we will not claim this research direction should be mainstream, it is certainly worth exploring.
Now, computing machines, such as current processor architectures, are designed using a very abstract model of the physical properties of transistors and circuits. Typically, what processor architects really use (e.g., at Intel or other chip manufacturers) is how many logic gates can be traversed in a single clock cycle, and how many logic gates can be laid out on a single chip. They do not deal with the complex physics occurring at the transistor level, they rely upon a very abstract and simplified model of the undergoing physical phenomena. Similarly, if we want to start thinking about computing systems built upon biological neurons, we must come up with sufficiently abstract models of biological networks of neurons that will enable the design of large systems without dealing with the individual behavior of biological neurons.
The vast literature on artificial neural networks provides little indications on the structures of biological neural networks [14]. To understand what kind of computing systems can be built upon biological neurons, we must first understand the kind of structures into which biological neurons can self-assemble. Consequently, we have turned to biology for that issue, and the current article is a joint work between computer science and biology research groups. We start with the biological neural network of a small living organism, a worm named Caenorhabditis elegans, which has been described in great details in [1, 29].111This worm has been subject to intense scientific study as one of the most simple living organism that retains many of the characteristics of complex organisms, such as a brain, learning capabilities, and other physiological similarities. As a side note, it is the first organism which genome has been entirely sequenced. Based on this work, Oshio et al. [23] have recently built a database which describes this biological neural network and facilitates its manipulation. Using this map as an oracle, we define a model of network growth in real space and provide empirical evidence that the characteristics of networks built upon this model and the above mentioned biological network closely match. Since this model describes the network growth using simple local rules, it can be used to represent much larger networks, as would be needed for computing systems. Note that such models had not yet been derived by and are not directly useful to biologists: there are many studies on biological neural networks, but they focus on the identification of regular biological networks with clear structures, such as the basic circuit of the visual cortex [10], and they do not account for the seemingly irregular structure of the vast majority of biological neural networks. We provide a statistical description of these apparently unstructured biological networks, that can be used as a building block for computing systems studies. Future work will focus on analyzing the evolution and learning properties of neural networks with such structures.
In Section 2, we present the biological neural network of C. elegans and study its properties. In Section 3, we build a network model with similar properties, provide empirical evidence that it closely emulates the neural network of C. elegans , and provide a detailed comparison of the model and its biological counterpart.
2 A biological neural network
C. elegans is a small (millimetric) worm with a simple network of 302 neurons. All the connections between its neurons have been mapped [1, 29] and are believed to be relatively well conserved between individual worms. To construct a graph model of this system, we used the electronic database recently published by Oshio et al. [23]. A part of this system, comprising 20 neurons and referred to as the ”pharyngeal system” is dedicated to control rhythmic contractions of a muscular pump that sucks food into the worm body [1]. This system is almost totally disconnected from the rest of the network. Following Morita et al. [21], we neglected here the pharyngeal system and only deal with the remaining 282 neurons. We then further neglected those neurons for which no connection had been described, as well as the connections to non specified cells. At the end, the network thus consisted of 265 neurons. Unlike Morita et al. [21], we treated each link as directed, i.e., we differentiated links from neuron to neuron and links from to ; however, we collapsed multiple identical links into a single one. In opposition to chemical synapses, which are unidirectional connections, some of the neuron connections, called electrical synapses or gap junctions, are bidirectional. Here we treated gap junctions as pairs of links with opposite directions. Overall, we obtain 2335 unique links (or 10234 connections if we allow redundant links with the same orientation between two neurons).
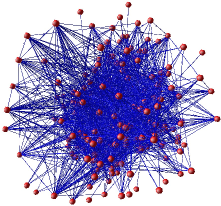
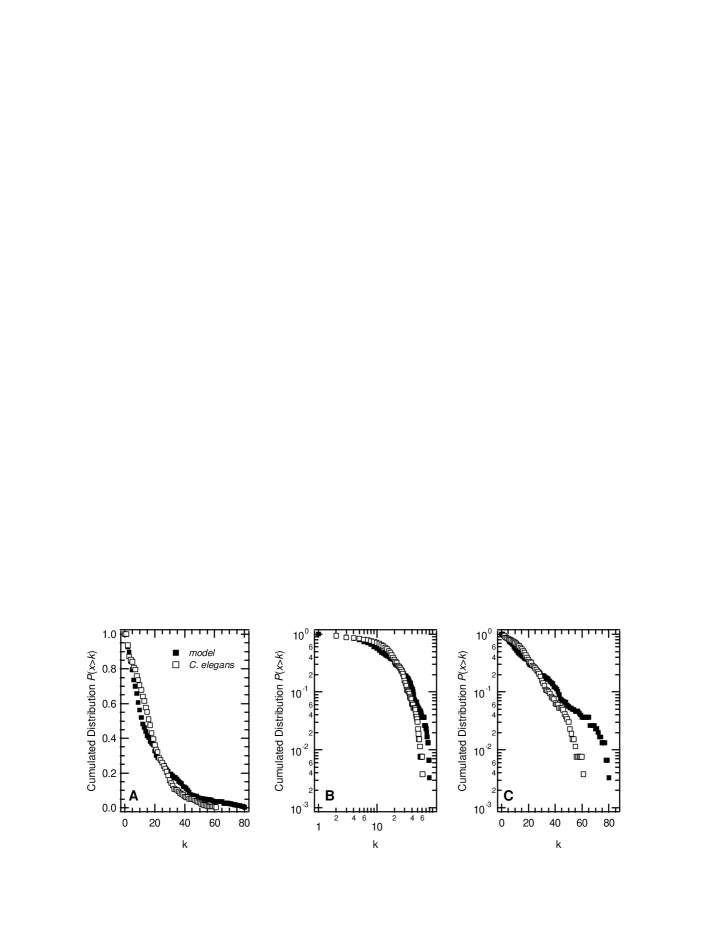
Figure 1 shows a visual illustration of the corresponding neural network. A visual inspection of this figure, especially the peripheral nodes,222On paper, the core of the network structure is barely visible, but on a screen, it can be inspected through zooming and 3D manipulations; however the peripheral structure is the same as the core structure. indicates that the network is rather heterogeneous: strongly connected nodes coexist with sparsely connected ones. We further tried to estimate the nature of the probability distribution of the connectivity (or graph degree), as it plays a fundamental role in characterizing the network type. The probability distribution of the connectivity in C. elegans neural network has been controversial. A first study claimed the distribution was compatible with a power-law (graphs determined by power-law distributions are also called “scale-free” graphs) [3]. Not long after, this result was contradicted by an article from H.E. Stanley’s team that studied outgoing and incoming connectivity separately (and ignored gap junctions) and showed that both distributions were exponential, thus excluding scale-free properties [2]. Finally, Morita et al. put forward correlations among incoming, outgoing and gap junctions to explain that the total degree (incoming + outgoing + gap junctions) was neither exponential nor displayed a clear power law decrease [21]. Figure 2 presents the distribution of the total connectivity for C. elegans neural network (white squares). The center panel is a replot of the left one, in log-log coordinates. A power law decrease would yield a straight line in this representation, which is clearly not the case. Further, the right panel is another replot of the same data, in log-linear coordinates. Here, a straight line would indicate an exponential decrease. A clear exponential decrease is not apparent from this panel. Thus, our results confirm that connectivity distribution for C. elegans neural network is neither scale-free nor clearly exponential.
We will see in the next section that additional network characteristics are necessary to emulate this network structure; more importantly, we will extract the simple local rules governing the network growth, enabling the development of potentially large but realistic biological networks using the same rules.
3 A model of biological neural networks
Small-World graphs and neural networks. The global behavior of most large systems emerges from local interactions between their numerous components. At an abstract level, these systems can often be viewed as graphs, with each link representing the interaction between two components. Such graph theory approaches have proven successful in understanding the global properties of several complex systems originating from highly disparate fields, from the biological to social and technological domain. Hence the same (or similar) reasonings can be applied to understand cell metabolism [17], the citation of scientific articles [22], software architecture [27], the Internet [3] or electronic circuits [5]. A common feature of all these networks is that their physical structure reflects their assembly and evolution, so that their global features can be understood on the basis of a small set of simple local rules that control their growth. The most common statistical structures resulting from these local rules are the so-called small-world and scale-free networks. Small-world properties characterize networks with both small average shortest path and a large degree of clustering, while scale-free networks are defined by a connectivity probability distribution that decreases as a power law (more formal definitions will be given in the following). At a much coarser grain, graph theory methods have recently been applied to networks of cortical areas [26, 11],333Cortical areas are functionally related zones of the cortex that contain approximately neurons i.e., not networks of neurons but networks of neuron areas, with the prospect of understanding the network functions. Since we target the characterization of networks of biological neurons, we study the neural network of the millimetric worm C. elegans at the level of individual neurons, and attempt to derive a network growth model that closely emulates it.
Most complex networks can be categorized into four families [4]. In random networks (also known as Erdős-Rényi graphs), two nodes and are connected with a predefined probability independently of all others. These graphs are characterized by short paths between two nodes (denoted ) and a low clustering (denoted ). On the opposite, regular graphs (where each node has the same connectivity) are characterized by a high clustering and a large average shortest path. Between these two extremes, small-world graphs display both small average shortest paths and a high degree of clustering. For most small-world networks, , i.e., the probability distribution of the connectivity , decreases very quickly (exponentially) beyond the most probable value of , which thus sets the connectivity scale. However, in some graphs (such as the Internet), decreases as a power-law of (), i.e., in a much slower way. In this case, nodes with a very high connectivity (hubs) can also be present with a significant probability so that the connectivity does not display a clear scale, hence the term “scale-free” networks.
We now formally introduce the parameters of a network model. Besides the number of nodes and number of links , the structural characteristics of complex networks are mainly quantified by their link density , average connectivity , connectivity distribution , average shortest path and average clustering coefficient [25]. The network density is the density of links out of the possible directed links444Each node can have at most outgoing links, so the maximum number of links is . (recall multiple links between two nodes are considered a unique link and self-connections are forbidden)
| (1) |
The connectivity (or degree) of node number is the number of links coming from or directed to node . is the probability distribution of the ’s and their average over all the nodes in the network. Let be the shortest path (in number of neurons) between neuron and , then is its average over the network
| (2) |
The clustering coefficient of a node with (incoming plus outgoing) connected neighbors is defined by
| (3) |
where is the number of connections among the neighbors of node , excluding the connections between a neighbor and node itself. The average clustering coefficient is the average of the ’s over all nodes and expresses the probability that two nodes connected to a third one are also connected together (degree of cliquishness).
The main structural characteristics of the C. elegans neural network are indicated in Table 1. Compared to a random network with the same density, this neural network has a similar average shortest path but the clustering has increased almost fivefold. This means that, in the C. elegans neural network, one neuron can reach any other neuron in only three connections on average. This is a clear sign of small-world properties. Considering the network is treated here as a directed graph, these results are coherent with previously published estimates [28, 9].
| Network | ||||
|---|---|---|---|---|
| C. elegans | 0.033 | 17.62 | 3.19 | 0.173 |
| random | 0.033 | 17.62 | 2.75 | 0.0352 |
| model | 0.030 | 17.73 | 3.37 | 0.175 |
In biological neural networks, distance matters. In order to design a network growth model of the C. elegans neural network that achieves small-world properties, we have found that taking into account the physical distance between two nodes (neurons) is critical. Most network growth models do not consider this parameter [19]. For instance, most scale-free networks are obtained through a preferential attachment rule which postulates that new nodes are linked to the already most connected nodes [3]. Not only this development rule implies some global control mechanism (i.e., a node must somehow know which are the most connected nodes) which seems unlikely in the case of a neuronal system, but it also implies that long connections are just as likely as shorter ones. Similar arguments can be opposed to the Watts-Strogatz rewiring algorithm that generates small-world networks through addition of long-range connections to a pre-existing regular circular network [28]. An improved variation of the Watts-Strogatz algorithm restricts rewiring to a local spatial neighborhood around each node [9] thus implicitly introducing the distance factor. However, these last two models are not and cannot evolve into network growth models and thus do not provide a biologic realistic metaphor. In opposition to these models, we address in the present work the specific case of biological neuron network growth in real three dimensional space.
Several observations in biology further support the key notion of physical distance. Long distance connections are expensive in biological neural networks because they imply large volumes of metabolically active tissue to be maintained and long transmission delays [8], just like links between two nodes in Internet or in airport transportation systems are more costly. Moreover, wiring length optimization seems to be a crucial factor of cortical circuit development [6, 7]. The network structure itself depends on the wiring length. For instance, small-world properties (as well as, under some circumstances, scale-free connectivity [15]) have been shown to emerge naturally upon minimization of the euclidian distance between nodes [20]. Furthermore, Kaiser et al. [18] have recently shown that network structure during growth in a metric space is influenced by neuron density (number of neurons per unit volume) when growth occurs in a spatially constrained domain.
A network growth model for C. elegans . We now propose a network growth model in a three-dimensional space. Neurons are abstracted as cubical volumes of unit size. The position of each neuron on the cubic lattice is defined by the integer coordinates of its center of mass and spans over the volume comprised between and . The lattice dimensions are , and , defining a volume of unit sizes. Each step of the growth algorithm consists of six elementary substeps:
-
1.
choose a neuron at random among the neurons already connected in the network (origin neuron). Let be the spatial coordinates of on the lattice.
-
2.
Then choose a destination site at distance with probability
(4) where is the euclidian distance between and , and is a parameter that sets the average connection distance. If the chosen destination site is located outside the lattice borders, go back to substep 1. Thanks to the exponential distance distribution, the probability to create a connection of a given length (at a certain distance) decreases rapidly with the length, which accounts for wiring minimization. Note that, in biological neural networks, new connections are established through cell outgrowths (neurites) from existing neurons; these outgrowths are guided by gradients of chemical concentration which similarly decay rapidly with distance. We also tested other probability distributions, such as power-laws, and obtained similar results.
-
3.
If a neuron of the network already exists at the destination site , a connection is created between and .
-
4.
If there is no neuron at the destination site, a new neuron is placed at the destination site (and a connection is created between and ) with probability ; the value of is discussed below.
-
5.
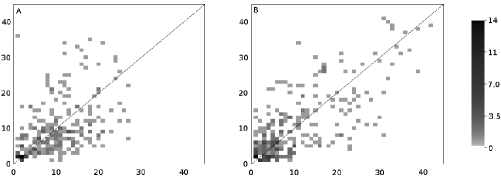
If a connection has been created during one of the two preceding steps, its direction ( or ) is chosen with probability where and are respectively the outdegree and indegree of neuron , i.e., the number of connections with as starting node and as destination node. This probability distribution reflects the property that, in C. elegans , strongly connected neurons (hubs) exhibit asymmetric fractions of incoming/outgoing connections: either much more incoming or much more outgoing connections. The joint degree distribution matrix of the C. elegans network shown in Figure 4A highlights this characteristic: each matrix element corresponds to the number (coded using a gray scale) of neurons with incoming and outgoing connections, so that a scattered plot indicates an asymmetrical repartition of incoming and outgoing connections for many neurons; hubs are the dots located farthest from the origin (lots of connections). We can observe that several of the hubs are located far from the diagonal, hence the asymmetry.
-
6.
go back to substep 1.
This algorithm iterates until the network contains a prescribed number of neurons . In this study, we set .

New neurons are unlikely to be created in already cluttered areas. If one sets , i.e., a new neuron is certain to be created in a currently empty location, our algorithm is essentially a three-dimensional extension of the model recently proposed by Kaiser and Hilgetag [18]. As demonstrated by these authors, networks obtained with progressively acquire small-world properties when neuron density approaches 1 (i.e. when ). In this case however, the average connectivity and the connection density (as well as the joint degree distribution matrix, see below) remains severely smaller than observed in C. elegans (e.g., we could not achieve an average connectivity higher than 6-7).
Decreasing breeds significantly more realistic results. As seen in Figure 3, connection density, average connectivity and clustering index increase as decreases while the average shortest path decreases. Thus, decreasing yields networks with increasingly strong small-world properties together with increasingly high average connectivity. Furthermore, Figure 4B indicates that our model indeed yields hubs with asymmetric connectivity, as observed for C. elegans in Figure 4B. Taken together, the results of Figure 3 and 4 show that all the studied structural properties of the networks obtained with our algorithm match that of C. elegans neural network for . A biological interpretation of this value is that natural neural networks would be very reluctant to admit new neurons in the network (as only 1 contact out of 3000 would be statistically successful). Interestingly, recent results in neurobiology suggest that the lack of neural turnover and/or replacement of injured neurons in the adult brain is not due to the absence of potentially competent cell, but, more probably, to a strong reluctance of the neurons to accept newcomers into an already established neural network [24]. In light of these findings, our results suggest that this strong reluctance could be one of the factors inducing the high average connectivity observed in biological neural networks, i.e., if new neurons can hardly emerge in already cluttered areas, connections are mostly drawn among existing neurons, hence the high connectivity. Since we made the observation that must be very small while fine-tuning the model and before being aware of these recent neurobiological findings, we interpreted this correlation as additional evidence of the validity of our model.
Finally, we can note that the model network characteristics match the C. elegans network characteristics, as shown in Table 1. And, in spite of some discrepancies due to the relatively small number of neurons for high connectivity values, the connectivity distribution of the model network is also fairly close to that of the C. elegans network, as shown in Figure 2, see the black squares curve. In particular, the model network distribution is neither a power-law, nor clearly exponential (though it is closer to an exponential decrease than that of C. elegans ). We can thus conclude that our model closely emulates the structure of the biological network of C. elegans .
4 Conclusions & Future Work
Based on empirical data of a tiny organism, we have elaborated a model for biological neural networks. In agreement with previous works [28], we have found that the neural network of C. elegans has a graph structure with small-world properties, like many complex systems found in nature. Because the model defines the network growth properties, we can now use it to characterize the large neural networks needed for achieving computing tasks. The next step will consist in studying how this network structure affects the learning capabilities and characteristics of neural networks. We then intend to pursue two research directions.
A further step will consist in improving the model accuracy/realism by integrating known but abstract characteristics of the behavior of individual neurons. Finally, through this combined model, we will investigate the application of such biological neural networks to computing tasks, assuming the experimental setups described in [12]. In this perspective, our aim is to obtain a sufficiently abstract model of biological networks of neurons that will enable the design of large systems without dealing with the individual behavior of biological neurons. We think that the availability of such abstract models will be a crucial chokepoint that will have to be overcome if we want to build computing systems using real biological neurons.
In parallel, we intend to use the model developed in this article for biology-oriented studies, especially to investigate how evolution combined with such network structures can foster the emergence of new simple functions within a neural network.
References
- [1] D.G. Albertson and J.N. Thomson. The pharynx of caenorhabditis elegans. Phil. Trans. R. Soc. London B, 275:229–325, 1976.
- [2] L.A.N. Amaral, A. Scala, M. Barthélémy, and H.E. Stanley. Classes of small-world networks. Proc. Natl. Acad. Sci. USA, 10:11149–11152, 2000.
- [3] A.L. Barabasi and R. Albert. Emergence of scaling in random networks. Science, 286:509–512, 1999.
- [4] A.L. Barabasi and Z.N. Oltvai. Network biology: understanding the cell’s functional organization. Nature Rev. Genetics, 5:101–113, 2004.
- [5] R. Ferrer Cancho, C. Janssen, and R.V. Solé. The topology of technology graphs: Small world patterns in electronic circuits. Phys. Rev. E., 64:32767, 2001.
- [6] C. Cherniak. Component placement optimization in the brain. J. Neurosci., 14:2418–2427, 1994.
- [7] C. Cherniak. Neural component placement. Trends Neurosc., 18:522–527, 1995.
- [8] D.B. Chklovskii, T. Schikorski, and C.F. Stevens. Wiring optimization in cortical circuits. Neuron, 34:341–347, 2002.
- [9] J. W. Clark and A. T. Eggebrecht. The small world of the nobel nematode caenorhabditis elegans. In J. da Providencia and F. B. Malik, editors, Condensed Matter Theories, volume 18. Nova Science Publishers, Hauppauge, N.Y., 2003. to appear.
- [10] R. Douglas and K. Martin. Neocortex. In G. M. Shepherd, editor, The synaptic organization of the brain, pages 459–509. Oxford University Press, Oxford, 1998.
- [11] V.M. Eguiluz, D.R. Chialvo, G. Cecchi, M. Baliki, and A.V. Apkarian. Scale-free brain functional networks. Phys. Rev. Lett., 94:018102, 2005.
- [12] P. Fromherz. Neuroelectronic interfacing: Semiconductor chips with ion channels, nerve cells, and brain. In Rainer Waser, editor, Nanoelectronics and informaiton technology, pages 781–810. Wiley–VCH, Berlin, 2003.
- [13] Seth Copen Goldstein and Mihai Budiu. NanoFabrics: Spatial computing using molecular electronics. In Proceedings of the 28th International Symposium on Computer Architecture 2001, 2001.
- [14] S. Haykin. Neural Networks. Prentice Hall Intl, London, UK, 2nd edition, 1999.
- [15] R. Ferrer i Cancho and R.V. Solé. Optimization in complex networks. In Statistical physics of complex networks, Lecture notes in physics, pages 114–125. Springer, Berlin, Germany, 2003.
- [16] Infineon. Neurochip with integrated electronics in research phase. http://www.infineon.com/cgi/ecrm.dll/jsp/showfrontend.do? lang=EN&channel_oid=-11398, 2003.
- [17] H. Jeong, B. Tombor, R. Albert, Z.N. Oltvai, and A.L. Barabasi. The large-scale organization of metabolic networks. Nature, 407:651–654, 2000.
- [18] M. Kaiser and C.C Hilgetag. Spatial growth of real-world networks. Phys. Rev. E, 69:036103, 2004.
- [19] M. Kimura, K. Saito, and N. Ueda. Modeling of growing networks with directional attachment and communities. Neural Networks, 17:975–988, 2004.
- [20] N. Mathias and V. Gopal. Small worlds: how and why. Phys. Rev. E, 63:021117, 2001.
- [21] S. Morita, K.-I. Oshio, Y. Osana, Y. Funabashi, K. Oka, and K. Kawamura. Geometrical structure of the neuronal network of caenorhabditis elegans. Physica A, 298:553–561, 2001.
- [22] M.E.J. Newman. The structure of scientific collaboration networks. Proc. Natl. Acad. Sci. USA, 98:404–109, 2001.
- [23] K. Oshio, Y. Iwasaki, S. Morita, Y. Osana, S. Gomi, E. Akiyama, K. Omata, K. Oka, and K. Kawamura. Database of synaptic connectivity of c. elegans for computation. Technical Report 3, CCeP, Keio Future, Keio University, Japan, 2003. The connectivity database is available online at http://ims.dse.ibaraki.ac.jp/research/database_en.html.
- [24] P. Rakic. Immigration denied. Nature, 427:685–686, 2004.
- [25] O. Sporns. Graph theory methods for the analysis of neural connectivity patterns. In R. Kötter, editor, Neuroscience Databases: A Practical Guide, pages 171–186. Klüwer, Boston, MA, 2002.
- [26] O. Sporns, D.R. Chialvo, M. Kaiser, and C.C Hilgetag. Organisation, development and function of complex brain networks. Trends Cog. Sci., 8:418–425, 2004.
- [27] S. Valverde, R. Ferrer Cancho, and R.V. Solé. Scale-free networks from optimal design. Europhys. Lett., 60:512–517, 2002.
- [28] D.J. Watts and S.H. Strogatz. Collective dynamics of ’small-world’ networks. Nature, 393:440–442, 1998.
- [29] J.G. White, E. Southgate, J.N. Thomson, and S. Brenner. The structure of the nervous system of the nematode caenorhabditis elegans. Phil. Trans. R. Soc. London B, 314:1–340, 1986.
- [30] G. Zeck and P. Fromherz. Noninvasive neuroelectronic interfacing with synaptically connected snail neurons immobilized on a semiconductor chip. Proc. Natl. Acad. Sci. USA, 98(18):10457–10462, 2001.