Yeast Protein Interactome topology
provides framework for
coordinated-functionality
Summary
The architecture of the network of protein-protein physical interactions in Saccharomyces cerevisiae is exposed through the combination of two complementary theoretical network measures, betweenness centrality and ‘Q-modularity’. The yeast interactome is characterized by well-defined topological modules connected via a small number of inter-module protein interactions. Should such topological inter-module connections turn out to constitute a form of functional coordination between the modules, we speculate that this coordination is occurring typically in a pair-wise fashion, rather than by way of high-degree hub proteins responsible for coordinating multiple modules. The unique non-hub-centric hierarchical organization of the interactome is not reproduced by gene duplication-and-divergence stochastic growth models that disregard global selective pressures.
Introduction
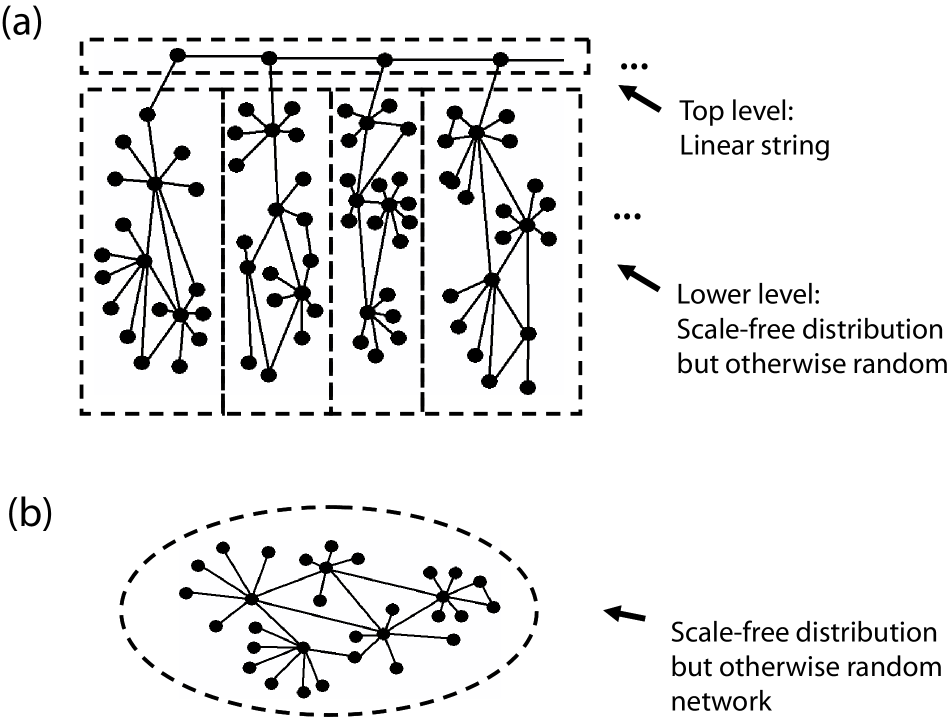
The set of all physical protein-protein interactions in a cell – the interactome – presents a foundational picture for Biology, sitting at the lowest level of description at which it is possible to have an holistic view of a cell rather then just an isolated study of its individual components. In this article, we make a small contribution to the ongoing effort to understand the global architecture of this fundamental physical network [1, 2, 3, 4, 5, 6, 7, 8, 9, 10]. The interactome can be represented in an abstract way as a network of nodes connected by links, where nodes stand for proteins and links for direct physical interactions between proteins. In recent years, there has been much interest in applying statistical mechanics to the study of such complex networks [11, 12]. However, the validity of such an approach is always conditional on the fundamental assumptions of statistical mechanics being satisfied. For instance, many statistical measures will not be able to distinguish between a network with an intrinsic hierarchical topology and one without it (Figure 1).
Results and Discussion
Our approach sidesteps the limitations alluded to in the preceding paragraph and focuses directly on how the interactome topology relates to two broad biological concepts. The first of these, hierarchical organization, is in this context the notion that there may exist a hierarchy in the role of proteins [10]. On one hand, there are proteins that perform very specific, local functions, relevant only within the context of a particular biological process. On the other hand, some proteins may possess a global, high level role, perhaps acting as mediators of distinct biological processes. To study the topological hierarchy in the interactome, we use the graph theoretical betweenness centrality measure [13, 14, 15] (Supp. Mat.). Betweenness centrality (denoted ‘traffic’, henceforth) for a node is the total number of shortest paths (between any two other nodes) in the network that pass through that node. A high traffic value for a protein therefore correlates with that protein being topologically central in the interactome. The second of these is the concept of biological functional modularity [16]. In the context of proteins, at the extreme, this takes the form of protein machines performing specific functions in a cell [7]. More generally, it consists of an expectation that the density of protein-protein interactions will rise as we zoom into an increasingly functionally related set of proteins. To assess modularity in the interactome topology, we use the ‘Q-modularity’ measure of Newman [17], which assigns a modularity score, Q, to any given partition of the network into modules. The modularity Q is defined as the difference between the ratio for the network in question, and the expected value for this ratio if edges in the network were randomized, subject to every node maintaining its original degree. We use the algorithm of Clauset et al. [18] to find an interactome partition into modules that corresponds to a large Q value.
We now explain how to produce an interactome polar map (Figure 2) by combining the information contained in the modularity and traffic analyses. The position of every protein in the map is specified in terms of its radial and angular coordinates. The radial coordinate is a function of its traffic [19]. More precisely, it is proportional to , where ‘max traffic’ is the maximum node traffic in the network (Supp. Mat.). A logarithmic scale is used due to the long tail of the traffic distribution [20]. The protein angular coordinates are assigned such that all proteins in the same module fall within the same angular range (Supp. Mat.). This way, an interactome map is created where topologically increasingly central proteins are radially increasingly closer to the center of the map, while angular sectors correspond to topological modules. To determine the circular ordering of the modules in the map, we introduce a Ring Ordering Algorithm that, based on the interactome inter-module connectivity, attempts to place closer to each other, to the extent that it is possible, modules that are more topologically related (Supp. Mat.).
We apply this analysis and discuss its implications in the context of the Saccharomyces cerevisiae interactome. The interactome data set we use is the higher confidence ‘filtered yeast interactome’ (FYI) [10], consisting of interactions supported either by small-scale screens as reported in the MIPS database [21] or by at least two distinct methods from amongst i) high-throughput yeast two-hybrid experiments [22, 23], ii) computational predictions based on gene co-occurrence [24, 25], gene neighborhood [24, 26] or gene fusion [24, 25], iii) high-throughput affinity purification/mass spectrometric protein complex identification experiments [27, 28] and iv) small-scale or module-scale experimental identification of protein complexes as reported in MIPS [21] (Supp. Mat.). We consider only the giant connected component produced by this data set, a network containing 1741 interactions amongst 741 proteins. Our data set choice reflects a desire to bias the data towards a thorough and accurate coverage of a limited region of the interactome as opposed to a wider, but likely shallower and more error prone, sampling. Note that when defining whether two proteins interact, a binary description is being imposed on what ideally would be characterized in terms of an affinity constant. Experimentally, effectively the aim has been for a cut-off that is high enough to exclude indiscriminate low-affinity interactions, such as those that occur between a general protein and proteasomal, ribosomal, or heat shock proteins, since in principle these are less informative interactions [29, 30]. Hence, such interactions are largely absent from data sets. With the vast majority of the proteins at the periphery of the map and well-defined modules connected through a handful of more central proteins, the yeast interactome polar map (Figure 2) presents what we term a ‘coordinated-functionality’ architecture. Next, we discuss how this interactome architecture fits in with the biology of the cell.
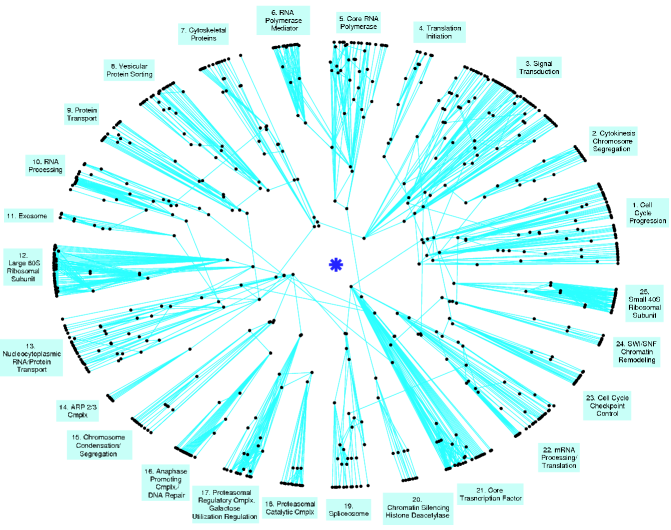
An examination of the MIPS database functional (biological process) annotation of the proteins [21] demonstrates that the topological modules make very good sense as biological functional modules. On average 88.8% of the proteins in a module share a similar function based on their MIPS classification [21] (Supp. Mat.), confirming earlier studies connecting topology and function [31, 32, 33, 34, 35, 36, 37, 38, 39, 40]. Part of the mismatch between the topological modules and current protein functional annotations will likely vanish, once more complete and accurate interactome data sets become available. However, it is the disparities not due to data set limitations that are truly interesting, for those are instances where the functional modules based on the interactome topology are not the ones we currently assign in functional classification schema. In view of i) the good overall match found and ii) the foundational role of the interactome in the cell, we propose that the interactome topology represents a fundamental source for the division of proteins into functional groups. As such, its modularity analysis provides a rigorous alternative to the currently subjective functional annotation present in protein databases. In accordance, we name the topological modules found so as to reflect their perceived biological roles (Figure 2).
The average degree of essential [41, 42] proteins in the data set is 5.7, while that of non-essential proteins is 3.9, a difference that is too large to be attributable to chance alone [43] (Supp. Mat.). This difference may indeed be biologically meaningful. Although physically knocking out a gene associated with a high or a low degree protein, say of degree 2 or 10 respectively, may be considered equivalent, from a mathematical network perspective it is not. In one case, it involves deleting 1 node and 2 links, in the other it involves deleting 1 node and 10 links. Note that such an explanation would not involve ascribing any out of the ordinary, higher-level role to hubs, the large degree proteins. Alternatively, the observed higher average degree of essential proteins could still stem from lingering systematic biases in the FYI data set.
While the translation of the interactome modular topology into biological functional modularity is straightforward, this is not the case for the interactome topological hierarchical organization. A fundamental question that the traffic analysis gives rise to is how the interactome topological hierarchical organization phenomenologically expresses itself. For instance, do more hierarchically central proteins in fact perform a higher-level, coordinating role in the cell? At present, these are open biological questions.
Comparing proteins of equal degree, we find no significant correlation between a protein’s traffic and its essentiality [41, 42] (Supp. Mat.), something not too surprising, as knocking out a key protein that renders an essential functional module inoperant is plausibly more damaging than knocking out a protein that mediates two distinct processes that nonetheless can still function independently. An intriguing, though at the moment still unsupported hypothesis is that, if a protein is disrupted, its traffic level correlates with the likelihood of causing non-lethal side effects in multiple areas of the biology of the cell. Speculating further, perhaps our representation of the interactome can provide clues as to where those side effects may arise – a matter of critical importance in drug development. A different possibility is that, for some of these module-connecting proteins, interacting with multiple modules is not a sign of a role in coordinating the functionality of the modules, but rather just a result of the protein being independently used in those modules. In opposition to a true functional ‘connector’, we would call such a protein a ‘bolt’ (alternatively, ‘widget’), in reference to how, analogously, a mechanical bolt can be used in multiple functional modules of a human engineered machine, while playing no role in coordinating their functionality. Finally, note that a priori the observed 47 inter-module interactions are particularly susceptible to be false-positives, because a false-positive interaction between two random unrelated proteins is likely to result in an inter-module, high traffic interaction. However, significantly, 45 out of these 47 inter-module interactions belong to the set of interactions supported by small-scale targeted experiments and arguably it is not very likely that a false-positive interaction of the type just described would go unnoticed in a targeted experiment and further make it into the peer-reviewed literature. Of the remaining 2 inter-module interactions, one is reported in the Ito et al. [23] and Uetz et al. [22] high-throughput yeast two-hybrid data sets as well as in the MIPS data set of protein complexes identified via small or module scale experiments [21], while the other is reported in the Gavin et al. [27] high-throughput protein complex identification study and again in the Uetz et al. [22] yeast two-hybrid data set. Out of the 45 supported by small-scale experiments, 4 are also reported in a high-throughput yeast two-hybrid study [22, 23], 3 in a high-throughput protein complex identification study [27, 28] and 2 in the MIPS data set of protein complexes identified via small or module-scale experiments [21]. Whatever biological role central proteins turn out to play, we submit that they call for further experimental investigation, given their unique topological placement in the interactome.
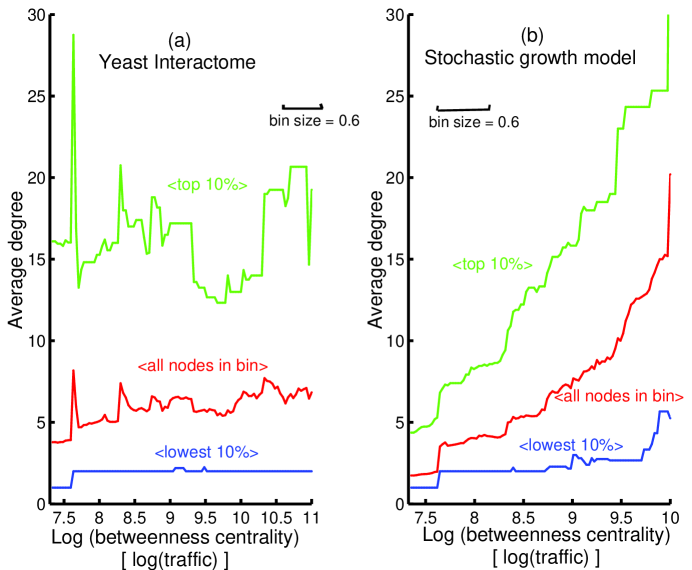
Having hierarchically classified the proteins with the traffic measure, we are now in a position to consider network degree distribution related questions without falling prey to previously noted statistical problems (Figure 1). Of particular interest is how degree changes as one moves hierarchically across the interactome [14] (Figure 3a). Surprisingly, nodes of different degree are rather homogeneously hierarchically spread across the interactome: note the large spread between the green, red and blue curves relative to their small positive slopes; or, for a more quantifiable attribute, how the 10% of nodes with the largest degree in the periphery of the interactome have a significantly larger degree than the average degree at the center of the interactome. Thus, the interactome is not hierarchically stratified by degree. In particular, the interactome has a non-hub-centric hierarchical organization. Further, note that should the inter-module protein interactions indeed represent a form of functional coordination, then this coordination is apparently occurring overwhelmingly in a pair-wise fashion: out of the 76 proteins that possess links to modules outside their own, only 4 connect their home module to more than one other module (TAF25 and SRP1 have links to 4 other modules, NUP1 and CLB2 to 2 other modules). The other 72 proteins connect their home module to a single other module (Supp. Mat.). It is also noteworthy that, amongst these 76 connecting proteins, the higher degree ones in general belong clearly in their assigned home modules (specifically, for connecting proteins of degree 4 or higher, let us exclude the 2 interactions that each of these proteins must have by default to connect it to its home module and to one linked module; then, 95.3% of the remaining interactions of connecting proteins are with the protein’s respective home module. Supp. Mat.) This pair-wise-coordination is in sharp contrast with the picture of a hub protein connecting and mediating multiple modules [11, 43, 44].
The non-hub-centric organization runs contrary to a number of network growth models that have been proposed to explain the topology of the interactome [11, 45, 46, 47, 48]. The models are based on evolution by stochastic gene duplication and divergence [49, 50]. Amongst other reproduced statistics, the models are able to generate the power-law degree distribution observed in early interactome data sets [51]. Since these models do not make appeal to evolutionary selection pressures, a major conclusion taken from their success was that natural selection is not required to reproduce the global structure of the interactome; instead, stochastic gene duplication and divergence suffices to give rise to that topology [45, 47]. However, here we report that these gene duplication models lead to hierarchically hub-centric networks. In Figure 3b, we show data pertaining to an interactome built using the model of Pastor-Satorras et al. [45]. By comparison with the same plot for the yeast interactome, this time the network is clearly stratified by degree, with the larger degree nodes concentrated at the hierarchical center of the network. Now it is the average degree at the center of the network that is significantly larger than the average degree of the 10% of nodes with largest degree at the periphery. The models of Vázquez [46] (slightly different implementation of the gene duplication and divergence process), and of Wagner [47] (emphasizing a continuous divergence in the form of gain and loss of interactions amongst existing proteins) produce similar hub-centric networks (Supp. Mat.). In summary, there are at least three possible explanations for the non-hub-centric hierarchy we observe in yeast: i) it is a spurious effect associated with the limitations of existing data and the interactome is in fact hub-centric; ii) there is some crucial feature of the gene duplication and divergence mechanics that is not understood and/or is not captured by current models; or iii) the non-hub-centric hierarchy is in fact shaped by natural selection pressures on the global interactome structure.
Our study is based on the present-day knowledge of the yeast interactome, which is still rather deficient [52, 53, 54, 55, 56, 57, 58]. We minimized false-positives by using the higher confidence yeast FYI data set as the source for our study. The good correspondence between the topological modular breakdown of the interactome and the known functional annotation of proteins corroborates that false-positives are not an overriding problem in this data set. Nonetheless, we repeated the interactome analysis using a data set of interactions reported in the MIPS database that are validated through small-scale screenings, the most reliable source of data [55] (giant component: 392 proteins, 675 interactions. Supp. Mat.). The correspondence between topological and functional modules (now on average 92% of the proteins in a module shared a similar function based on their MIPS classification), as well as the reported non-hub-centric hierarchy were again supported by this small-scale data set (Supp. Mat.). Regarding the limited coverage of our data sets (FYI % coverage, small-scale % coverage, assuming proteins in yeast [23]), it is of note that the doubling in size of the network, going from the small-scale to the FYI data set, did not dilute the observed non-hub-centric topology nor the pair-wise inter-module connectivity pattern. In fact, the FYI data set produces an even slightly less hub-centric interactome than the small-scale data set (Supp. Mat.). Likewise, the pair-wise inter-module connectivity pattern is no less present in the FYI than in the small-scale data set (where out of the 47 proteins with inter-module links, 4 connect their home module to more than one other module. Supp Mat.). The observation that higher degree connecting proteins are in general strongly attached to their home modules is equally confirmed in both data sets (the earlier mentioned 95.3% of home module interactions for the FYI higher degree connecting proteins, now becomes 95.7% in the small-scale data set). Still, it is important to bear in mind the limitations of current data sets. For instance, regarding the typical pair-wise coordination, the possibility that this observation is only the result of a high-number of false-negatives for inter-module protein interactions cannot be ruled out. Note, for example, how in the map there are no interactions between the translation initiation module and the ribosomal subunit modules, even though such interactions must certainly exist. Ultimately, only the generation of more accurate and comprehensive interactome data sets can unequivocally confirm or disprove some of the results and hypotheses put forward in this article [52, 53].
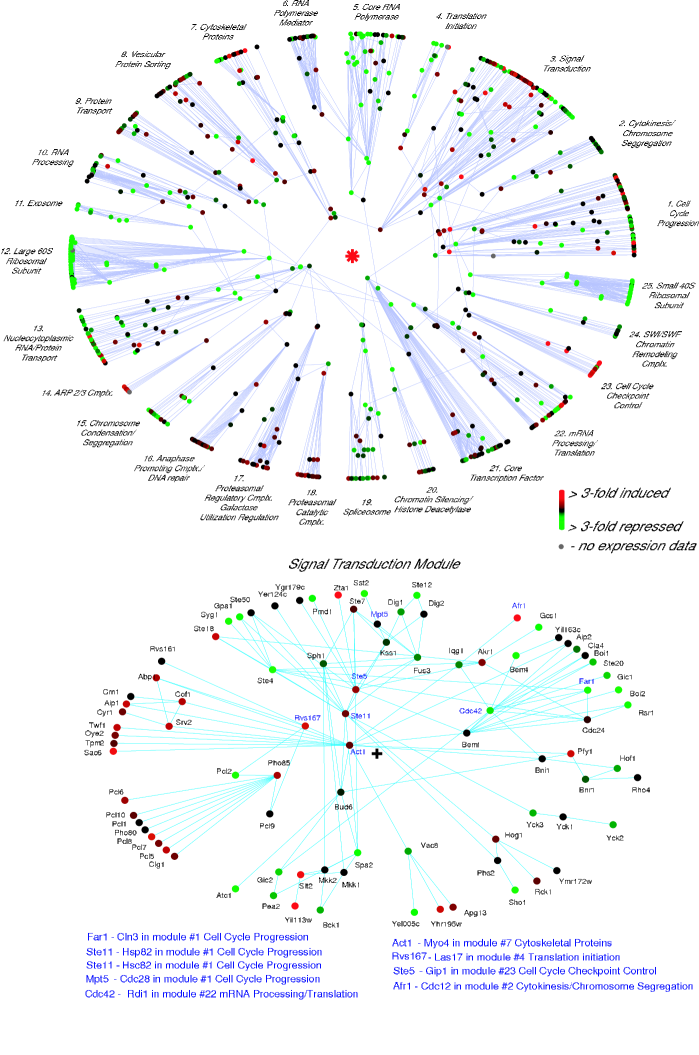
So far our analysis has focused on the global interactome topology. Now we would also like to highlight its potential as a framework for exploiting the wealth of interactome data. The interactome can form a valuable platform for crystalizing biological thought. We briefly introduce two relevant extensions to our work. First, one may zoom into a module of interest in the interactome and locally repeat the analysis, producing a single module polar map (Figures in Supp. Mat.). Such a local map provides one with a starting point to discuss the biology of the process under study, interpret and design experiments, and generate new biological hypotheses. Second, we note that the entire proteome is rarely, if ever, evenly expressed by the cell [49]. Therefore, perhaps the interactome is best viewed as a potential network at the cell’s disposal, with different parts of it being turned on and off to different degrees, as biologically required. Integrating mRNA expression data with the interactome polar map [59] (Figure 4), permits a proper, unified analysis of this dynamical network.
The interactome represents an elementary abstraction of the multitude of complex biochemical interactions taking place in the rich physiological environment of the cell.
In the trade-off between simplicity and realism, arguably some facts may be beneficially incorporated in future interactome models: For instance, protein interactions vary within a continuum of binding affinities and post-translational modifications as well as allosteric interactions effectively change the possible binding partners of a protein, to name a few of the more prominent omissions at present [49].
We end by noting that the organization of a network through a procedure akin to the one used in this paper may also be of relevance to the problem of network motif finding [60], as certain motifs may turn out to occur sparsely overall and yet be statistically significant in specific regions of the network (for example, only in the high traffic central area, or only in a particular module).
Acknowledgments - A. Valente thanks above all R. Fagerstrom, but also A. Sarkar S. Milstein, P.-O. Vidalain, M. Drezje, J. Han, S. Tee, K.-H. Lin and M. Boxem for comments and support, as well as the entire Vidal lab at Dana-Farber for its hospitality during part of the year. Finally, I am indebted to Howard Stone at Harvard University, under whose orientiation I initiated this work, and to Phil Prorok, Gary Gao and Xiaoxia Lin for their unconditional support at a critical stage of this work. This work was supported by DFCI Sponsored Research.
References
- [1] Eisenberg D, Marcotte EM, Xenarios I, Yeates TO (2000) Protein function in the post-genomic era. Nature 405: 823-826.
- [2] Lu H, et al. (2004) The interactome as a tree - an attempt to visualize the protein-protein interaction network in yeast. Nucleic Acids Res 32: 4804-4811.
- [3] Vidal M (2001) A biological atlas of functional maps. Cell 104: 333-339.
- [4] Bader GD et al. (2003) Functional genomics and proteomics: charting a multidimensional map of the yeast cell. Trends Cell Biol 13, 344-356.
- [5] Sharom JR, Bellows DS, Tyers M (2004) From large networks to small molecules. Curr Opin Chem Biol 8: 81-90.
- [6] Tucker CL, Gera JF, Uetz P (2001) Towards an understanding of complex protein networks. TRENDS in Cell Biology 11: 102-106.
- [7] Alberts B (1998) The cell as a collection of protein machines: preparing the next generation of molecular biologists. Cell 92: 291-294. 2).
- [8] Bork P, et al. (2004) Protein interaction networks from yeast to human. Curr Opin Struc Biol 14: 292-299.
- [9] Gavin A-C, Superti-Fuga G (2003) Protein complexes and proteome organization from yeast to man. Curr Opin Chem Biol 7: 21-27.
- [10] Han JDJ, et al. (2004) Evidence for dynamically organized modularity in the yeast protein-protein interaction network. Nature 430: 88-93.
- [11] Barabási A-L, Oltvai ZN (2004) Network biology: understanding the cell’s functional organization. Nature Rev Genet 112: 101-114.
- [12] Newman MEJ (2003) The structure and function of complex networks. SIAM Rev 45: 167-256.
- [13] Freeman L, (1977) A set of measures of centrality based upon betweenness. Sociometry 40: 35-41.
- [14] Joy MP, Brock A, Ingber DE, Huang S (2005) High betweenness proteins in the yeast protein interaction network. J Biomed Biotechnol 2: 96-103.
- [15] Hahn MW, Kern AD (2005) Comparative genomics of centrality and essentiality in three eukaryotic protein interaction networks. Mol Biol Evol 22: 803-806.
- [16] Hartwell LH, Hopfield JJ, Leibler S, Murray AW (1999) From molecular to modular cell biology. Nature 402: C47-C51.
- [17] Newman MEJ, (2004) Fast algorithm for detecting community structure in networks. Phys Rev E 69: Art. No. 066133.
- [18] Clauset A, Newman MEJ, Moore C (2004) Finding community structure in very large networks. Phys Rev E 70: art. no. 066111.
- [19] Brandes U (2003) Communicating centrality in policy network drawings. IEEE T Vis Comput Gr 9: 241-253.
- [20] Goh K-I, Kahng B, Kim D (2001) Universal behavior of load distribution in scale-free networks. Phys Rev Lett 87: art. no. 278701.
- [21] Mewes HW, et al. (2002) MIPS: a database for genomes and protein sequences. Nucleic Acids Res 30: 31-34.
- [22] Uetz, P. et al. A comprehensive analysis of protein-protein interactions in Saccharomyces cerevisiae. Nature 403, 623-627 (2000).
- [23] Ito, T. et al. A comprehensive two-hybrid analysis to explore the yeast protein interactome. Nature 403, 623-627 (2000).
- [24] von Mering, C. et al. Comparative assessment of large-scale data sets of protein-protein interactions. Nature 417, 399-403 (2002).
- [25] Marcotte, E. M., Pellegrini, M., Thompson, M., J., Yeates, T. O., & Eisenberg, D. A combined algorithm for genome-wide prediction of protein function. Nature 402, 83-86 (1999).
- [26] Dandekar, T., Snel, B., Huynen, M. & Bork, P. Conservation of gene order: a fingerprint of proteins that physically interact. Trends Biochem Sci 23. 324-328 (1998).
- [27] Gavin, A.-C. et al. Functional organization of the yeast proteome by systematic analysis of protein complexes. Nature 415, 141-146 (2002).
- [28] Ho, Y. et al. Systematic identification of protein complexes in Saccharomyces cerevisiae by mass spectrometry. Nature 415, 180-183 (2002).
- [29] Krause K, von Mering C, Bork P, Dandekar T (2004) Shared components of protein complexes - versatile building blocks or biochemical artefacts? BioEssays 26: 1333-1343.
- [30] Soti C, Pal C, Papp B, Csermely P, (2005) Molecular chaperones as regulatory elements of cellular networks. Curr Opin Cell Biol 17: 210-215.
- [31] Schwikowski B, Uetz P, Fields S (2000) A network of protein-protein interactions in yeast. Nat Biotechnol 18: 1257-1261.
- [32] Rives AW, Galitski T (2003) Modular organization of cellular networks. Proc Natl Acad Sci USA 3: 1128-1133.
- [33] Bu D, et al. (2003) Topological structure analysis of the protein-protein interaction network in budding yeast. Nucleic Acids Res 31: 2443-2450.
- [34] Vázquez A, Flammini A, Maritan A, Vespignani A (2003) Global protein function prediction from protein-protein interaction networks. Nat Biotechnol 21: 697-700.
- [35] Spirin V, Mirny A (2003) Protein complexes and functional modules in molecular networks. Proc Natl Acad Sci USA 21: 12123-12128.
- [36] Zhou H (2003) Distance, dissimilarity and network community structure. Phys Rev E 67: art. no. 06101.
- [37] Pereira-Leal JB, Enright JA, Ouzounis CA (2004) Detection of functional modules from protein interaction networks. Proteins 54: 49-57.
- [38] Brun C, Herrmann C, Guénoche A (2004) Clustering proteins from interaction networks for the prediction of cellular functions. BMC Bioinformatics 5: Art. No. 95.
- [39] Dunn R, Dudbridge F, Sanderson CM (2005) The use of edge-betweenness clustering to investigate biological function in protein interaction networks. BMC Bioinformatics 6: Art. no. 39.
- [40] Nabieva E, Jim K, Agarwal A, Chazelle B, Singh M (2005) Whole-proteome prediction of protein function via graph-theoretic analysis of interaction maps. Bioinformatics 21: I302-I310 Suppl. 1.
- [41] Winzeler EA, et al. (1999) Functional characterization of the S. cerevisiae genome by gene deletion and parallel analysis. Science 285: 901-906.
- [42] Giaever G, et al. (2002) Functional profiling of the Saccharomyces cerevisiae genome. Nature 418: 387-391.
- [43] Jeong H, Mason SP, Barabási A-L, Oltvai ZN (2001) Lethality and centrality in protein networks. Nature 411: 41-42.
- [44] Ravasz E, Barabási A-L (2003) Hierarchical organization in complex networks. Phys Rev E 67: Art. no. 026112.
- [45] Pastor-Satorras R, Smith B, Solé RV (2003) Evolving protein interaction networks through gene duplication. J Theor Biol 222: 199-210.
- [46] Vázquez A, Flammini A, Maritan A, Vespignani A (2003) Modeling protein in teraction networks. Complexus 1: 38-44.
- [47] Wagner A (2003) How the global structure of protein interaction networks evolves. P Roy Soc Lond B Bio 270: 457-466.
- [48] Middendorf M, Ziv E, Wiggins CH (2005) Inferring network mechanisms: the drosophila melanogaster protein interaction network. Proc Natl Acad Sci USA 102: 3192-3197.
- [49] Alberts B, Johnson A, Lewis J, Raff M, Roberts K and Walter P (2002) Molecular Biology of the Cell. 4th ed. Garland Science, N.Y. (2002).
- [50] Ohno S (1970) Evolution by gene duplication. Springer, Berlin.
- [51] Tanaka R, Yi T-M, Doyle J (2005) Some protein interaction data do not exhibit power law statistics. FEBS Lett 579: 5140-5144.
- [52] Cornell M, Paton NW, Oliver SG (2004) A critical and integrated view of the yeast interactome. Comp Funct Genom 5: 382-402.
- [53] Hakes L, Robertson DL, Oliver SG (2005) Effect of dataset selection on the topological interpretation of protein interaction networks. BMC Genomics 6: 131.
- [54] Ito T, et al. (2002) Roles for the two-hybrid system in exploration of the yeast protein interactome. Mol Cell Proteomics 1: 561-566.
- [55] von Mering C, et al. (2002) Comparative assessment of large-scale data sets of protein-protein interactions. Nature 417: 399-403.
- [56] Bader GD, Hogue CW (2002) Analyzing yest protein-protein interaction data obtained from different sources. Nat Biotechnol 20: 991-997.
- [57] Aloy P, Russell RB (2002) The third dimension for protein interactions and complexes. Trends Biochem Sci 27: 633-638.
- [58] Edwards AM, et al. (2002) Bridging structural biology and genomics: assessing protein interaction data with known complexes. Trends Genet 18: 529-536.
- [59] Lichtenberg U, Jensen LJ, Brunak S, Bork P (2005) Dynamic complex formation during the yeast cell cycle. Science 307: 724-727.
- [60] Milo R, et al. (2002) Network motifs: simple building blocks of complex networks. Science 298: 824-827.
- [61] Maslov S, Sneppen K (2002) Specificity and stability in topology of protein networks. Science 296: 910-913.
- [62] Gasch AP, et al. (200) Genomic expression programs in the response of yeast cells to envoironmental changes. Mol Biol Cell 11: 4241-4257.