Non-Maxwellian velocity distribution and anomalous diffusion of in vitro kidney cells
L. Diambra1,∗, L. C. Cintra1, D. Schubert2, and L. da F. Costa1
1Instituto de Física de São Carlos, Universidade de São Paulo
Caixa Postal: 369, cep: 13560-970, São Carlos SP, Brazil.
2The Salk Institute,
10010 N. Torrey Pines Road, La Jolla, CA 92037, USA.
Keywords: Anomalous diffusion, Cell motion, Cell adhesion.
Abstract
This manuscript uses a statistical mechanical approach to study the effect of the adhesion, through MOCA protein, on cell locomotion. The MOCA protein regulates cell-cell adhesion, and we explore its potential role in the cell movement. We present a series of statistical descriptions of the motion in order to characterize the cell movement, and found that MOCA affects the statistical scenario of cell locomotion. In particular, we observe that MOCA enhances the tendency of joint motion, inhibits super-diffusion, and decreases overall cell motion. These facts are compatible with the hypothesis that the cells move faster in a less cohesive environment. Furthermore, we observe that velocity distribution tails are longer than those predicted by Maxwell-Boltzmann in all cases studied here, indicating that cell movement is more complex than that of a liquid.
∗: Corresponding author. Email Address: diambra@if.sc.usp.br. FAX: +55 16 3373 9879.
I Introduction
Cell motility has an important role in many biological processes. On the basis of Abercrombie’s work (1970) aber70 and subsequent studies, the cell motility cycle can be defined mainly by five steps: (i) the cells polarize towards a chemo-attractant signal, eliciting localized actin polymerization reve04 ; welc97 ; ii) there is a cell surface rearrangement to form a protrusion sant02 ; iii) the protrusion makes contact with the extracellular matrix, or a neighboring cell, to form an adhesion site mcne93 ; iv) there is an actomyosin-based contraction, resulting in the development of tension between the adhesion sites kobi04 . The last step depends on further signals that will determine one of two possible physiological consequences. The first one corresponds to the cell movement. In this case the fifth step is the detachment of the cell’s trailing edge to reinitiate the cycle again. The exact means by which the intracellular pathways that control each step of the cell motility still remain unclear and are the focus of intensive studies.
The locomotion of cells is involved in several physiological processes, such as the immune response negu96 , tumor spreading chic95 , cell sorting upad01 and nervous system development orou92 and also plays a key role in the pattern formation during most stages of development foty94 ; rieu98 . Cell movement is highly dependent upon the environment in which the cells are embedded. Cells moving as part of a compact cell aggregate interact strongly with each other, so that cell movement is the result of cell-to-cell interactions as well as interactions with the surrounding environment. The locomotory activity of individual cells in media involving low cell densities is, on the other hand, almost free of cell-to-cell interactions, but highly dependent on environmental effects. In both cases the balance of adhesion between cells and the extracellular environment plays a key role in defining the motion dynamics of individual cells.
By offering powerful models and measures capable of dealing with the movement of particles subject to intrinsic and external effects while accounting for several types of random behavior, statistical physics represents a unique perspective from which to approach cell movement glaz93 ; momb96 ; czir98 ; upad01 . By using concepts derived from statistical physics, it is possible to show that cells moving at random (random-walk) are characterized by simple diffusive processes. This simple type of movement provides the null hypothesis for the movement of cells in the absence of intrinsic or extrinsic influences. Previous work on cell locomotion has focused upon characterizing of the dynamics of both single cells or groups of cells. These studies have observed normal diffusive motion and Maxwellian velocity distributions momb96 ; rieu98 . Recently, upad01 reported anomalous diffusion associated to velocity distributions within the framework of the non-extensive thermodynamics in Hydra cells. This framework could be also useful to analyze the movement of cells following a chemotactic gradients.
This paper presents a statistical description of the locomotion of genetically modified human kidney 293T cells and a control cell line. The specific aim is to uncover the roles of the protein MOCA in the locomotion of these cells. MOCA (modifier of cell adhesion) is a protein with 40 sequence homology to DOCK-180, a protein that is involved in cell shape and movement via its indirect interaction with the cytoskeleton kash00 ; jali94 . Since the over-expression of DOCK-180 increases cell migration albe00 , it was asked if the expression of MOCA also influences cell motion. Recent observations suggest that MOCA may induce cytoskeletal reorganization and changes in cell adhesion by regulating the activity of Rac1 and N-cadherin name04 ; chen04 . The text provides a series of analytical methods and resulting insights about the locomotory properties of these cells.
II Materials and Methods
II.1 Cells and Time-Lapse
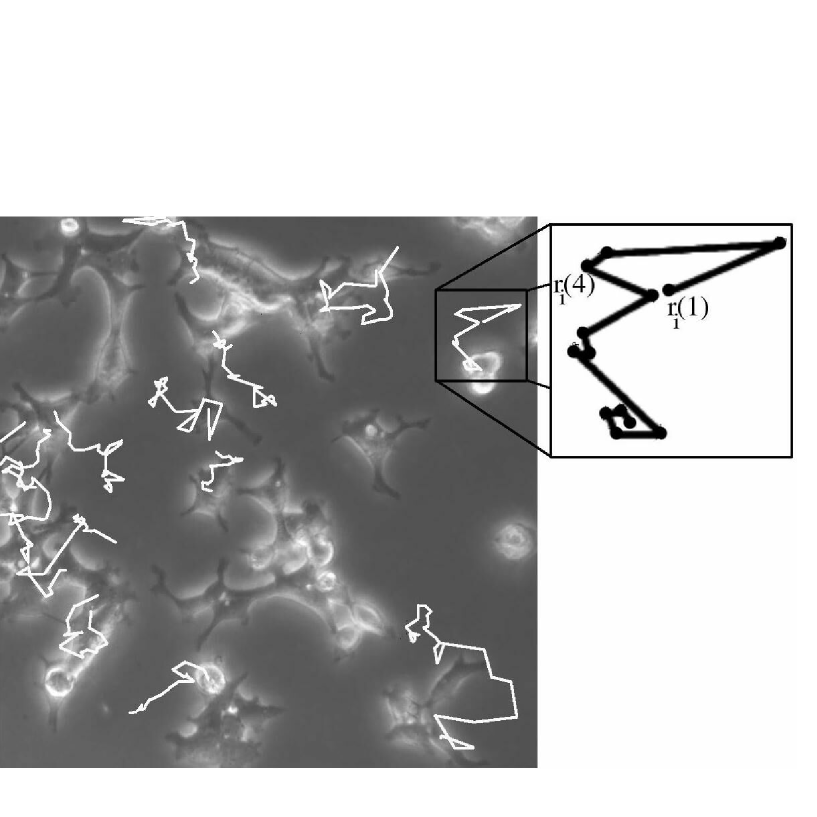
In the experiments reported here, we used clones of human kidney 293T cells (hereafter named 293T) clones genetically modified to express MOCA (293-MOCA). The stably transfected MOCA expressing cell line has been described chen02 . Cells were cultured on a laminin surface in a chamber associated with a microscope in order to capture images of cell movement. Since the phenotypic characteristics of the cells reflect their culture state, exponentially growing cultures were used at identical cell densities of cells per 35 mm culture dish (sparse). Both culture growth medium and the substratum influence cell shape and movement. Therefore the same experimental conditions were used in all situations. The maintenance of temperature and medium pH were accomplished by a heated stage and an enclosed culture chamber in which a humidified mixture of CO2 and air can be passed. The chamber was a modified cell culture chamber (Physitemp, Boston MA), and the experiment was done at 37 degrees Celsius. Experiments were recorded and translated into digital form by a time-lapse system at an interval of 35 min per frame of 1022x1280 pixels. The time-lapse system consisted of a digital camera (Hamamatsu) attached to an inverted microscope (Leitz DMIRB, using a phase contrast lens), and software for image capture (OPENLAB by Improvision). With this setup three movies were made in the experimental conditions indicated above. Two corresponding to 293-MOCA (denoted by 293-MOCA-A, 293-MOCA-B), and one corresponding to the control cells 293T (293T-C). Hereafter these movies will be denoted as experiments A, B and C respectively. Before being statistically characterized, the movies cells undergo preprocessing to remove noise, artifacts and enhance the contrast. Later, each individual frame is extracted from the video sequence in order to facilitate the cell segmentation and the reconstruction of cell trajectories. The task of separating cell from background, (segmentation) was done using a semi-automatic procedure, where a preliminar segmentation is performed by a software application and then improved through human intervention. This software application was developed in Delphi in order to assisting the operator to mark the soma center of mass for each moving cell reconstruct the cell trajectory. Fig. 1 shows some of the trajectories superposed onto the initial acquired frame. Table 1 shows the number of cells followed and the corresponding number of frames in each experiment.
II.2 Statistical methods
With the aim of applying statistical approaches to the study of cellular locomotory activity, long-term cell migration patterns were recorded in monolayer cultures. The two-dimensional cell position was extracted from frames taken each 35 minutes () from time-lapse movies by using a computer program. The trajectory of the cell is denoted by . The velocities were estimated by using the mean velocity definition .
For each experiment we studied: (i) the averaged cell displacements, (ii) the temporal and spatial correlation function of velocities, and (iii) the distribution of velocities. The mean square displacement over cells in a given experimental setup is given by
| (1) |
which implies , where is an effective diffusivity, is an exponent which indicates normal diffusion, like a random walk (), or anomalous diffusion (). We measured the effective constant and the exponent by determining the linear parameters of the plot vs : the slope is and the y-axis intercept is . The total displacement of cells was estimated through the average total path length travelled by the cells in each case. is the sum of the arc length covered by the cell, and can be estimated as the sum of the distance between the subsequent positions along the trajectory. In this way we avoid extracting a conclusion about cell motion only from the effective diffusivity , which could introduce wrong conclusions when one compares normal and anomalous diffusion processes. Low values of associated to anomalous diffusion could be not related to slow locomotion.
When , the cells undergo normal diffusion motion like a random walk. Anomalous diffusion can also be identified by the following two situations: (i) , corresponding to sub-diffusion, and (ii) , which corresponds to super-diffusion. Anomalous diffusion can be induced by temporal or spatial correlations bouc90 . For this reason, we examined the temporal autocorrelation function and the correlation of velocities of two pairs of neighbor cells. The former is computed by averaging the autocorrelation functions over the two components and over all cells in each experiment
| (2) |
In order to compute the correlation of velocities, we estimate the velocities of all cell pairs whose distance are less than , i.e., , where was taken 25 . Then the Pearson coefficient and the significance were computed over the scatter plot versus. including both velocity components. This correlation can be used to address the question: Do two neighbor cells travel together more frequently than cells that are far away from one another?
We also studied the underlying thermodynamics of the motion by calculating the histogram for the velocity distribution of the cells, obtained by summing the histograms of individual cells in each experiment. We fit them to the function , which correspond to the functional form of the Maxwell distribution function for the velocities of particles in a gas in two dimensions.
III Results
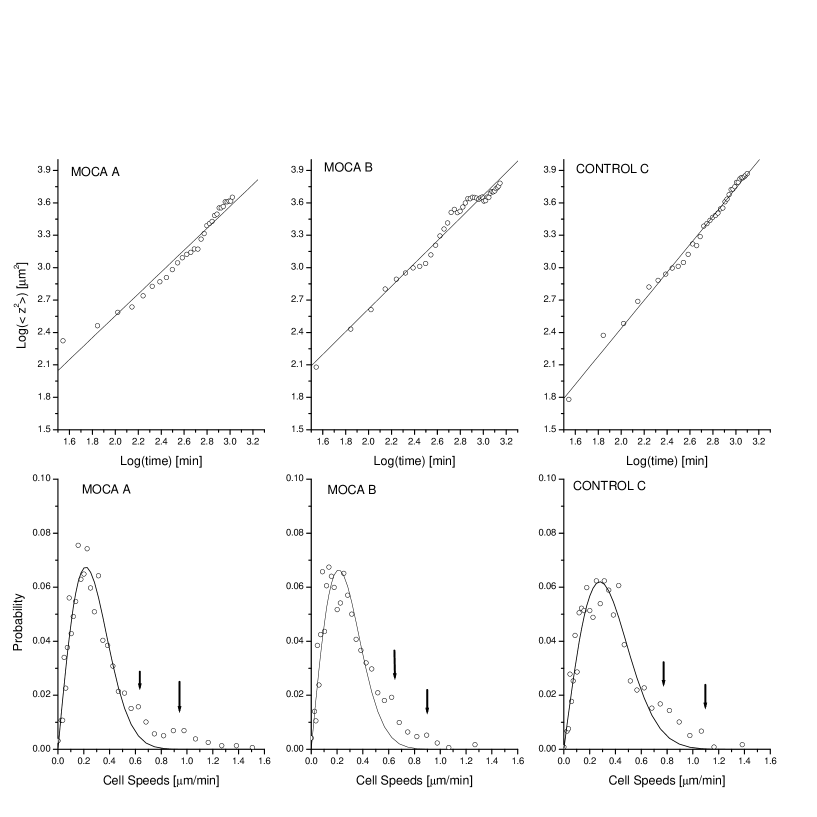
The following paragraphs details our analysis of the statistical properties of the cell motion. The top panels of Fig. 2 show the mean square displacement as a function of time. Table 1 shows the number of cells tracking in each experiment, the effective diffusivity constants and exponents. In the 293-MOCA cases the cells execute a random walk associated with a normal diffusive behavior as indicated by , while the exponent corresponding to the cell motion in experiment C is , suggesting super-diffusion motion, i.e. the cell movements are less random (coherent motion). Moreover, in case C, the constant was 0.7 m2/min, substantially smaller than for the cases A and B, where the values were 3.4 m2/min and 3.3 m2/min respectively. Comparing effective diffusivities may easily produce an incorrect interpretation since the diffusion process in 293-MOCA cells seems to be normal, while in control cells seems to be anomalous. For this reason we also computed the average total length in each case. Table 1 shows the average path length for each experiment. In case C, the constant was 302 m, substantially higher than for the cases A and B, where the values were 240 m and 250 m respectively, indicating that the cell displacement in the control case is greater than in 293-MOCA cells. Moreover, bottom panels of Fig. 2 show the histograms of the speeds and respective fitting by the Maxwell distribution. The velocity distributions over the considered time scales ( = 35 min) follow essentially the 2D Maxwell-Boltzmann thermodynamics. However, in all cases the experimental distribution have small peaks around 0.6 m/min and 0.9 m/min in both 293-MOCA cases, and around 0.8 m/min and 1.1 m/min in the 293T cells, as indicated by the arrows. As a consequence, the distributions present a longer tail than the corresponding Maxwelian distribution, which has been observed in other experiments (Fig. 3a in upad01 ) and Fig. 3 in rieu98 . We should also note that the velocity distribution associated with 293T cells is characterized by higher velocities than in the 293-MOCA cases, which seem to be slower. These observations agree with those obtained from estimation, as shown in Table 1.
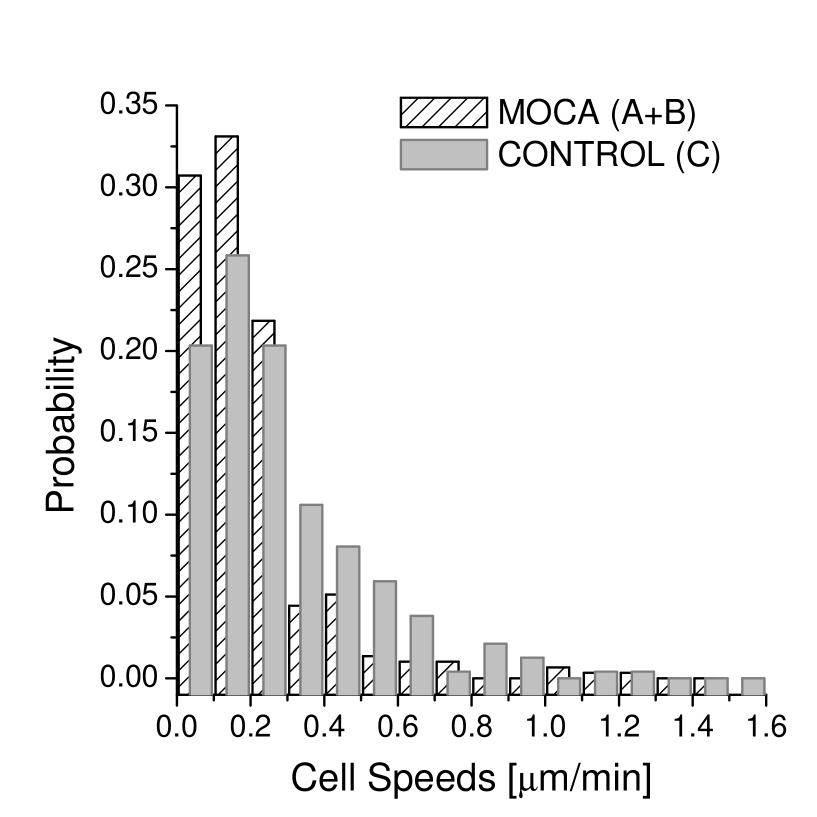
In order to avoid cell-cell adhesion effects on the characterization of the cell motion, we also computed the velocity distributions for non-interacting cells in each experiment. We considered all pieces of trajectories where each cell appears isolated in order to improve the number of events. The ANOVA test reveals that 293-MOCA cell mean velocity (m/min) is significatively lower than 293T cells mean velocity (m/min), with a significance level . The corresponding histograms are shown in Fig. 3. This result shows that MOCA expression slows cell locomotion on laminin surfaces relative to control cells independently of cell-cell contact. It should be notice that the mean velocities observed for non-interacting cells are smaller than the mean velocities computed including cells touching each other (see Table 1).
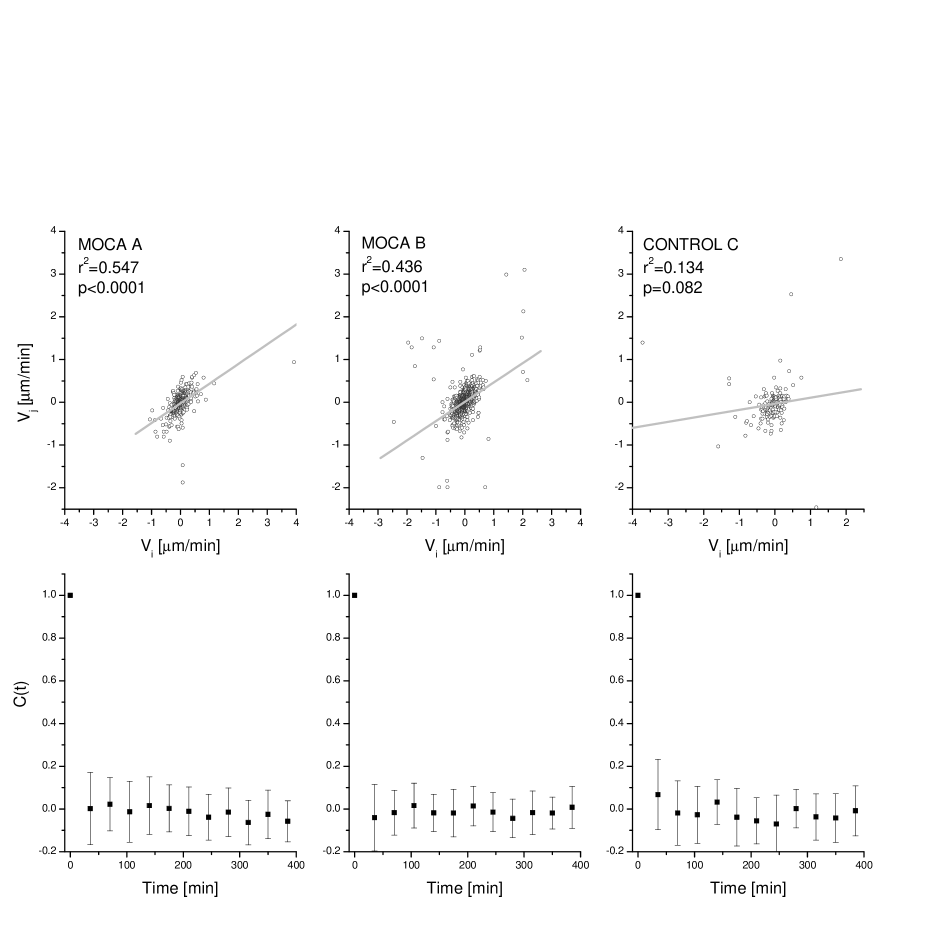
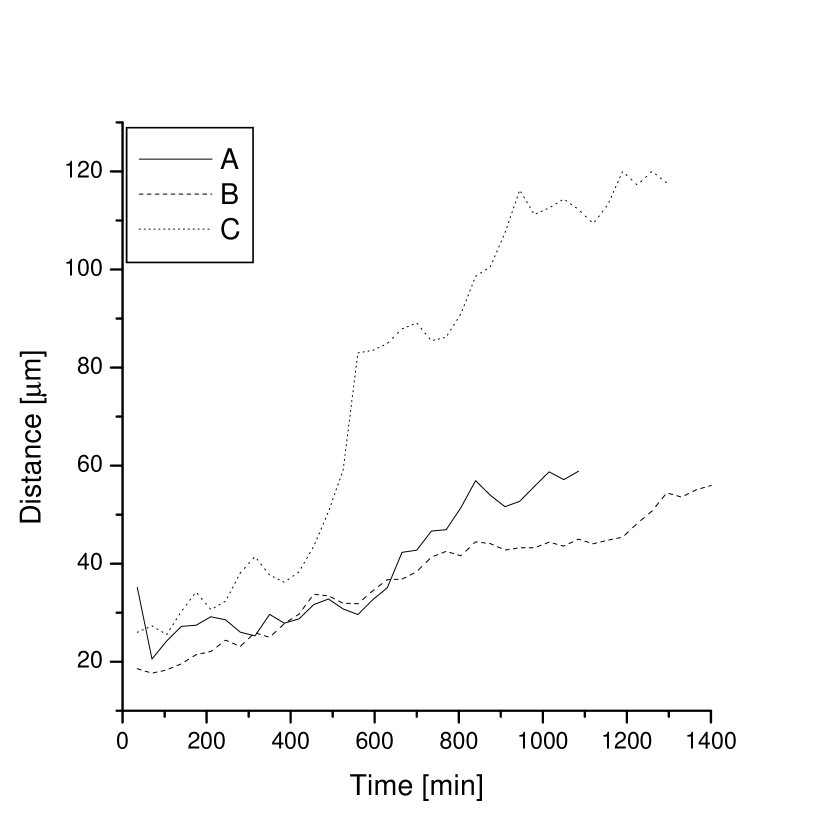
We have also calculated the temporal and spatial correlation functions of the velocities. The bottom panel of Fig. 4 shows the temporal auto-correlation of velocities, which decays very rapidly, suggesting that temporal correlations are unlikely to be the cause of the anomalous diffusion observed in experiment C. The top panel of Fig. 4 depicts the velocities correlogram for all pairs of cells that are no further than m apart. For 293-MOCA cells (experiments A and B, top panel of Fig. 4), the velocity components of a cell are correlated to the velocity component of neighbors cells at the significance level of . In contrast, the velocities of two neighboring control cells are not correlated as shown at right of the bottom panels of Fig. 4. This means that 293-MOCA cells travel together more frequently than 293T cells. These data show that the MOCA protein may be involved with cell-cell in adhesion and that it also influences cell movement. This conclusion is also supported by Fig. 5, which depicts the mean distance between cells which were no further apart than m in the initial frame as a function of time. It is clear from this result that the 293-MOCA cells remain closer together than the wild type.
IV Discussion and Conclusion
Cell movement requires a series of highly coordinated events that are powered by the actin cytoskeleton and regulated by a complex group of kinases and phosphatases (for reviews see mogi02 ).MOCA is an abundant protein that is found in the hippocampus and other cortical areas of the brain kash00 . Recently has been demonstrated that the expression of MOCA is required for neurite outgrowth in both PC12 cells and central nervous system neurons chen04 . The above data show that the expression of MOCA in 293T cells, that normally lack this protein, leads to two changes: i) a decrease the cell motion and ii) an increase the co-migration with neighboring cells. The decrement of the overall displacement in isolated 293-MOCA cells (Fig. 3) suggests that first conclusion could not to be a consequence of an increase in MOCA induced cell-cell adhesion. The second set of results are, however consistent with our data demonstrating that MOCA increases N-cadherin-mediated cell-cell adhesion chen04 . In contrast, the over expression of DOCK-180 leads to increased cell migration albe00 , establishing that the function of the two proteins are distinct.
The results presented here establish that MOCA protein expression modifies two important aspects of cell movement. The measurements clearly indicate that MOCA tends, by enhancing of joint motion, to inhibit the super-diffusion behavior observed in the wild type cells. The broader distributions of velocities for that case could be the reason for super-diffusion. In fact, wild type cells have higher velocity than the modified cells. Furthermore, the spatial correlations of the cell velocities show that two neighboring 293-MOCA cells travel together more frequently than two control cells, and that their velocities are quite correlated. These facts are compatible with the hypothesis that the cells move faster in a less cohesive environment.
We also determined the temporal autocorrelation of the velocity. In all cases we obtained a single narrow peak at null lag, reasonably approximating a delta function. The correlation time for the velocity was shorter than the measurement interval used in the experiments (35 min), agreeing with the hypothesis of time-uncorrelated velocities in Brownian motion. Preliminary results on shorter time scales (5 min) do not suggest correlations.
Finally, the observation that the experimental distribution tails are longer than those predicted by Maxwell-Boltzmann thermodynamics in all cases studied here, agrees with results in previous studies upad01 ; rieu98 . This fact could be a statistical indication that cell movement is more complex than that of a liquid.
Acknowledgements
Luciano da F. Costa is grateful to FAPESP (proc. 99/12765-2), CNPq (proc. 301422/92-3) and Human Frontier Science Program for financial support. Luis Diambra thanks the Human Frontier Science Program for his post-doc grant.
References
- (1) M. Abercrombie, J.E. Heaysman and S.M. Pegrum, Locomotion of fibroblasts in culture 1. Movements of leading edge. Exp. Cell Res. 59 (1970) 393–398.
- (2) C. Revenu, R. Athman, S. Robine and D. Louvard, The co-workers of actin filaments: from cell structures to signals Nature Reviews Molecular Cell Biology 5 (2004) 635–646.
- (3) M.D. Welch, A. Iwamatsu and T.J. Mitchison, Actin polymerization is induced by Arp2/3 protein complex at the surface of Listeria monocytogenes. Nature 385 (1997) 265–269.
- (4) J. Santos Da Silva and C.G. Dotti, Breaking the neuronal sphere: regulation of the actin cytoskeleton in neuritogenesis Nature Reviews Neuroscience 3 (2002) 694–704;
- (5) H. McNeill, T.A. Ryan, S.J. Smith and W.J. Nelson, Spatial and temporal dissection of immediate and early events following cadherin-mediated epithelial cell adhesion. J, Cell Biol. 120 (1993) 1217–1226.
- (6) A. Kobielak and E. Fuchs, a-catenin: at the junction of intercellular adhesion and actin dynamics. Nature Reviews Molecular Cell Biology 5 (2004) 614–625.
- (7) P.A. Negulescu, T.B. Krasieva, A. Khan, H. Kerschbaum and M.D. Cahalan, Polarity of T Cell Shape, Motility, and Sensitivity to Antigen. Immunity 4 (1996) 421–430.
- (8) M.R. Chicoine, D.L. and Silbergeld, The in-vitro motility of human gliomas increases with increasing grade of malignancy. Cancer 75 (1995) 2904–2909.
- (9) A. Upadhyaya, J.P. Rieu, J.A., Glazier and Y. Sawada, Anomalous diffusion and non-Gaussian velocity distribution of Hydra cells in cellular aggregates. Physica A 293 (2001) 549–558.
- (10) N.A. O’Rourke, M.E. Dailey, S.J. Smith and S.K. McConnell, Diverse migratory pathways in the developing cerebral cortex. Science 258 (1992) 299 -302.
- (11) R.A. Foty, G. Forgacs, C. Pfleger and M.S. Steinberg, Liquid properties of embryonic tissues: Measurement of interfacial tensions. Phys. Rev. Lett. 72 (1994) 2298 -2301.
- (12) J.P. Rieu, N. Kataoka and Y. Sawada, Quantitative analysis of cell motion during sorting in two-dimensional aggregates of dissociated hydra cells. Phys. Rev. E 57 (1998) 924–931.
- (13) J.A. Glazier and F. Graner, Simulation of the differential adhesion driven rearrangement of biological cells. Phys. Rev. E 47 (1993) 2128–2154.
- (14) J.C.M. Mombach, J.A. Glazier, Single Cell Motion in Aggregates of Embryonic Cells. Phys. Rev. Lett. 76 (1996) 3032–3035.
- (15) A. Czirók, K. Schlett, E. Madarász and T. Vicsek, Exponential distribution of locomotion activity in cell cultures. Phys. Rev. Lett. 81 (1998) 3038–3041.
- (16) A. Kashiwa, H. Yoshida, S. Lee, T. Paladino, Y. Liu, Q. Chen, R. Dargush, D. Schubert and H. Kimura, Isolation and characterization of novel presenilin binding protein. J. Neurochem. 75 (2000) 109–116.
- (17) K. Jalink, E.J. van Corven, T. Hengeveld, N. Morii, S. Narumiya and W.H. Moonlenauar, Inhibition of lysophosphatidate- and thrombin-induced neurite retraction and neuronal cell rounding by ADP ribosylation of the small GTP-binding protein Rho. J. Cell Biol. 126 (1994) 801–810.
- (18) M.L. Albert, J.L. Kim and R.B. Birge, alphavbeta5 integrin recruits the CrkII-Dock180-rac1 complex for phagocytosis of apoptotic cells. Nat. Cell Biol. 2 (2000) 899–905.
- (19) K. Namekata, Y. Enokido, K. Iwasawa and K. Kimura, MOCA induces membrane spreading by activating Rac1. J. Biol. Chem. 279 (2004) 14331–14337.
- (20) Q. Chen, T.-J. Chen, P.C. Letourneau, L. Costa, L. and D. Schubert, MOCA regulates N-cadherin-mediated cell-cell adhesion and neurite outgrowth. J. Neurosci. 24 (2005) 281–290.
- (21) Q. Chen, H. Kimura and D. Schubert, A novel mechanism for the regulation of amyloid precursor protein metabolism. J. Cell Biol. 158 (2002) 79–89.
- (22) J.P. Bouchaud and A. Georges, Anomalous diffusion in disordered media: statistical mechanisms, models and physical applications. Phys. Rep. 195 (1990) 127–293.
- (23) A. Mogilner and Leah Edelstein-Keshet, Regulation of Actin Dynamics in Rapidly Moving Cells: A Quantitative Analysis. Biophys. J. 83 (2002) 1237 -1258.
Figure Legends
Figure 1: Some cell trajectories superposed onto the initial acquired frame corresponding to experiment A. Inset: A sample trajectory enlarge containing 13 successive positions of cell .
Figure 2: Top panels: versus plots for each experiment. Bottom panels: Histogram of the 2D cell velocity distribution. The solid curve is a fit by the function (2D Maxwellian distribution). Arrows are indicating deviation from Maxwellian distributions. The left and center panels correspond to experiments A and B respectively, and the right panels correspond to experiment C.
Figure 3: Histogram of velocity for noninteracting cells. The dashed bars correspond to cell velocities from A and B experiment and solid grey bars correspond to cell velocities from experiment C.
Figure 4: Top panels: The paired velocity correlogram including both velocity components of all cell pairs whose distance are smaller than 25m in each experiment. In each case the correlation coefficient as well its significance is displayed. Bottom panels: The auto-correlation function , of the cell velocities. The left and center panels correspond to experiments A and B respectively, and the right panels correspond to experiment C.
Figure 5: Mean distance between cells whose initial distance were smaller than 25m as a function of time. A and B case in solid and dashed line respectively; C in dotted line.
Tables
| Experiment | of frames | of cells | [m/min] | [m] | [/min] | |
|---|---|---|---|---|---|---|
| A | 31 | 53 | 0.25 | 250 | 3.379 | 1.010.14 |
| B | 41 | 43 | 0.24 | 240 | 3.265 | 1.050.11 |
| C | 37 | 33 | 0.30 | 302 | 0.703 | 1.300.10 |