Protein folding rates correlate with heterogeneity of folding mechanism
Abstract
By observing trends in the folding kinetics of experimental 2-state proteins at their transition midpoints, and by observing trends in the barrier heights of numerous simulations of coarse grained, Cα model, Gō proteins, we show that folding rates correlate with the degree of heterogeneity in the formation of native contacts. Statistically significant correlations are observed between folding rates and measures of heterogeneity inherent in the native topology, as well as between rates and the variance in the distribution of either experimentally measured or simulated -values.
pacs:
87.15.Aa, 87.15.Ya, 87.15.He, 87.14.EeProtein folding is a relaxation process driven by a first order like fluctuation of a critical nucleus not (a). Because proteins are evolutionarily designed to fold to a particular structure, frustrating interactions are minimized and the folding process can be projected onto one or a few reaction coordinates without too much loss of information not (b). This projection yields a free energy surface whose structure is subject to much interest. Different proteins have different free energy surfaces with different barrier heights.
What factors determine the height of the folding free energy barrier for the various proteins? As one would expect, the barrier decreases as the energetic stability of the folded structure increases Dinner and Karplus (2001). Moreover folding rates tend to increase with energetic discrimination measures between the folded state and unfolded or misfolded decoys Mélin et al. (1999). As one might also expect, the barrier increases for native structures that have longer polymer loops formed during folding. A property capturing this effect, dubbed absolute contact order (ACO), measures the mean sequence separation between amino acids in close proximity (and thus interacting) in the native structure not (c): where and label amino acid index, (or 0) if amino acids and are (or are not) interacting in the native structure, and M is the total number of contacts in the native structure determined by either heavy side chain atoms or Cα atoms within a cut-off distance of 4.8 Å not (d).
In what follows we first re-examine the trend of rates with in light of theoretical predictions not (e); Plotkin and Onuchic (2000, 2002), then we will go on to further examine higher-order aspects of native topology (and energetics) that act as predictors of folding rate.
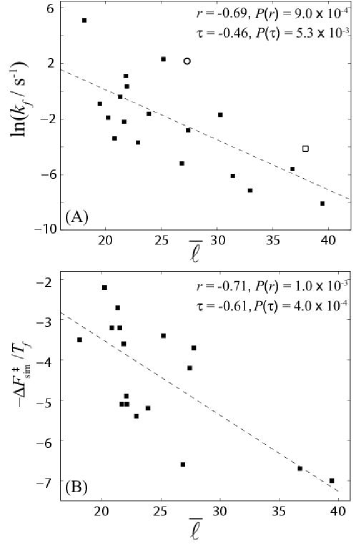
If we take data that first corrects for the effects of differing native stabilities for different proteins by adjusting denaturant concentration to conditions at the transition midpoint, and then plot the log folding rate , we find a statistically significant correlation for a representative set of 19 2-state proteins (and P13-14 circular permutant of S6) (Fig. 1A) not (f). Observations similar to this led the folding community to accept the idea that properties of native topology strongly determine folding rate not (g). Moreover if one simulates off-lattice Cα Gō models not (d) to 18 structures of known 2-state folders not (h), one also finds a statistically significant correlation between barrier height and absolute contact order (Fig. 1B). One also notices from Fig. 1 that there must be more to the story then absolute contact order in determining folding rates, since the fluctuations around the best fit line are significant.
The effects of native topology (and energetics) should be describable analytically as well. To this end a free energy functional approach was developed not (e); Plotkin and Onuchic (2000, 2002) within which it was shown that the free energy barrier may be written in terms of an expansion involving moments of distributions of native contact interaction energies , and native contact sequence separations . The lowest order corrections to the mean-field barrier are Plotkin and Onuchic (2002):
| (1) |
where , , are all positive and of order unity. The lowest order mean field term , where , are the first moments (mean) of the distributions, indeed increases as increases, consistent with the observed trend. The theory gives the slope of the mean field barrier as Plotkin and Onuchic (2002)
| (2) |
Calculating Eq. (2) for all proteins used in Fig. 1A, , which is consistent with the slope of the best fit line . The mean field slope for the proteins in Fig. 1B is which is almost twice the slope of the best fit line . There may be several reasons for this, including the fact that the theory used the mean field approximation, while the nucleus may be better approximated by a capillary model, and the Gaussian approximation for polymer loops used in the theory may be poor for many contacts. There may also be a cancellation of errors in Fig. 1A due to the presence of a capillary nucleus with many-body interactions present not (j), which would result in unexpectedly good agreement.
Second order terms in Eq. (1) involving the fluctuations of native energies and loop lengths contact to contact all tend to decrease the barrier, leading to the notion that proteins with more heterogeneous folding mechanisms should fold faster Plotkin and Onuchic (2000, 2002). We note that here a more heterogeneous folding mechanism corresponds to a more specific, polarized folding nucleus, i.e. the heterogeneity here refers to contact formation probability, not conformational diversity of the transition state. Earlier lattice-simulation studies Abkevich et al. (1994) as well as more recent experimental studies of circular permutants Lindberg et al. (2002) support the notion that a more polarized nucleus results in a faster folding protein.
We can readily check if the second moment of the loop length distribution has an observable effect on rates, even if we ignore variations due to different values protein to protein, as well as the terms with coefficients and in Eq. (1). The functional theory gives coefficient in Eq. (1) Plotkin and Onuchic (2002), so the change in barrier height due to the presence of structural variance is:
| (3) |
Here, is the overall fraction of native contacts, and is the value of at the barrier peak.
Plots of experimental log folding rate and simulated barrier heights (over ) both show statistically significant correlation with (Fig. 2).
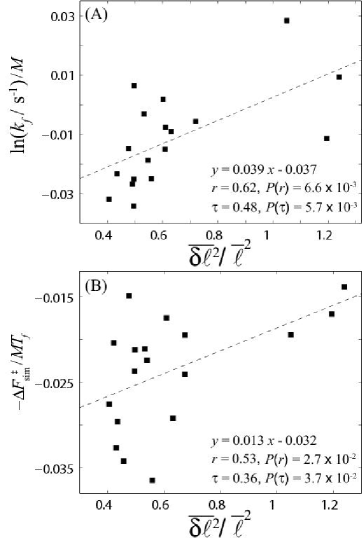
However there are large fluctuations present, and the slope of the best fit line is only about a tenth the theoretical prediction. Neglecting trends due to contact order and energetic variance introduces errors in the plots.
Experimentally measured -values Fersht (1999) involve both energetics and entropics and should better capture the effects of heterogeneity in folding mechanism. The variance in -values couples together the last 3 terms in Eq. (1). To facilitate a comparison of rates with -variance, the free energy barrier maybe recast in terms of the variance in native contact formation probabilities () Plotkin and Onuchic (2002)
| (4) |
Eq. (4) only includes the effects of heterogeneity in polymer loop length, however energetic heterogeneity can be incorporated as well, which only changes the coefficient in Eq. (4) to . The simulations have no variance in native contact energies, moreover statistics arguments suggest that this native variance may be significantly reduced with respect to the variance in collapsed random structures not (b).
-values may be defined analytically as Onuchic et al. (1996); not (j)
| (5) |
where , and are the probabilities of native contact formation between residues and in the unfolded, transition and folded states respectively.
In the approximation that all contacts are fully formed in the native structure (), and unformed in the unfolded structures (), the -value for residue is the mean of values in the transition state (c.f. Eq. (5)). Further approximating the same number of nearest neighbors for all residues, the variances are related by . If we make no approximations and simply plot vs. (for the simulation data), the quantities correlate extremely well (see Table I) with a slope of and an intercept . The intercept may be non-zero since other fluctuating quantities (e.g. , ) contribute to the variance of -values.
The above arguments indicate and are within a factor of approximately unity, so we rewrite Eq. (4) in the form
| (6) |
with a parameter of order unity.
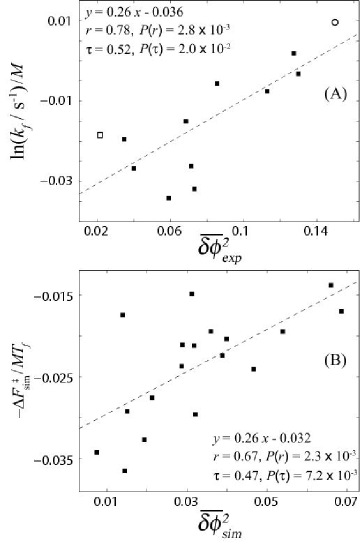
According to Eq. (6) more polarized nuclei have lower free energy barriers. Plots of for experiments and simulations are shown in Fig. 3. Here we see a strong statistically significant correlation of both rates and barriers with variance. Moreover the slopes of the best fit lines () compare somewhat more favorably with the theoretically predicted values () than was the case for structural variance. A precise comparison with experimental data is more difficult since the coordination number as well as the numbers and are not accurately known for all proteins. Taking the slope from Fig. 3A and using the approximations mentioned above allows us to infer the residue-residue coordination number: if energetic heterogeneity is negligible (Eq. (4)), if it is substantial (Eq. (4) with coefficient ).
The residuals of , when plotted against and , show comparable but typically slightly less significant correlation (within 10) to those in Fig. 2 and Fig. 3. The term can be thought of as a measure of these residuals. We have plotted absolute rates, which are easily measurable from experiments or simulations, while the mean-field barrier is not.
We note that has errors due both to experimental measurement as well as the small set of -values for each protein. Moreover the experimental rates at the transition midpoint are compared to the variance in ’s typically measured in water or stabilizing conditions. Interestingly, experimental folding mechanisms tend to be more polarized than uniform Gō models.
In the case of the simulations, the correlation between is strong as expected, since there is no variance in native contact energies, by construction of the model. For experimental data however the correlation is poor, which implies that there may be substantial energetic heterogeneity present in native contact energies of real proteins. It is not too surprising then that there is no correlation between the variance of experimental -values and simulation -values (see Table 1). In the analysis then, simulated barriers were plotted against simulated -variance, and experimental rates were plotted against experimental -variance.
We did not find any significant correlation between rates and structural variance for 3-state folders. Here there is the intriguing picture that (on-pathway) intermediates in 3-state folders are in fact induced by structural or energetic heterogeneity, so that there is no a priori reason for folding rates to continue to increase with increasing heterogeneity.
S6 displays significant correlation between native contact energies and native loop lengths Lindberg et al. (2002). For this reason we did not include it in Fig. 2A, which only includes a structural measure of heterogeneity- if it is included the correlation decreases to , . We note that the inclusion of the two data points corresponding to S6 does not change the correlation in Fig. 3A and decreases the correlation in Fig. 1A by .
We showed here that both experimental rates and simulated free energy barriers for 2-state proteins depend on the degree of heterogeneity present in the folding process. The results compared quite well with the predictions of the free energy functional theory Plotkin and Onuchic (2000, 2002). Heterogeneity due to variance in the distribution of native loop lengths, as well as variance in the distribution of -values, were both seen to increase folding rates and reduce folding barriers. The observed effect due -variance was the most statistically significant (as expected), because -variance captures both heterogeneity arising from native topology as well as that arising from energetics.
Acknowledgements.
S. S. P. acknowledges support from the Natural Sciences and Engineering Research Council and the Canada Research Chairs program. We thank Kevin Plaxco and Mikael Oliveberg for helpful discussions.| 1112-sided statistical significance has been used. | 1112-sided statistical significance has been used. | ||||
| -0.69 | 9 | -0.46 | 5.3 | ||
| -0.71 | -0.61 | 4 | |||
| 222Here we divide by the number of native contacts . Dividing instead by chain length gives correlations within 10. and correlate very strongly (). | 0.78 | 2.8 | 0.52 | 2 | |
| 0.67 | 2.3 | 0.47 | 7.2 | ||
| 0.62 | 6.6 | 0.48 | 5.7 | ||
| 0.53 | 2.7 | 0.36 | 3.7 | ||
| 333Data from both simulated and experimental proteins used. | -0.14 | 0.52 | -0.07 | 0.7 | |
| -0.64 | 2.5 | -0.43 | 5.5 | ||
| 0.16 | 0.52 | 0.15 | 0.38 | ||
| 0.71 | 0.32 | 6.4 | |||
| 0.29 | 0.37 | 0.18 | 0.41 | ||
| -0.16 | 0.8 | 0.2 | 0.63 | ||
| 0.94 | 0.77 | 9 |
References
- not (a) D. B. Wetlaufer, Proc Nat Acad Sci USA 70, 697 (1973), R. R. Matheson and H. A. Scheraga, Macromolecules 11, 819 (1978), V. I. Abkevich, A. M. Gutin and E. I. Shakhnovich, Biochemistry 33, 10026 (1994), A. R. Fersht, Proc Nat Acad Sci USA 92, 10869 (1995), P. G. Wolynes, Proc Nat Acad Sci USA 94, 6170 (1997), D. K. Klimov and D. Thirumalai, J Mol Biol 282, 471 (1998), O. V. Galzitskaya, D. N.Ivankov and A. V. Finkelstein, FEBS Lett 489, 113 (2001).
- not (b) S. S. Plotkin and P. G. Wolynes, Phys Rev Lett 80, 5015 (1998), S. S. Plotkin and J. N. Onuchic, Quart. Rev. Biophys. 35, 111 (2002), S. S. Plotkin and J. N. Onuchic, Quart. Rev. Biophys. 35, 205 (2002).
- Dinner and Karplus (2001) A. R. Dinner and M. Karplus, Nature Struct. Biol. 8, 21 (2001).
- Mélin et al. (1999) R. Mélin, H. Li, N. S. Wingreen, and C. Tang, J Chem Phys 110, 1252 (1999).
- not (c) Initially relative contact order (RCO) was used as a predictor of rates in water (K. W. Plaxco, K. T. Simons, I. Ruczinski and D. Baker, Biochemistry, 39, 11177 (2000)). Later it was found was a better predictor for both 2 and 3-state proteins (D. N. Ivankov, S. O. Garbuzynskiy, E. Alm, K. W. Plaxco, D. Baker and A. V. Finkelstein, Protein Sci 12, 2057 (2003)). Here we control for the effects due to varying chain length and stability by considering only rates at the transition midpoint . Stability in fact correlates with chain length for 2-state proteins in water (, ). This may be in part why RCO acts as a better predictor of rates than under these conditions. A Kramers analysis of folding times predicts a speed limit of about (J. Kubelka, J. Hofrichter and W. A. Eaton, Curr. Opin. Struct. Biol. 14, 76 (2004)), however here we are considering rates at the fixed stability of the transition midpoint. Other topological measures such as cliquishness (C. Micheletti, Proteins 51, 74 (2003)), which measure correlations between native pair contacts, were also seen to correlate well with rate. However these measures also tend to correlate with contact order for PDB structures.
- not (d) For a detailed description of the model see for example Z. Guo,D. Thirumalai, and J. D.Honeycutt, J Chem Phys 97, 525 (1992), J. E. Shea, Y. D. Nochomivitz, Z. Guo and C. L. Brooks III, J Chem Phys 109, 2895 (1998), or C. Clementi, H. Nymeyer, and J. N. Onuchic,J Mol Biol 298, 937 (2000).
- not (e) B. A. Shoemaker, J. Wang, P. G. Wolynes, J Mol Biol 287, 675 (1999), B. A. Shoemaker, J. Wang, P. G. Wolynes, Proc Nat Acad Sci USA 94, 777 (1997).
- Plotkin and Onuchic (2000) S. S. Plotkin and J. N. Onuchic, Proc Nat Acad Sci USA 97, 6509 (2000).
- Plotkin and Onuchic (2002) S. S. Plotkin and J. N. Onuchic, J Chem Phys 116, 5263 (2002).
- not (f) The PDB codes of these proteins are: 1AEY, 1APS, 1BF4, 1FKB, 1HRC, 1LMB, 1MJC, 1NYF, 1PGB, 1RIS, 1SRL, 1TEN, 1TIT, 1UBQ, 1YCC, 2AIT, 2CI2, 2PTL, 2VIK. The various references containing experimental data for rates and -values for these proteins can be found at www.physics.ubc.ca/steve/exptl.html.
- not (g) S. Takada, Proc Nat Acad Sci USA 96, 11698 (1999), D. Baker, Nature 405, 39 (2000).
- not (h) PDB codes: 1AB7, 1AEY, 1APS, 1CSP, 1FKB, 1HRC, 1LMB, 1MJC, 1NMG, 1NYF, 1SHG, 1SRL, 1UBQ, 1YCC, 2AIT, 2CI2, 2PTL, 2U1A.
- Lindberg et al. (2002) M. Lindberg, J. Tangrot, and M. Oliveberg (2002), preprint.
- not (i) R. von Mises, Mathematical Theory of Probability and Statistics (Academic Press, New York, 1964).
- not (j) M. R. Ejtehadi, S. P. Avall and S. S. Plotkin, Proc. Natl. Acad. Sci. USA submitted.
- Abkevich et al. (1994) V. I. Abkevich, A. M. Gutin, and E. I. Shakhnovich, Biochemistry 33, 10026 (1994).
- Fersht (1999) A. R. Fersht, Structure and mechanism in protein science (W. H. Freeman and Co., New York, 1999), 1st ed.
- Onuchic et al. (1996) J. N. Onuchic, N. D. Socci, Z. Luthey-Schulten, and P. G. Wolynes, Folding and Design 1, 441 (1996).