The effect of biodiversity on the Hantavirus epizootic
Abstract
We analyze a mathematical model of the epizootic of Hantavirus in mice population, including the effect of species which compete with the host. We show that the existence of the second species has an important consequence for the prevalence of the infectious agent in the host. When the two mice species survive in the ecosystem, the competitive pressure of the second species may lead to reduction or complete elimination of the prevalence of infection. The transition between the disappearance of the infection and its presence occurs at a critical value of the competitor’s population, resembling a second order phase transition in a statistical system. The results provide a rigorous framework for the study of the impact of biodiversity in the propagation of infectious diseases, and further lends itself to future experimental verification.
pacs:
87.19.Xx, 87.23.Cc, 05.45.-aI Introduction: The role of biodiversity
In 1993 an outbreak of a severe disease now known as Hantavirus Pulmonary Syndrome (HPS) struck the region of the Four Corners, in the North American Southwest, with a mortality in excess of 50% of those affected. Shortly afterwards, Sin Nombre Virus (Bunyaviridae: Hantavirus, SNV), the first Hantavirus to be discovered in the Americas, was identified as the infectious agent responsible for HPS. The main host of the virus was identified as one of the most common mammals in North America, the deer mouse, Peromyscus maniculatus. Since then, continuous efforts in different areas of science have been made to understand this epizootic, with the ultimate goal of correctly assessing the risk to humans. Across all of the Americas, new discoveries of Hantaviruses (half of them being human pathogens and some of them responsible for a high mortality (Mills and Childs, 1998)) have led to a renewed interest in the natural history of the host rodents.
A simple mathematical model for the spatio-temporal patterns in the spread of this epizootic has been proposed and analyzed by the second author and others (Abramson and Kenkre, 2002; Abramson et al., 2003). The model takes into account several peculiarities of the Hantavirus-rodent association. An example being, the fact that the infection does not produce any known disease in the mice, and consequently does not affect their death rate. The role of the spatio-temporal patterns of the environment on the prevalence of the infection, which has been found in field studies (Yates et al., 2002), has also been taken into account. We refer the reader to (Abramson and Kenkre, 2002; Abramson et al., 2003) for details. That model was able to successfully explain several field observations as environmentally controlled phase transitions, thus providing an analytical support to biological hypotheses such as the trophic cascade discussed in (Yates et al., 2002). Among the consequences of the mathematical model that have correlations with the field observations, we mention the sporadic disappearance of the infection and the formation of “refugia,” whence the infection spreads—when conditions change—in the form of waves.

The model of Abramson and Kenkre (henceforth mentioned as the AK model) predicts a critical transition from a state with a positive prevalence of the infection in the population (an infected phase), to a state without infection. This latter state occurs when a parameter characterizing the environment and controlling the population size drops below a certain threshold value, which we call the “critical carrying capacity.” The population value associated with this critical carrying capacity, , is a population threshold for the system: the total population, , needs to be greater than , to be able to sustain infection at all. In the terminology of the basic reproduction number, , this critical condition corresponds to . Above the critical carrying capacity, the infection is able to sustain itself (equivalent to the condition ). This threshold phenomenon has been documented in the Four Corners region, as shown in Fig. 1. These population densities have been published by Yates et al. (2002), where they discuss the role of El Niño on the prevalence of the SNV infection. We plot here the populations on a logarithmic scale to emphasize the dynamics for low density values. The line with circles shows the total P. maniculatus density (mean density of two nearby sites of the field study), which persists during the 7 years of observation beginning in December 1994. The line without symbols shows the density of mice infected with SNV. The dashed line represents the critical population able to sustain a positive prevalence of infection, as predicted by the AK model, by using approximate parameters obtained from the time series (details of the calculation can be found in Abramson (2004)). Let us briefly analyze the implications of this graph. At the population is above the critical threshold level and, correspondingly, there is a positive infected phase. Within this regime, it is conceivable that the environmental carrying capacity has some time dependence, but that it remains above the critical value. Around , the carrying capacity then drops to some value below criticality, and consequently the total population drops as well, approaching an equilibrium which is now below the critical value . The drop is not monotonic: there are some discrete steps of decreasing population. Concomitantly, as begins to decrease (the indication that the carrying capacity has gone subcritical), the infected population begins to disappear sporadically. A few infected mice may be entering by migration, but it is clear that the infection is disappearing from the site. After there begins a steady population explosion, indicating that the carrying capacity has increased, and it is observed that the population grows beyond , indicating that the system is again above the critical level. The prevalence of infection is expected to recover. This process takes time, however, just as in the AK model [see Fig. 2 in (Abramson and Kenkre, 2002)], and not before do we see a positive again. After this, the population remains above critical, and the infection persists. A brief excursion of below (at ) might be the beginning of a new extinction event, and indeed reaches its lowest values since those at . But shortly after this, the time series ends and the analysis can not be carried further. Observe that the drop in takes place in 2001, a year that was particularly dry in the North American Southwest, as can be seen in the precipitation data of Fig. 2 in (Abramson, 2004).
A threshold in the animal density necessary to sustain a positive seroprevalence has directly been observed in another Hantavirus system, the Puumala Virus in association with the red bank vole in Belgium (Escutenaire et al., 2000). It is conceivable, then, that other processes which limit the population size would play a similar role in the control of the infection. In real ecosystems mice share the environment with many others species, competing for limited resources with some, and being preyed on by others. Indeed, competition and predation stand out as the main interspecific relations for the species under consideration.
The effect of a predator is certainly akin to that of a competitor: both tend to reduce the population under study. The role of predation on the prevalence of a disease has been analyzed by Ostfeld and Holt (2004), and previously by Packer et al. (2003). As recognized in the former, other phenomena besides predation (such as limited food supply) may be the principal regulators of rodent populations. However, under the hypothesis that predation is the main factor, they find that the incidence of the disease decreases with an increasing number of predators. An important peculiarity of that model is that the number of predators is not affected by the population of prey. As a consequence, the number of predators can be used as a control parameter in the analysis of the dynamics. This assumption is reasonable for generalist predators, which are sustained by several prey species. A competitor species, on the other hand, will necessarily be affected if the shared resources are limited. The mathematical model, in such a situation, requires a feedback of each of the populations into the dynamics of the other. Various other details of the model of Ostfeld and Holt (2004) and of Packer et al. (2003) do not apply to the problem under consideration in the present paper. Among these we might mention: the recovery from infection, the increased mortality of infected animals, and the increased predation of them. Certainly, the model could be tailored for specific situations, and for Hantavirus as study of the effect of predation will be a necessary complement to the competition analysis that we propose in the present contribution.
Another interesting phenomenon—also relying upon the biodiversity of an ecosystem and affecting the dynamics of zoonoses—has received recent attention, as has its relevance to human health. Of particular interest is the case of Lyme disease, analyzed by means of empirically based computer simulations by Van Buskirk and Ostfeld (1995) and by Schmidt and Ostfeld (2001). A conceptual model of the phenomenon, termed dilution effect, was presented by Ostfeld and Keesing (2000a) and further developed in (Ostfeld and Keesing, 2000b). The dilution effect consists in the fact that the prevalence of an infection, in the vector, of an infectious agent (ixodid ticks and a spirochete bacterium, respectively, in the case of Lyme disease) is reduced if the population of their hosts contains a diversity of species. Ticks (in their juvenile stages, which are the most relevant for the transmission to humans) are non-specific in their feeding habits, and therefore if only one species of possible hosts acts as a competent reservoir for the transmission of the infectious agent, the existence of other hosts (which are incompetent reservoirs, being unable to transmit the bacterium to a tick feeding on them), reduces the probability of infection of susceptible ticks. As a result of this “dilution,” while the total population of ticks is not affected by the biodiversity of their hosts, the prevalence of the infection is reduced. The mechanism by which this reduction takes place in the tick population is, then, different from the one we propose in the present contribution. The prevalence of the infection in the Hantavirus host is reduced by the presence of competitors at its own trophic level, the species with which the host shares resources. These competitors exert a pressure on the host population as a whole, and the infected sub-population may be reduced and even led to extinction (even though the total population persists, as we will show below). In other words, with the dilution effect there is a reduction in the infection by means of a reduction of the exposure, v.g. of the chance of encounter between the infectious agent and a susceptible host. What it is shown in the present work is a different phenomenon. Even within the host population, the relative weight of the pathogen is reduced. We stress the ecological importance of this feature, rather than its mathematical justification.
With the purpose of gaining insight into the system, we aim to understand the role of the different processes separately, while keeping the model analytically manageable. For this reason we have chosen to make a number of simplifications. As mentioned above, we restrict our discussion to competition interactions only, which arise among rodent species for a number of reasons. To mention a few, territory, feeding habits, behaviors, etc., all contribute to competitive behavior. In general, a particular Hantavirus has a specific host, a single species that acts as a reservoir. This host remains infected and maintains the infection in the population by horizontal transmission only. It is known that, in some cases, there may be “alternative host species,” that are able to host the virus, but for some reason are unable to transmit it successfully. Other mammals that come into contact with an infected individual of the host species may become infected. However, non-host animals normally represent a dead-end for the virus, which is eliminated by the immune response of the animal (Peters et al., 1981). In summary, these species do not play a direct role in the spreading of the disease in the wild, but they exercise, nevertheless, an ecological pressure on the host, that eventually may affect the dynamics of the zoonosis.
In the following section we present a generalization of the AK model in the simplest case, incorporating just one competitive species that cannot be infected, and studying its effect on the dynamics of the infection. The theoretical insight obtained may suggest ways for controlling the disease agent and, therefore, its incidence. Our results show that competition reduces, in a specific way, the prevalence of the infection. Interestingly, this is in agreement with (and provides theoretical support to) a hypothesis that has been recently put to experimental test in populations of Z. brevicauda, the host of the Calabazo Hantavirus, in field studies in Panama111Suzán, G. (University of New Mexico), personal communication, and also Suzán et al. (2004). In their work, only the host was left at specific sites, removing the competing species, with the purpose of observing the change in the infection prevalence with respect to control sites, where all the competitors coexist.. Similarly, also in Panama, it has been proposed that the maintenance of competitive populations may serve to reduce the risk to human populations exposed to O. fulvescens infected with the Choclo Hantavirus222Koster, F. (Lovelace Sandía Health System), personal communication.. The proposal which has been called a “moat” consists of an area surrounding human habitation maintaining a diversity of innocuous species, competing with the hosts of the Hantavirus.
As in the AK model, we study the properties of the system as a function of the parameters that characterize the (eventually changing) environmental conditions. These parameters are proportional to the carrying capacities of the system (one for each species), and therefore provide a natural choice to analyze the dependence of the prevalence of the infection as controlled by limiting resources, as suggested by the trophic cascade proposed by Yates et al. (2002). The role of environmental factors that affect rodent density, such as plant biomass and coverage, as determinants in the seroprevalence of Hantavirus, has also been suggested by Biggs et al. (2000). The potential impact of this relationship with the human risk of HPS has been successfully put to test by the use of remote sensing techniques and GIS, as reported by Boone et al. (2000).
II Intra- and interspecific competition
We consider two species of mice, one of which is a reservoir of Hantavirus (the host species), and another which is not (the alien species). The host is subdivided into susceptible and infected populations. Let us consider that both species interact by competing for common resources. A usual description of this situation, as discussed for example by May (1981), is the following model for the population dynamics of the total host, , and alien, , populations:
| (1a) | ||||
| (1b) | ||||
where, for the host species, is the birth rate, is the death rate, is the carrying capacity in the absence of an alien population (), and is the influence of the alien population; for the alien species, the analogous parameters are , , and respectively. We consider that the interaction is not necessarily symmetric, i.e. . One of the species can take resources from the other in a quantity greater than what it is losing.
There are four significant equilibria for the system defined by Eqs. (1), the others involve negative populations. Two of them consist in one species surviving over the extinction of the other. Another one is the extinct phase where all populations are zero. Finally, there is a coexistence state where both species are present, and in this we will focus our interest. When only one species persists, the equilibrium population is either:
| (2) |
or:
| (3) |
where the asterisk denotes equilibrium states. If the two species coexist, then:
| (4a) | |||||
| (4b) | |||||
The stability of these equilibria is immediate with the use of linear stability analysis [see, for example, (Murray, 1993) or (Guckenheimer and Holmes, 1983)]. The conclusion of such analysis is as follows. If the intensity of the interacting competition is not very high, and , then the coexistence state given by Eq. (4) is stable. On the other hand, if the competition is strong, and , bistability occurs: the final state depends on the initial conditions. Finally, if and (or and ), only the strong competitor survives. For a more complete survey see (May, 1981) or (Murray, 1993).
With the same considerations made in the formulation of the AK model, we introduce an internal classification into the host population. The internal states consist of the infected subpopulation, , and the susceptible subpopulation, . It is clear that these states are mutually exclusive, and that their sum recovers the total host population, . The evolution equations for these are modeled, also as in AK, according to the following field observations: infected individuals are generated by pair-wise interactions between susceptible and infected; there is no vertical transmission (from infected mother to offsprings); infected individuals die with the same rate as susceptible ones (indeed, the virus does not appear to affect any physical or behavioral parameter of the infected individuals). It is worth mentioning that the lack of vertical transmission is, in the AK model, crucial for the character of the phase transition controlled by the—environmentally dependent—carrying capacity. If it is relaxed, even infinitesimally, the threshold of the carrying capacity becomes zero, and there is a positive prevalence for all values of . The resulting model is now:
| (5a) | ||||
| (5b) | ||||
| (5c) | ||||
where is the contagion rate. The equation for is the same as in Eq. (1b). The AK model is recovered by setting , and ignoring the equation for . The existence of the two subpopulations of makes each of the equilibria corresponding to split into two, one of them with a positive prevalence (an infected phase) and one without infection. The former, for which the three populations are positive, is:
| (6) | |||||
| (7) | |||||
| (8) |
Due to the fact that the coexistence equilibrium of Eq. (4) can be expressed as:
| (9) |
we can cast the fraction of infected mice, , as
| (10) |
where is the critical carrying capacity of the AK model, below which the infected phase disappears. This last result coincides with the AK model when , so that if , and then , the infected phase is stable, and if it is unstable. In the presence of the alien population (), we can generalize the critical parameter as:
| (11) |

Let us analyze the relevance of Eqs. (10) and (11). The former, Eq. (10), states that the fraction of infected mice in the host population is reduced by the presence of alien mice, the host’s competitors. A graphical representation of this result is shown in Fig. 2, where we plot as a function of the alien population, for several values of the carrying capacity . Fig. 2 contains one of the fundamental results of the present work, clearly showing that the competitive pressure exerted by the alien population has the effect of reducing the prevalence of infection in the host. In fact, from Eq (10) it can be seen that the prevalence is maximum when no alien population is present, , and that increasing the amount of aliens will always reduce the prevalence, since . A further important result of the present calculation is the existence of a critical amount of aliens, a threshold level in the population of competitors, that drives the system completely to a non-infected state. This value is given by
| (12) |
When the environmental parameter has a value greater than the critical the system has a positive prevalence of infection. On the other hand, when , the competitor population results greater than the minimum necessary to force the infected subpopulation to extinction. The point constitutes a critical point for the system, separating two behaviors that qualitatively differ in the stability of the equilibrium of the infected population. Observe that time-varying environmental conditions, as well as a heterogeneous landscape, may provide a framework where a wealth of spatio-temporal patterns of infection would occur.
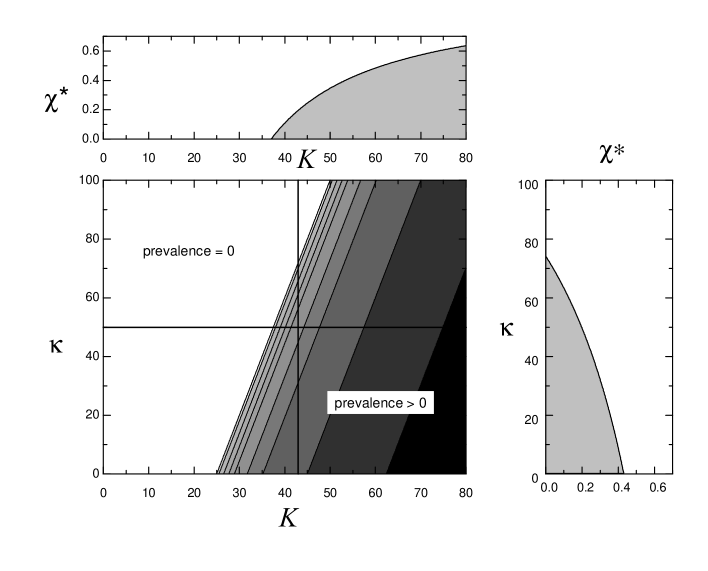
In Fig. 3 we show a phase diagram that provides a complementary picture to that given by Fig. 2. The shaded contour plot shows the prevalence (as scales of grey) in the parameter space defined by the two carrying capacities, and . The region painted white, that includes the origin, is the region free of infection, where the state with is stable. The first contour defines the transition line, beyond which a positive and stable prevalence is to be found, in a potentially infinite region in parameter space. Two sections of the phase plot are also shown, along the lines perpendicular to the axes seen in the contour plot. Each one of the sections represents a projection of the prevalence along one of the carrying capacities. Both of them are in the form of a transcritical bifurcation, in which two equilibria of different character exchange their stability. The section shown at the top of the figure represents the transition as a function of the carrying capacity of the host, . There is a threshold above which the population shows a positive prevalence. A similar picture characterized the AK model (as a function of only) [see Fig. 1 in (Abramson and Kenkre, 2002)]. The presence of the competitor reduces the seroprevalence in such a way that the bifurcation is not a linear relation between the equilibrium solution and the control parameter. The section shown on the right panel represents the effect of the carrying capacity of the competitor, . In this case, a greater carrying capacity inhibits the infection, because it allows a greater population of competitors.
It is important to remark that the “strength” of the competition with the alien population, , is the same for both susceptible and infected hosts [Eq. (5)]. Indeed, both subpopulations are reduced as a result of the competition, but the infected population suffers the consequences in a stronger manner, becoming extinct in a critical way. This phenomenon, analogous to a second order phase transition in a physical system, occurs at a finite value of the density of alien mice, as shown in Eq. (12).
The origin of the differential effect by which susceptible and infected hosts feel the competitive pressure differently, deserves some discussion. This effect is caused by an important difference between susceptible and infected mice that—even though it was already mentioned when the classification was introduced—until now had its true relevance not exposed. The difference resides in the ways in which new members of each type are incorporated in the population. While the susceptible are born, the infected appear only by contagion of already born (and susceptible) mice. In biological terms, there is no vertical transmission, a fact that produces a strong asymmetry between susceptible and infected. The lack of a differential death rate between susceptible and infected animals is also a peculiarity of this system, which is uncommon in other epizootics. These two ingredients, a difference and a similitude between the two classes of host animals, are responsible for the differential effect.
III Conclusions
We have studied a model of the epizootic of Hantavirus in a system composed of two rodent populations: a host of the virus, which remains chronically infected by horizontal transmission, and a competitor species that does not host the virus. This situation is paradigmatic of many Hantavirus-rodent systems, in which a single species hosts the virus in a competent way, and several other species compete with the host. The model generalizes a previous model by Abramson and Kenkre (2002) [also (Abramson et al., 2003)], that described the dynamics of the host only. The interaction between the two rodent species, since it is a competition for limited resources, produces a mutual limitation of the populations. In particular, the second species exerts a regulatory effect on the host. This competitive pressure is the same for both susceptible and infected hosts (as it should, since the infection with Hantavirus does not affect any biological parameters in the hosts). Nevertheless, a reduction of the seroprevalence in the host species is observed, up to a point where it completely disappears from the system. This phenomenon can be described as a critical transition between an infected phase and a phase free of infection, controlled by the—environmentally determined—carrying capacities of the two species. In the space defined by these carrying capacities spatially or temporally varying environmental conditions would be described by a path, which might cross the transition line, thus driving a corresponding change in infection phase. This is analogous to the results discussed by Abramson and Kenkre (2002) and Abramson et al. (2003), as well as, conceptually, by Yates et al. (2002). Furthermore it is interesting that a change in the carrying capacity of the competitor only (a vertical path in the phase space of Fig. 3) is enough to drive the infection to extinction. In a real world situation, where the carrying capacities exhibit temporal as well as spatial heterogeneity, a wealth of dynamical transitions are to be expected.
Alternatively, the competitor’s population can be used to define an effective carrying capacity of the host, which exhibits the same threshold behavior. Our model has been intentionally kept simple to allow a direct analysis of the consequences by analytical means. This thus provides a manageable framework to study a necessary step towards the modeling of realistic systems, which certainly contain several species of rodents and small mammals in competitive interaction, as well as other species in the trophic web. The study of similar systems, for example: when competing species are organized in a hierarchical way (Tilman, 1994); the role of fluctuations when populations are small; etc., are currently under study and will be presented in forthcoming contributions.
Acknowledgements.
The authors acknowledge fruitful discussions with Gerardo Suzán and Fred Koster, as well as the valuable comments made by the referees and the handling editor of the manuscript. We are also grateful to Maureen Ballard for her careful reading of the manuscript and her many suggestions. G. Abramson acknowledges financial support from CONICET (PEI 6482) and ANPCyT (PICT-R 2002-87/2). Further support has been provided by the Consortium of the Americas for Interdisciplinary Science (University of New Mexico) through the following grants: INT-0336343 (NSF’s International Division) and DARPA-N00014-03-1-0900. As always, it is a pleasure to acknowledge the hospitality of the Abdus Salam ICTP (Trieste).References
- Abramson and Kenkre (2002) Abramson, G. and Kenkre, V.M., 2002. Spatio-temporal patterns in the Hantavirus infection. Phys. Rev. E 66, 011912.
- Abramson et al. (2003) Abramson, G., Kenkre, V.M., Yates, T.L. and Parmenter, B.R., 2003. Traveling waves of infection in the Hantavirus epidemics. Bulletin of Mathematical Biology, 65, 519-534.
- Abramson (2004) Abramson, G., 2004. The criticality of the Hantavirus infected phase at Zuni. Electronic article arXiv:q-bio.PE/0407003.
- Aguirre et al. (2002) Aguirre, M.A., Abramson, G., Bishop, A.R. and Kenkre, V.M., 2002. Simulations in the mathematical modeling of the spread of the Hantavirus. Phys. Rev. E 66, 041908.
- Biggs et al. (2000) Biggs, J.R., Bennett, K.D., Mullen, M.A., Haarmann, T.K., Salisbury, M., Robinson, R.J., Keller, D., Torrez-Martinez, N. and Hjelle, B., 2000. Relationship of ecological variables to Sin Nombre Virus antibody seroprevalence in populations of deer mice. J. of Mammalogy, 81, 676-682.
- Boone et al. (2000) Boone, J.D., McGwire, K.C., Otteson, E.W., DeBaca, R.S., Kuhn, E.A., Villard, P., Brussard, P.F. and St. Jeor, S.C., 2000. Remote Sensing and Geographic Information Systems: Charting Sin Nombre Virus Infections in Deer Mice. Emerging Infectious Diseases 6, 248-258.
- Escutenaire et al. (2000) Escutenaire, S., Chalon, P., Verhagen, R., Heyman, P., Thomas, I., Karelle-Bui, L., Avsic-Zupanc, T., Lundkvist, A., Plyusnin, A. and Pastoret, P.-P., 2000. Spatial and temporal dynamics of Puumala hantavirus infection in red bank vole (Clethrionomys glareolus) populations in Belgium. Virus Research 67, 91-107.
- Guckenheimer and Holmes (1983) Guckenheimer, J. and Holmes, P.J., 1983. Nonlinear Oscillations, Dynamical Systems and Bifurcations of Vector Fields, Springer-Verlag, Berlin-Heidelberg-New York.
- Holt et al. (2003) Holt, R.D., Dobson, A.P., Begon, M., Bowers, R.G. and Schauber, E.M., 2003. Parasite establishment in host communities. Ecol. Lett. 6, 837-842.
- Mills and Childs (1998) Mills, J. N. and Childs, J. E., 1998. Ecologic Studies of Rodent Reservoirs: Their Relevance for Human Health. Emerg. Inf. Diseases 4, no. 4, 529-534.
- May (1981) May, R. M., 1981. Theoretical Ecology, Principles and Applications. Blackwell Science, Boston, USA.
- Murray (1993) Murray, J. D., 1993. Mathematical Biology, 2nd ed. Springer, New York, USA.
- Ostfeld and Holt (2004) Ostfeld, R.S. and Holt, R.D., 2004. Are predatords good for your health? Evaluating evidence for top-down regulation of zoonotic disease reservoirs. Front. Ecol. Environ. 2, 13-20.
- Ostfeld and Keesing (2000a) Ostfeld, R.S. and Keesing, F., 2000. Biodiversity and disease risk: the case of Lyme disease. Conservation Biology 14, 722-728.
- Ostfeld and Keesing (2000b) Ostfeld, R.S. and Keesing, F., 2000. The function of biodiversity in the ecology of vector-borne zoonotic diseases. Can. J. Zool. 78, 2061-2078.
- Packer et al. (2003) Packer, C., Holt, R. D., Hudson, P. J., Lafferty, K. D. and Dobson, A. P., 2003. Keeping the herds healthy and alert: implications of predator control for infectious disease. Ecol. Lett. 6, 797-802.
- Peters et al. (1981) Peters, C. J., Mills, J. N., Spiropoulou, C. F., Zaki, S. R. and Rollin, P. E., 1999. In Tropical Infectious Diseases, Guerrant, R. L. and Weller, P. F. (Eds.), chap. 113, p. 1217. W. B. Saunders, New York, USA.
- Suzán et al. (2004) Suzán, G., Marcé, E., Parmenter, R. R., Giermakowski, J. T., Mills, J., Armien, B., Armien, A., Pascale, J. M., Zaldivar, Y., Salazar, J. and T. L. Yates, 2004. Responses of hantavirus host communities in Panama to species removal. Presented at the 84th Annual Meeting of the American Society of Mammalogists. 12-16 June 2004. Humboldt State University, Arcata, California, USA.
- Schmidt and Ostfeld (2001) Schmidt, K. A. and Ostfeld, R. S., 2001. Biodiversity and the dilution effect in disease ecology. Ecology 82, no. 3, 609-619.
- Tilman (1994) Tilman, D., 1994. Competition and biodiversity in spatially structures habitats. Ecology 75, 2-16. This model has already been used in epidemic dynamics by Hess, G., 1996. Disease in metapopulation models: implications for conservation. Ecology 77, no. 5, 1617-1632.
- Van Buskirk and Ostfeld (1995) Van Buskirk, J. and Ostfeld, R. S., 1995. Controlling Lyme disease by modifying the density and species composition of tick hosts. Ecological Appl. 5, no. 4, 1133-1140.
- Yates et al. (2002) Yates, T. L., Mills, J.N., Parmenter, C.A., Ksiazek, T.G., Parmenter, R.R., Vande Castle, J.R., and Calisher, C.H., Nichol, S.T., Abbott, K.D., Young, J.C., Morrison, M.L., Beaty, B.J., Dunnum, J.L., Baker, R.J., Salazar-Bravo, J. and Peters, C.J., 2002. The Ecology and Evolutionary History of an Emergent Disease. Biosciences, 52, no. 11, 989-998.