Discovery and analysis of
biochemical subnetwork hierarchies
Petter Holme
Department of Physics, Umeå
University
901 87 Umeå, Sweden
Mikael Huss
SANS, NADA, Royal Institute of
Technology
100 44 Stockholm, Sweden
Abstract
The representation of a biochemical network as a graph is the coarsest level of description in cellular biochemistry. By studying the network structure one can draw conclusions on the large scale organisation of the biochemical processes. We describe methods how one can extract hierarchies of subnetworks, how these can be interpreted and further deconstructed to find autonomous subnetworks. The large-scale organisation we find is characterised by a tightly connected core surrounded by increasingly loosely connected substrates.
1 Introduction
At the coarsest level of description, cellular biochemistry can be represented as a network of vertices (substrates) linked by chemical reactions. For both conceptual and analytical purposes, the vastness and complexity of these biochemical networks calls for a division into smaller subunits. This is nothing new—traditionally biochemists have talked about functional subnetworks, the citric acid cycle being one example, comprised of biochemical pathways. As modern day genomics gives an increasingly comprehensive picture of the biochemical network one would like to complement the traditional way of mapping out subnetworks by objective graph theoretical methods. By such methods we can address not only the question what relevant subnetworks there are, but also the hierarchical organisation of subnetworks (can subnetworks be said to consist of smaller subnetworks, and so on), and also more fundamental questions about in what context the subnetwork concept is relevant and when the biochemical circuitry is to be considered as a functional whole.
The graph-theoretical signature for a subnetwork is that it is internally densely connected but has relatively few links to the rest of the graph. Other methods for detecting subnetworks [11, 8, 6, 10] have been based on local properties such as the number of reactions a substrate takes part in, or the similarity of the neighbourhood. Since non-local features can heavily affect network dynamics [3], one would prefer methods that take these into account. Here, we discuss global algorithms for subnetwork detection, in particular methods based on the betweenness centrality measure.
2 Preliminaries
2.1 Biochemical networks as bipartite graphs
A bipartite graphiiiOr, to be precise, a two-mode representation of a bipartite graph. The formal definition of bipartiteness is just that a graph contains no odd circuits. contains of two types of vertices and links that only go between vertices of different type. We represent the biochemical networks as directed bipartite graphs where is a set of vertices representing substrates, is a set of vertices representing chemical reactions, and is the set of directed links—ordered pairs of one vertex in and one vertex in . The links are such that if the substrates are involved in a reaction with products , then we have and . The number of links leading to a vertex is called in-degree and denoted .
2.2 Betweenness centrality
Roughly speaking, the betweenness centrality [1] of a vertex in an undirected graph is the number of shortest paths between pairs of vertices that passes . For the purposes of this work we are interested in reaction vertices that are central for paths between metabolites or other molecules; thus we restrict our definition of betweenness to the reaction vertices only. The precise definition then becomes:
| (1) |
where is the number of shortest paths between and that passes through , and is the total number of shortest paths between and . Since all substrates needs to be present for a reaction to occur it is meaningful to rescale the betweenness by the in-degree:
| (2) |
We call the effective betweenness of .
2.3 Girvan and Newman’s algorithm
The algorithm for tracing subnetworks we use is due to Girvan and Newman (GN) [2], but in a form adapted to bipartite representations of biochemical networks as presented in Ref. 4. The idea of the algorithm is based on the fact that vertices that lie between densely connected areas have high betweenness, and vice versa. Thus by successively removing reaction vertices with high degree one will see the network disintegrate into subnetworks of decreasing size. Furthermore, the smaller subnetworks remaining after many iterations will be perfectly contained subnetworks earlier in the execution of the algorithm, thus the method produces a full hierarchy of subnetworks.
The precise definition of the algorithm is to repeat the following steps until no reaction vertices remain:
-
1.
Calculate the effective betweenness for all reaction vertices.
-
2.
Remove the reaction vertex with highest effective betweenness and all its in- and out-going links.
-
3.
Save information about the current state of the network.
If many reaction vertices have the same in step 2, we remove all of them at once. A C-implementation of this algorithm along with test data sets can be found at www.tp.umu.se/forskning/networks/meta/.
3 A case-study: T. pallidum
To illustrate the output of the algorithm, and how it can be post-processed, we choose the metabolic network of T. pallidum—the pathological agent of syphilis—as obtained from the WIT database [7]iiiiiiThis is the same data as used in Refs. 5, 10, and thus slightly outdated, but it should work well for illustrating the method..
3.1 The large scale shape of the hierarchy trees
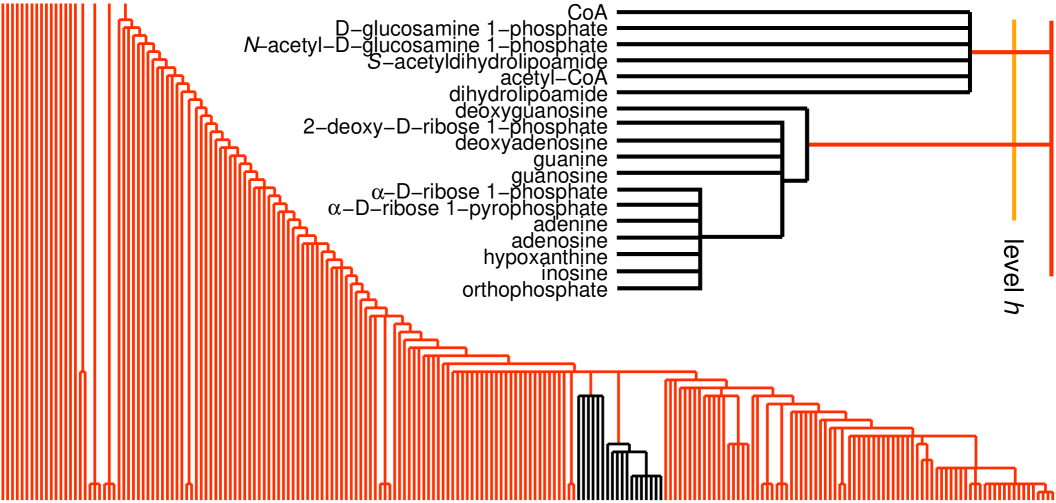
The subnetwork hierarchy of T. pallidum’s metabolic network is presented as a tree (a so-called dendrogram) in Fig. 1. The end-points at the base of the dendrogram represent the substrate vertices of the metabolic network. The vertical dimension represents the hierarchical level—if a horizontal line is drawn across the dendrogram, the vertices connected below the line belongs to the same cluster (connected subgraph) at that particular level of the hierarchical organisation. The further down the tree two vertices are connected, the more tightly connected are they in the biochemical network. If one substrate is to be converted to another that is separated from the first one high up in the in the dendrogram, then a long chain of reactions is needed. If, on the other hand, the two vertices are connected near the bottom of the dendrogram, then they probably are both present in one or more reactions.
The most striking feature of Fig. 1, and indeed of any of the 43 organisms of Ref. 5, is that the network has one dominating cluster at most levels of the hierarchy. As the algorithm proceeds (one goes from top to bottom of the dendrogram) a few vertices at a time peel off from the largest connected cluster. The emerging picture is that the large scale structure of metabolic network has a tightly connected core and increasingly loosely connected outer ‘shells.’ A few rather well-defined sub-networks are identified however, for example the subnetworks of Fig. 1 containing reactions associated with purine metabolism and pyruvate/acetyl-CoA conversion.
3.2 Criteria for identifying subnetworks
We can identify subnetworks by looking at the hierarchy tree, if a subnetwork is isolated at some level (like the N-acetyl-D-glucosamine 1-phosphate, D-glucosamine 1-phosphate, dihydrolipoamide, S-acetyldihydrolipoamide, CoA, and acetyl-CoA network of Fig. 1 at level ) then it is comparatively well connected within itself relative to its surrounding. If the cluster is isolated close to the top of the dendrogram, then it is not very entangled in the wirings of metabolic pathways, and likely to be a reasonably autonomously functioning module. Can we establish objective criteria for subnetworks to be regarded as meaningful modules? For example Ref. 10 detects modules in an indirect way using a very weak criterion, roughly speaking, that substrates are likely to belong to same module if they appear in reactions involving the same set of other substrates. To identify groups in social networks Radicci et al.[9] suggested two criteria that, adapted to biochemical networks becomes as follows: If, during the iterations of the GN algorithm, an isolated vertex set fulfils the following criterion it is said to be a weak community:
| (3) |
and a strong community if:
| (4) |
where is the number of that are products of a reaction involving a substrate , and is the number of that are products of a reaction involving a substrate . Loosely speaking Eq. 3 means that there are, on average, more feedback pathways back into than pathways leading out to the rest of the network. If the strong condition (Eq. 4) holds, then products of all reactions involving substrates are more likely to belong to than not. It turns out that Eq. 4 is not fulfilled for almost any cluster at any but the lowest level of the hierarchy (closest to the bottom of the dendrogram). Eq. 3 is on the other hand fulfilled for the largest cluster throughout all iterations of the algorithm. (This picture persists for all 43 WIT organisms studied in Ref. 5.) That the subnetworks of cellular biochemistry almost completely lacks the community structure of social network, or component structure of electronic devices, does not necessarily mean that it is futile to talk of biochemical modules. For a subnetwork to have some degree of autonomy it has to have some self-regulatory function, and thus a feedback loop. To implement this idea, consider the subnetworks with substrate vertex set that fulfils:
| (5) |
where is the number of vertices in that lies on an elementary cycle (a closed non-self-intersecting path) of only vertices in and length larger than three, is the number of vertices in , and the parameter is the required fraction of feedback loop vertices. We test the three cases where equals , and , corresponding to the subnetwork having at least one feedback loop, more than half of the substrates, or every substrate participating in a feedback loop, respectively. The largest cluster close to the top of the dendrogram quite naturally fulfils Eqs. 5 when small (in our case or ), therefore we detect subnetworks starting from the bottom of the dendrogram and go upwards. With each one of these criteria we find non-trivial subnetworks. Of the subnetworks of Fig. 1 the hardest requirement, detects two relevant subnetworks—the one containing CoA and the innermost one containing orthophosphate: -D-ribose 1-phosphate, -D-ribose 1-pyrophosphate, adenine, adenosine, hypoxanthine, inosine, and orthophosphate. The extended ortophosphate-subnetwork still connected at level (also containing e.g. guanine) is regarded as a valid subnetwork with , but not with . To assign an appropriate requires a careful look at the problem in question, but as a rule of thumb close to one seems sensible for most applications.
4 Conclusions
Finding subnetworks of cellular biochemistry is an important task for modern bioinformatics, for both conceptual and analytical purposes. There are two general ways to proceed, either one searches for small building blocks (cf. Ref. 12) or one tries to deconstruct the whole network. Our approach falls into the second category. By adapting an algorithm [2] for subnetwork detection to biochemical networks we construct hierarchy trees, dendrograms, representing the whole hierarchical organisation of subnetworks of biochemical pathways. We find that biochemical networks cannot be divided into subnetworks as easily as e.g. acquaintance networks, and electronic circuits [4]. Against this backdrop it is not surprising that some recent criteria (Eqs. 3 and 4) for extracting meaningful social subnetworks fail to give non-trivial results. In remedy we propose conditions based on the presence of feedback loops within a subnetwork. The above methods are illustrated by an application to the metabolic network of T. pallidum, we have also tested them on the metabolic and whole-cellular networks (containing e.g. transmembrane transport and signal transduction) of 42 other organisms of the WIT database [7], and obtain sensible output.
Acknowledgements
Thanks are due to Claudio Castellano, Hawoong Jeong and Petter Minnhagen. P.H. was partially supported by Swedish Research Council through contract no. 2002-4135.
References
- [1] J. M. Anthonisse, The rush in a directed graph, Tech. Rep. BN 9/71, Stichting Mathematisch Centrum, 1971.
- [2] M. Girvan and M. E. J. Newman, Community structure in social and biological networks, Proc. Natl. Acad. Sci. USA, 99 (2002), pp. 7821–7826.
- [3] P. Holme, Congestion and centrality in traffic flow on complex networks, Adv. Complex Syst., 6 (2003), pp. 163–176.
- [4] P. Holme, M. Huss, and H. Jeong, Subnetwork hierarchies of biochemical pathways, Bioinformatics, 19 (2003), pp. 532–538.
- [5] H. Jeong, B. Tombor, Z. N. Oltvai, and A.-L. Barabási, The large-scale organization of metabolic networks, Nature, 407 (2000), pp. 651–654.
- [6] S. C. Johnson, Hierarchical clustering schemes, Psychometrika, 32 (1976), pp. 241–253.
- [7] R. Overbeek et al., WIT: Integrated system for high-throughput genome sequence analysis and metabolic reconstruction, Nucleic Acids Res., 28 (2000), pp. 123–125.
- [8] S. M. Patra and S. Vishveshwara, Backbone cluster identification in proteins by a graph theoretical method, Biophys. Chem., 84 (2000), pp. 13–25.
- [9] F. Radicchi, C. Castellano, F. Cecconi, V. Loreto, and D. Parisi, Defining and identifying communities in networks. e-print cond-mat/0309488.
- [10] E. Ravasz, A. L. Somera, D. A. Mongru, Z. N. Oltvai, and A.-L. Barabási, Hierarchical organization of modularity in metabolic networks, Science, 297 (2002), pp. 1553–1555.
- [11] S. Schuster, T. Pfeiffer, F. Moldenhauer, I. Koch, and T. Dandekar, Exploring the pathway structure of metabolism: Decomposition into subnetworks and application to Mycoplasma pneumoniae, Bioinformatics, 18 (2002), pp. 351–361.
- [12] S. Shen-Orr, R. Milo, S. Mangan, and U. Alon, Network motifs in the transcriptional regulation network of Escherichia coli, Nature Genetics, 31 (2002), pp. 64–68.