Characterization of the State of Hydrogen at High Temperature and Density
Abstract
Fermionic path integral Monte Carlo simulations have been applied to study the equilibrium properties of the hydrogen and deuterium in the density and temperature range of and . We use this technique to determine the phase diagram by identifying the plasma, the molecular, atomic and metallic regime. We explain how one can identify the phases in the path integral formalism and discuss the state of hydrogen for 5 points in the temperature-density plane. Further we will provide arguments for the nature of the transitions between the regimes.
1 Introduction
The phase diagram of hydrogen has been studied intensively with different theoretical approaches [1],[2], simulation techniques [3],[4] and experiments [5],[6]. From theory, the principal effects at low densities are well-known. On the other hand, the properties at intermediate density are not yet well understood, and the phase diagram is not yet accurately determined. In particular, the nature of the transition to a metallic state is still an open question.
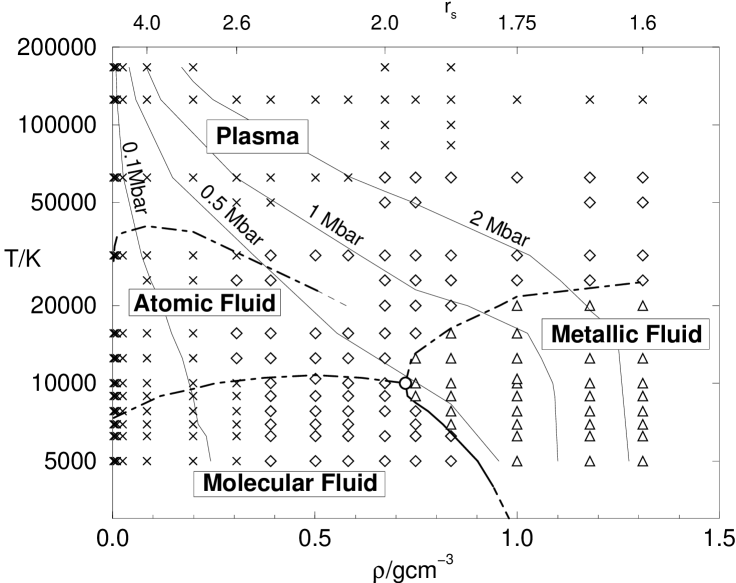
In this article, we would like to show how these questions can be addressed by path integral Monte Carlo (PIMC) simulations. Using this approach, we derived the phase diagram in Fig.1 where we distinguish between molecular, atomic, metallic and plasma regimes. We will demonstrate how these different states can be identified from PIMC simulations.
The imaginary-time path integral formalism [7] is based on the position-space density matrix , which can be used to determine the equilibrium expectation value of any operator ,
| (1) |
where represents the coordinates of all particles. The low temperature density matrix can be expressed as product of high temperature density matrices with the time step . In position space, this is a convolution,
| (2) |
This high dimensional integral can be integrated using Monte Carlo methods. Each particle is represented by a closed path in imaginary time. Fermi statistics is taken into account by considering the fermion density matrix, which can be expressed by considering all permutations of identical particles,
| (3) |
where is the antisymmetrization projection operator. Cancellation of positive and negative contributions leads to the fermion sign problem, which is solved approximately by restricting the paths within a nodal surface derived from the free-particle density matrix [8].
2 Phase diagram of hydrogen and deuterium
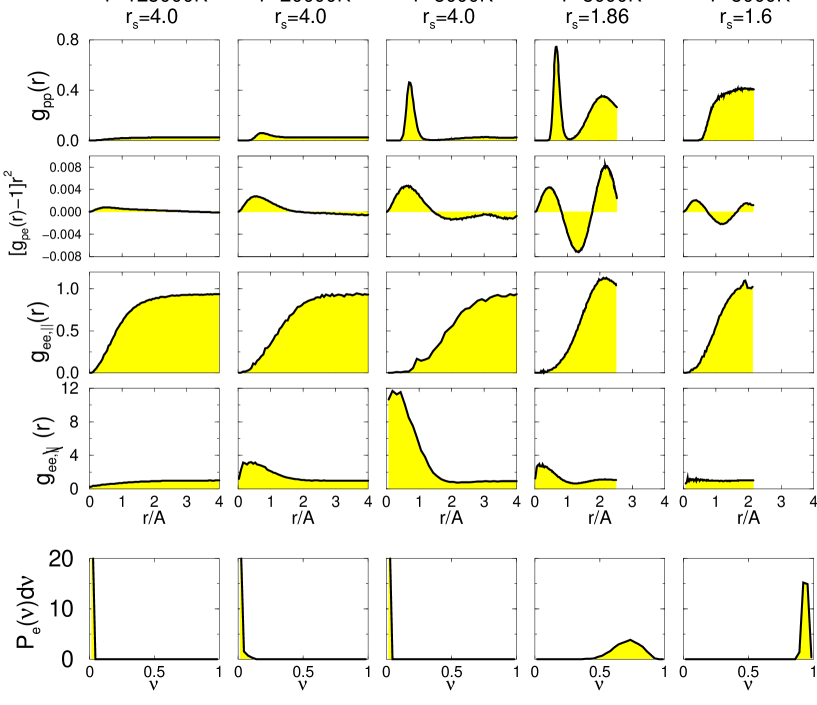
We used PIMC simulation with 32 protons and 32 electrons and a time step K to generate the phase diagram shown in Fig. 1. In the low density and low temperature regime, we find a molecular fluid. In the proton-proton correlation function shown in Fig. 2, one finds a clear peak at the bond length of Å. We determine the number of molecules as well as other compound particles by a cluster analysis based on the distances. Using this approach we can estimate the number of bound states (see [10]). We can also estimate the fraction of molecules and atoms to determine the regime boundaries. However at high density, a clear definition of those species is difficult to give.
Starting in the molecular regime, one finds that increasing temperature at constant density leads to gradual dissociation of molecules followed by a regime, with a majority of atoms. The atoms are then gradually ionized at even higher temperatures. Lowering the density at constant temperature leads to a decrease in the number of molecules, or atoms respectively, due to entropy effects.
If the density is increased at constant temperature, pressure dissociation diminishes the molecular fraction. This transition was described by Magro et. al. [9]. Its precise nature is still a topic of our current research. Using PIMC simulations, one finds it occurs within a small density interval and we predict that it is connected with both the molecular-atomic and insulator-metal transition. We determine the fraction of electrons involved in a permutation as an indication of electronic delocalization. Permuting electron are required to form a Fermi surface, which means that a high number of permutations indicate a high degree of degeneracy of the electrons. Permuting electrons form long chains of paths and therefore occupy delocalized states. This delocalization destabilizes the hydrogen molecules. Before all bonds are broken, one finds a molecular fluid with some permuting electrons, which could indicate the existence of a molecular fluid with metallic properties.
The boundaries of the metallic regime are determined by two effects. With increasing temperature, the degree of degeneracy of the electrons is simply reduced. If the temperature is lowered, the attraction to the protons becomes more relevant, which localizes the electron wave function and decreases the degree of degeneracy also (see Fig. 1).
Acknowledgements
Support from CSAR program and computer facilities at NCSA and Lawrence Livermore National Laboratory.
References
- [1] W. Ebeling, W. D. Kraeft and D. Kremp, “Theory of bound states and ionisation equilibrium in plasma and solids”, in Ergebnisse der Plasmaphysik und der Gaselektronik, volume 5, Akademie-Verlag, Berlin (1976).
- [2] D. Saumon and G. Chabrier, Phys. Rev. A 46(1992)2054
- [3] T. J. Lenosky, J. D. Kress and L. A. Collins, Phys. Rev. B 56(1997)5164.
- [4] S. Nagel, R. Redmer, G. Röpke, M. Knaup and C. Toepffer, Phys. Rev. E 57(1998)5572
- [5] I. B. Da Silva, P. Celliers, G. W. Collins, K. S. Budil, N. C. Holmes, W.T. Jr. Barbee, B. A. Hammel, J. D. Kilkenny, R. J. Wallace, M. Ross, R. Cauble, A. Ng and G. Chiu, Phys. Rev. Lett. 78(1997)483
- [6] S. T. Weir, A. C. Mitchell, and W. J. Nellis, Phys. Rev. Lett. 76(1996)1860
- [7] D. M. Ceperley, Rev. Mod. Phys. 67(1995)279
- [8] D. M. Ceperley, “Path integral Monte Carlo methods for fermions”, in Monte Carlo and Molecular Dynamics of Condensed Matter Systems, Ed. K. Binder and G. Ciccotti, Bologna, Italy (1996).
- [9] W. R. Magro, D. M. Ceperley , C. Pierleoni, and B. Bernu, Phys. Rev. Lett. 76(1996)1240
- [10] B. Militzer, W. Magro, and D. Ceperley, “Restricted Path Integral Monte Carlo Calculations of Hot, Dense Hydrogen”, in Proceedings of the International Conference on Strongly Coupled Coulomb Systems, Boston (1997).
Received October 1, 1998