A Compact 3H(p,)4He 19.8-MeV Gamma-Ray Source for Energy Calibration at the Sudbury Neutrino Observatory
Abstract
The Sudbury Neutrino Observatory (SNO) is a new 1000-tonne D2O Čerenkov solar neutrino detector. A high energy gamma-ray source is needed to calibrate SNO beyond the 8B solar neutrino endpoint of 15 MeV. This paper describes the design and construction of a source that generates 19.8-MeV gamma rays using the 3H()4He reaction (“”), and demonstrates that the source meets all the physical, operational and lifetime requirements for calibrating SNO. An ion source was built into this unit to generate and to accelerate protons up to 30 keV, and a high purity scandium tritide target with a scandium-tritium atomic ratio of 1:2.00.2 was included. This source is the first self-contained, compact, and portable high energy gamma-ray source (10 MeV).
1 Introduction
The Sudbury Neutrino Observatory (SNO) [1] is a new heavy water (D2O) Čerenkov solar neutrino detector. The detector is unique in its use of 1000 tonnes of D2O as target, which allows the detection of electron neutrinos and neutrinos of all active flavours through the following channels:
| (1) | |||||
| (2) | |||||
| (3) |
This ability to measure the total flux of all active flavours of neutrinos originating from the Sun will allow SNO to make a model-independent test of the neutrino oscillation hypothesis.
The SNO collaboration needs a high energy calibration point beyond the 8B solar neutrino energy endpoint of 15 MeV. This calibration point is very important in understanding the detector’s energy response because Čerenkov light production is not exactly linear in energy (e.g. energy loss to low energy electrons below the Cěrenkov threshold). As the energy increases, the probability that a photomultiplier tube would get hit by more than one Čerenkov photon increases. Therefore, a calibration point beyond the solar neutrino energy endpoint will provide vital information on this multiple hit effect at energies beyond the solar neutrino endpoint.
In the arsenal of calibration sources at SNO, the “” source, which employs the 3H()4He reaction to generate 19.8-MeV gamma rays, has the highest energy. This source is the first self-contained, compact, and portable high energy gamma-ray source (10 MeV).
In this paper various aspects of the construction and operation of the source are described. In Section 2 the design criteria for a high energy gamma-ray calibration source at SNO are outlined. Attributes of the 3H()4He reaction are discussed in Section 3. In Section 4, the design of the source is described. Details involving the fabrication of the scandium tritide target and the assembly of the source are summarized in Section 5. The experimental setups used in measuring the neutron and the gamma-ray output of the source are described in Section 6. The results of these measurements can be found in Section 7, followed by the conclusions in Section 8.
2 Design Criteria for a High Energy Gamma-Ray Source
One way to calibrate the high-energy response (1020 MeV) of a large water Čerenkov detector like SNO is to use high-energy gamma rays generated from radiative-capture reactions induced by a particle beam. The devices that provide these high-energy gamma rays must be compact enough to be maneuvered to different regions in the D2O volume using the SNO calibration source manipulator system. The largest insertion port for calibration devices at SNO can accommodate devices up to about 30 cm in diameter and 75 cm in length. This physical constraint limits the actual size of such calibration devices.
Because the SNO detector is essentially a 100% efficient, 4 detector to gamma rays in the solar neutrino energy regime, one does not need to design a high-energy source with a high gamma-ray production rate. The centroid of the photopeak can be measured to better than 1% in less than an hour with a gamma-ray yield of 0.2 s-1.
SNO is designed to run with MgCl2 loaded in the heavy water to detect the free neutron in Reaction (2). The high energy gamma-ray source is required to have a low neutron production rate. This will minimize the signal interference of the gamma rays resulting from thermal neutron capture by 35Cl in D2O in the “salt” running scenario and the dead time in the data acquisition system. A neutron production of less than 104 s-1 is needed for the design goal of 0.2 s-1.
The source must be available to calibrate the SNO detector whenever there is a change to the detector configuration, or when a high energy calibration is called for. An operational lifetime of 60 hours for the source will be more than enough to calibrate the SNO detector during its anticipated life span.
Electromagnetic interference between this high energy calibration source and the photomultiplier tube array must be minimal. For this reason, accelerator sources like the source have to be run in direct current mode, instead of pulsed mode, to eliminate possible electromagnetic pickup by the photomultiplier tube array.
3 Attributes of a 3H(p,)4He Source
The 3H(p,)4He reaction (see for example, Refs. [2] and [3]) has a Q-value of 19.8 MeV. Since 4He does not have a bound excited state, the gamma ray emitted in this reaction is monoenergetic. Building a compact gamma-ray calibration source using this reaction is an attractive proposal for several reasons.
First of all, the projectile and the target have unit charge. Therefore, the effect of Coulomb suppression on the cross section for this reaction is less than reactions with other combinations of charged projectiles and targets. Hence, the beam energy and power can be minimised. This allows the beam to be run in a d.c. mode without incorporating a complicated cooling system for the target.
As the Q-value of 3H(p,n)3He is -0.763 MeV, the source is essentially neutron-free if the proton energy is below this threshold. However, isotopic impurities and the isotopic exchange between the beam and the target will give rise to undesirable neutrons through the 2H(t,n)4He, 3H(d,n)4He, and 3H(t,nn)4He reactions. In principle, one can eliminate this neutron production problem by mass analyzing the beam. However, this option is not possible in the source given the physical size constraint mentioned in the last section.
A monoenergetic calibration source like the source is better than sources with multiple energy lines in calibrating water Čerenkov detectors which generally have poor energy resolution.
4 Design of the Source
In order to keep the system as clean as possible, the source was built with ultra-high vacuum (UHV) hardware. A cross sectional drawing of the source can be found in Figure 1. The source can essentially be divided into three sections: the gas-discharge line, the ion acceleration line and the target chamber. In the following, the design of these three sections is discussed.
The gas-discharge line is a cold-cathode Penning ion source, which runs in d.c. mode with a very modest power consumption. The outer housing of the gas-discharge line consists of two glass-to-stainless-steel adapters111Manufactured by Larson Electronic Glass, Redwood City, CA, USA. Each of these adapters is 7.62 cm in length with a piece of 1.27-cm long Pyrex glass to isolate the two ends. The electrodes E1, E2 and E3 are welded to these adapters. The use of these glass-to-stainless-steel adapters provides convenient high voltage isolation between the anode and the cathodes. The placement of the various electrodes in the gas-discharge line was designed using the simulation program MacSimion [4]. In the design, efforts were made to minimise ion loss to the electrode walls; hence, a higher beam current can be attained for a given discharge current. The beam was spread over the target; this reduces the areal power density and improves the target’s longevity. Under the normal running scenario, the cathodes (E1 and E3) are kept at ground, whilst the anode (E2) is maintained at +2 kV d.c.
A SAES St-172 getter (model LHI/4-7/200) is used as the hydrogen discharge gas reservoir for the ion source. The getter has 360 mg of a zirconium-vanadium-iron alloy active material, and is mounted to the BNC connector next to E1 in Figure 1.
The axial magnetic field required in the discharge is provided by a cylindrical magnet composed of seven 13.34 cm (outer diameter) by 5.88 cm (inner diameter) by 1.91 cm (thick) barium ferrite Feroxdur ceramic rings222The magnets are supplied by Master Magnetics, Inc., Castle Rock, CO, USA. (part number CR525C). The maximum magnetic field inside the central bore of the magnet is about 0.06 T.
The ion acceleration line is a double-ended glass adapter333Manufactured by MDC Vacuum Products Corp., Hayward, CA, USA. (part number DEG-150)., with one end attached to the gas-discharge line and the other connected to the target chamber which is biased at a negative high voltage. In this scheme, the construction of complicated accelerating and focusing electrodes is avoided, and the length can also be kept to a minimum. When the ions exit this acceleration line and enter the target chamber, they have acquired an energy equivalent to the target bias voltage, in addition to their ejection energy from the ion discharge region.
At the end of the ion acceleration line in the source is the target mount flange. The target is secured to a copper heat sink, as shown protruding from the flange in Figure 1, by a stainless steel screw-on cap. This mounting mechanism is designed to allow efficient target mounting in the tritium glovebox in which this operation is to be performed.
The total length of the source is only 50 cm. For deployment in SNO, it will be housed inside a 25.4-cm diameter by 60-cm long stainless steel cylindrical deployment capsule. The dimensions of this capsule are well within the physical limits imposed by the SNO calibration-source-deployment hardware.
The expected yield of the source was calculated. Because the cross section of the 3H()4He reaction below 50 keV is not well known, the cross section at the operating voltage of the source had to be extrapolated from existing data. It is shown in Ref. [5] that the long-wavelength approximation formalism developed in Christy and Duck [6] is inadequate in describing the 3H()4He cross section at low energies because of the reaction’s exceptionally high binding energy. Using the lowest energy data ( MeV) from Hahn et al. [3], the reaction cross section was extracted by performing a minimization of the S-factor , which is related to the cross section as [7]:
| (4) |
where is the energy in the center of mass frame, and is the Gamow energy. Because is expected to be a slowly varying function at low energy, it was fitted to the data as a power series:
| (5) |
where the parameters , and were extracted. Details of the extrapolation can be found in Ref. [5]. In Figure 2, the extrapolated for the 3H()4He reaction is shown. The values of the fitted parameters are listed in Table 1. The cross section at proton energies of 25 keV and 30 keV are 0.19 b and 0.30 b respectively. The stopping power required in the yield calculation was calculated using the program SRIM [8]. Figure 3 shows the estimated gamma-ray yield as a function of the the mass-1 content in a 50-A, 27-keV beam in the constructed source. This calculation assumed a total mixing of hydrogen isotopes between the beam and the target.
The ion beam current was measured in situ by a calorimetric method and by a Faraday cup fitted with a secondary electron suppression scheme. These measurements were made with extra hardware installed in the target chamber of an untritiated model source. In the calorimetric method, the temperature of a copper target, in which a heater was embedded to calibrate the beam power [5], was monitored. Beam current measured by both methods agreed with each other. The source is capable of generating at least 50A of total (atomic and molecular) beam current at a beam energy of 20 keV. The mass composition of the beam was also measured in situ by lengthening the target chamber and installing a home-built mass spectrometer in the model source. The mass-1 composition was determined to be (0.630.09) in the H2 partial pressure range of 0.310-3 to 0.610-3 mbar, which is a factor of 5 lower than the normal operating pressure of the source. The normal operating pressure of the source was chosen by considering the beam stability and longevity running in a continuous mode. The mass composition measurement could not be made at the normal operating H2 pressure of the source due to increased beam scattering in the lengthened target chamber and the inadequate resolution of the spectrometer.
5 Construction of the Source
5.1 Fabrication of the Scandium Tritide Target
The most common metal hydride films use titanium as the “sorbent” [9, 10, 11, 12, 13]. Singleton and Yannopoulos [14] measured the loss rate of tritium in titanium tritide, yttrium tritide and scandium tritide films at elevated temperatures under several different ambient environments. It was demonstrated that both yttrium and scandium films have a lower tritium loss rate than titanium films under the testing conditions. Although this study was performed using moderately loaded tritiated films (Y:3H and Sc:3H ratios were 1:1), this general observation of scandium tritide films having very good thermal stability is believed to hold even for heavily loaded films. This property is essential for a target system which does not have an external cooling mechanism like the source.
Molybdenum was chosen as the substrate for the scandium film because of the strong adhesion between the two materials [15]. To ensure high adhesion strength of the scandium film to the molybdenum substrate, it was prepared by going through a series of mechanical and chemical treatments prior to film deposition.
A substrate disc of diameter 2.86 cm was first cut out from a 1-mm thick sheet of 99.95% pure molybdenum using the electro-discharge machining (EDM) technique. This was to minimise the use of machining oil on the substrate. The substrate was then sandblasted by fine glass beads in order to increase its effective surface area and enhance the film adhesion strength. The scandium film would peel off much more easily from a non-roughened substrate surface.
The substrate was then treated chemically in a multi-stage process. It was first cleansed in acetone in an ultrasonic bath for half an hour. The substrate was subsequently ultrasonically cleansed in ethanol, then deionised water, for half an hour in each solvent. This sequence of chemical cleansing ensured that hydrocarbons that might have deposited on the substrate during the EDM process to be removed. The substrate surface was then etched in a 3 M nitric acid bath for 30 seconds. The whole chemical cleansing process was completed by a 30-minute deionised water wash in an ultrasonic bath.
Once the substrate had gone through this series of preparation processes, it was mounted to a copper holder in which a 110-W coil heater was embedded and placed inside the ultra-high vacuum (UHV) evaporation system which is described below. The Mo substrate was centered on the 2.54-cm diameter central aperture of the holder. This heater block was outfitted with thermocouples for temperature monitoring. The substrate was baked at 400∘C in the evaporation system for about four days, then at 250∘C for about a week to reduce outgassing from its surface.
Fabrication of the scandium tritide target, and the subsequent assembly of the source were performed at the tritium laboratory at Ontario Hydro Technologies (OHT) in Toronto, Ontario, Canada. The schematic of the vacuum system is shown in Figure 4. To ensure that a high vacuum could be achieved in this tritium run, oil-free vacuum pumps and UHV hardware were used in this system. The evaporation chamber is a UHV six-way cross with an outer flange diameter of 15.24 cm. The tritium-compatible glovebox is continuously purged with dry nitrogen. The moisture level in the glovebox is typically 30 to 50 ppm by volume. The nitrogen purge gas is routed through a Zr2Fe tritium trap in order to remove its tritium content before venting [16]. The exhaust of the vacuum system is also routed through a Zr2Fe trap before venting.
Two high-current feedthroughs were connected to the evaporation chamber. A 5-coil conical tungsten evaporation basket444R.D. Mathis Company, Part Number B12B-3x.025W was mounted between these feedthroughs. A (261)-mg lump of 99.99% pure, sublimed dendritic scandium was placed inside this basket, and positioned directly above the molybdenum substrate in the heater block. The separation between the bottom of the tungsten basket and the molybdenum substrate was (142) mm. A stainless steel shroud that had an orifice directly below the evaporation basket was positioned around the feedthrough-basket assembly to prevent deposition on the viewport in the evaporation chamber and to reflect radiation back to the coil to enhance heating efficiency.
A quartz oscillator was installed at the end of an evaporator bellows as shown in the setup in Figure 4. When the deposition assembly is inserted into the evaporation chamber, the oscillator can be lowered to the back side of the assembly through an aperture in the main shroud and used to monitor the deposition rate of scandium. The distance between the scandium source (in the tungsten evaporation basket) and the oscillator was 27 cm.
As shown in Figure 4, there are two main gas lines connected to the evaporation chamber in the vacuum system of the setup. One of these branches is connected to a 5-g depleted uranium bed. This uranium bed is used to store tritium which can be readily desorbed by raising it to sufficiently high temperature [17, 18]. In Table 2, the isotopic purity of the tritium gas in this bed is shown.
Prior to film evaporation, the whole apparatus was baked for over a week at 150-200 ∘C to reduce the outgassing rate of the evaporation system. The tungsten evaporation coil was also baked by running a 10 A current through it. The base pressure of the system was 610-7 mbar during the bakeout. After the baking, the evaporation system reached a base pressure of 5.810-8 mbar.
After bakeout, the deposition assembly (i.e. the high current feedthrough-evaporation basket assembly) was delivered into the evaporation chamber by winding in the linear translation stage to which the deposition assembly flange was connected. The tungsten evaporation basket was positioned directly above the centre of the molybdenum substrate.
The current fed to the tungsten basket was raised at a rate of about 1 A min-1 during the first thirty minutes of the experiment. This rate was then decreased to 0.2 A min-1 to lower the outgassing rate of the evaporation hardware. The basket current was raised up to 46 A, at which point the coil temperature was 1900 ∘C. This was to ensure that all the scandium, whose melting point is 1539 ∘C, was evaporated.
Immediately after the scandium deposition, the deposition assembly was removed from the evaporation chamber by winding out the linear translation stage and closing a gate valve (V2 in Figure 4). Before tritium was let into the evaporation chamber, the evaporation chamber was isolated by closing the remaining gate valves (V1 and V3 in Figure 4) connected to it. These two steps would reduce the amount of tritium used in the subsequent tritiation process. The molybdenum substrate temperature was subsequently raised to 400 ∘C to enhance tritium sorption by the scandium film later on.
The uranium tritide bed was first heated to 135 ∘C to drive out the 3He from tritium decay in the bed. At this temperature, tritium is still “locked” inside the bed. The released 3He was first pumped out of the system before the uranium bed temperature was raised to 220-240 ∘C at which temperature the tritium is desorbed. In order to measure the amount of tritium sorbed by the scandium film, the tritium gas released from the uranium bed was first trapped in the small volume between valves V6 and V10 (see Figure 4) before releasing to the isolated evaporation chamber. This trap has a volume of (31.92.2) cm3. With the tritium pressure measured by the pressure transducer connected to this volume, the amount of tritium used could then be determined. In Figure 5 the pressure inside the evaporation chamber is plotted against the time after Doses 1, 7, 9 and 13 were injected. It is clear from the figure that the sorbing capacity of the scandium film decreased as the tritium concentration in the film increased.
A total of (8.190.57) Ci of tritium gas was injected in 13 different doses into the chamber. It was found that 89.9% of the tritium that was injected into the chamber was absorbed by the (5.70.6) mg scandium film on the target heater block. This corresponds to a 3H/Sc atomic ratio of (2.00.2). The target substrate subtended a smaller solid angle than the heater block to which the substrate was mounted. After correcting for the solid angle, the tritium activity on the target substrate was found to be (3.30.8) Ci.
5.2 Assembly of the Source
The ion source must be cleansed before it could accept the tritiated target. If the outgassing rate of the ion source is too high, the getter would lose most of its capacity on pumping the residual gas in the source, rather than serving its purpose as the hydrogen discharge gas reservoir.
The ion source was cleansed chemically and mounted to a tritium-free bakeout system. The ion source was baked at 150 ∘C for about two weeks. The bakeout vacuum system was flushed with argon for approximately 5 to 10 minutes daily during this bakeout period. This flushing procedure did improve the overall cleanliness of the vacuum system.
After the target fabrication, the ion source was removed from the bakeout system and wrapped in layers of Parafilm which is a flexible, thermoplastic material. It was used to minimise tritiated particles depositing on the outer surface of the ion source once it was taken into the glovebox where the target evaporation system was set up. The tritiated target was removed from the evaporation system and mounted to the source. The ion source was then connected to the vacuum system as indicated in Figure 4.
After the system had reached its base pressure, H2 was let into the system, and an ion beam was allowed to strike and to bombard the target for 5 minutes. During this time, the beam energy was gradually increased from 0 to 25 keV. This procedure was necessary to cleanse the Penning electrodes by electro-discharge. Contamination on the target, which might have deposited on the target surface during the target mounting process, would also be removed by this brief beam bombardment. It was found that if this step were not carried out, the getter in the source would not be able to handle the residual gas load in the source once sealed.
The St-172 getter had to be activated before loading hydrogen to it. To activate the getter, it was heated for 10 minutes at 800∘C by passing a 4.5 A current through it. Once activated, the getter current was lowered to about 1.6 A in order to maintain a temperature of 200∘C. The getter was then loaded with hydrogen by allowing an ambient H2 pressure of 3.310-4 mbar into the ion source. After 30 minutes, 200 cm3 mbar of H2 would have been absorbed by the 360 mg of active material in the getter. The getter loading procedure was completed by turning off the getter current, and by pumping out the residual H2 gas in the ion source. After the base pressure was reached, the source was isolated and detached from the rest of the vacuum system by closing the metal-seal valve on the source. The source was subsequently removed from the glove box, and its outer surface was de-contaminated.
6 Experimental Setup for Measuring the Neutron and Gamma- Ray Yields of the Source
6.1 Gamma-Ray Detection Systems
After the source was constructed at OHT, a quality assurance test was first performed at Queen’s University at Kingston, ON, Canada. The source was subsequently transported to the University of Washington for a measurement of the gamma-ray angular distribution in the 3H()4He reaction [5]. In the quality assurance test, a 12.7-cm diameter by 7.6-cm long bismuth germanate (Bi4Ge3O12, or BGO) crystal was used as the gamma-ray detector [19]. In the angular distribution measurement, three 14.5-diameter by 17.5 cm cylindrical barium fluoride (BaF2) crystals were used. In Figures 6 and 7 the orientations of the source with respect to the detectors in the two different test systems are shown.
6.2 Neutron Detection System
Because of beam-target mixing, fast neutrons are generated through the 2H(t,n)4He, 3H(d,n)4He, and 3H(t,nn)4He reactions. The neutron output of the source during its lifetime was monitored by neutron-proton elastic scattering in organic scintillators. The neutron detector was a 12.7-cm diameter by 5.1-cm thick Bicron BC 501 liquid scintillator, which was optically coupled to a Hamamatsu R1250 photomultiplier tube (PMT).
7 Gamma-Ray and Neutron Yields of the Source
The gamma-ray and neutron production rates by the source are summarised in this section. The source was operated in the quality assurance test and in a measurement of the gamma-ray angular distribution in the reaction. During the 98.8 hours of operational lifetime of the source, data was taken at beam energies of 22, 27 and 29 keV.
7.1 Gamma-Ray Yields
In the quality assurance test at Queen’s, the source was run at a beam energy of 22 keV for 3 hours. The gamma-ray output was subsequently increased by raising the beam energy to 27 keV, and ran for another 17.9 hours. Energy calibration of the BGO detector was provided by the 22Na 0.511-MeV and 1.275-MeV lines, the 1H(n,)2H 2.22-MeV line, and the 12C∗(4.4 MeV) de-excitation line. In Figure 9 the cosmic-ray-background-subtracted energy spectrum from part of the data taken at 27 keV in the quality assurance test is shown. The figure shows a fit using a response function for the BGO spectrometer generated by GEANT [21]. The measured gamma-ray yield of the source during its testing at 27 keV is (0.670.11) s-1. The gamma-ray yield at 22 keV could not be extracted because of low statistics.
In the angular distribution measurement, the gamma-ray detectors were energy calibrated by a variety of sealed sources: 137Cs(0.662 MeV), 207Bi(1.063 MeV), 12C∗(4.44 MeV), and 16O∗(6.13 MeV). Without a readily available energy source with an energy close to 19.8 MeV, Monte Carlo simulation using GEANT [21] was relied upon to calculate the response of the detectors. The simulation program was checked against the data taken with a strength calibrated 13C(,n)16O∗ source.
Energy spectra were taken with this 13C(,n)16O∗ source placed at the centre of the BaF2 detector system. At the time of this experiment, this source had a strength of (4.10.1)103 s-1. Because of its high neutron output, energy spectra were taken with a 2.5-cm thick slab of lead placed between the source and the detectors to extract the neutron induced spectra. By comparing these two types of spectra, the gamma-ray line shape could then be extracted for each detector. In Figure 10, the GEANT generated line shape is compared to an experimentally determined spectrum. After correcting for the effects of lead absorption, neutron induced background and dead-time, the number of detected gamma rays and efficiency () were extracted. The average ratio between and the GEANT calculated efficiency (), , was found to be (1.010.04).
The gamma-ray penetration function was measured for the 6.13-MeV gamma-ray line in the three BaF2 detectors. This source was positioned inside an untritiated model source, the mechanical construction of which was identical to the real source, at the location where the tritiated target would be mounted. The gamma-ray detection rate was then measured experimentally in a procedure similar to the efficiency measurement above. By comparing this detection rate and the one without the presence of the model source, the average penetration factor over the solid angle subtended by the detectors was extracted. The average percentage difference between the measured values and the simulated ones is 3%.
To extract the gamma-ray yield of the source, the calibrated “beam-on” data were fitted to a composition of a cosmic-ray background and the 19.8-MeV line shape for an isotropic source located at the target surface in the source as generated by GEANT simulation. Because the emitted gamma rays in the 3H()4He reaction have a predominant angular distribution [2, 5, 22], the extracted gamma-ray amplitude from the fit was corrected for this distribution.
The rate at 29 keV during the gamma-ray angular distribution measurement in the last 47.2 hours of the source’s lifetime was (0.360.03) s-1. The gamma-ray production rate in between the quality assurance run and this time was not evaluated because of a noise problem in the electronics system, and the yield could not be extracted reliably. In Figure 11, the gamma-ray production rate was renormalised to that for a 29-keV atomic beam. It is clear that the gamma-ray yield decreased over time and is due to beam-target mixing and target sputtering in the source. This point will be discussed after evaluating the neutron yields in the next section.
7.2 Neutron Yields
In the source most of the neutrons are generated through the 3H+3H interaction. Although the discharge gas stored into the hydrogen reservoir in the source was initially free of any tritium, tritium would get into the discharge gas through beam-target exchange after a period of beam bombardment. Moreover, deuterium present in the discharge gas (at a 1.510-4 level) and in the target (at a 1.210-3 level) would enhance neutron production by the source through the 3H(d,n)4He reaction. In the following the results of this neutron production measurement are presented.
The fast neutron detection efficiency of the liquid scintillator was calibrated using an 241Am-9Be source which generates neutrons through 9Be(,n)12C. This source has a calibrated neutron strength of (7.10.7)103 n s-1 and was placed on the axis of the detector with a separation of 20.6 cm, the same distance between the tritiated target and the neutron detector in the gamma-ray angular distribution runs. Gamma rays and neutrons generated by the source could be cleanly separated by pulse shape discrimination. The net neutron count rate was extracted after the correction of a (7.10.1)% dead time and the subtraction of a background rate of 0.7 s-1. The detection efficiency () was found to be .
Neutrons generated by the source would inevitably be scattered or absorbed by its construction material. Hence the detected neutron rate () would be less than the actual -source generated rate () by a reduction factor . To measure this reduction coefficient, the 241Am-9Be source was placed on the target mount inside the untritiated model source. This model source was then placed in the same orientation to the liquid scintillator as in the gamma-ray angular distribution runs. After correcting for the dead time and background, and comparing the neutron detection rate to that in the calibration runs without the presence of this model source, it was found that the source hardware absorbed or scattered % of the neutrons that are generated inside the source.
Because there was a variation in beam intensity on target from run to run, the neutron production rate was normalised to the current drawn from the target bias supply in order to provide a fair comparison. This current was a combination of the actual ion current on target and the contribution from secondary electron emission. This current was monitored during all the experimental runs. The source does not have any internal secondary electron suppression scheme because of physical constraints imposed by the SNO calibration hardware.
Two assumptions were made in extracting this neutron generation rate by the source:
-
1.
the neutrons generated by the source have the same energy spectrum as fast neutron spectrum from the 241Am-9Be calibration source;
-
2.
the angular distribution of neutrons generated by the source is isotropic as in the 241Am-9Be case.
Neutrons are produced predominantly by the 3H+3H interaction in the source. The reactions that are energetically possible in this system are:
| (6) | |||
| (7) | |||
| (8) |
In a measurement at a triton energy =500 keV, the branching ratio for these reactions was found to be 70%:20%:10% (in the same order as they appear above) [23]. The neutron energy spectrum for each of these reactions is somewhat different. Without any final-state effect, the direct three-body breakup reaction in reaction (6) would yield neutrons at an average energy of . With a -value of 11.3 MeV, the neutron energy spectrum from reaction (6) would be a broad peak centered at about 4.7 MeV. This shape is indeed very similar to the neutron spectrum from 9Be(,n) sources [24].
The ground state transition (8) yields a 10.4-MeV neutron , followed by a 0.9-MeV secondary neutron. The neutron detection efficiency for the liquid scintillator is almost null at 0.9 MeV. Reaction (7) is a sequential decay proceeding through a broad 5He excited state at about 2 MeV. Because of the small branching ratio for this excited state transition, it would not contribute much to the uncertainty in the extracted neutron generation rate by the source. The uncertainty in the extracted -source neutron rate due to the secondary neutrons is at most 15% if one assumes none of the secondary neutrons from (7) and (8) were detected. The uncertainty in the extracted -source neutron rate due to and the 14 MeV monoenergetic neutron from 3H(d,n)4He was estimated to be 9% at =29 keV.
Although the neutron detector was placed in different orientations to the source in the quality assurance runs and in the gamma-ray angular distribution measurement, continuous beam-target exchange rendered it impossible to extract the neutron angular distribution without the presence of a second neutron detector for normalisation purposes. Wong et al. [23] measured the angular distribution for the 3H+3H system at =500 keV. They found that the ground state transition neutron group is isotropic to within an accuracy of 10%. They also found that in the neutron energy range of 2 to 7.5 MeV, the continuum neutron group is also isotropic to within an accuracy of 20% in the laboratory angle range of 4 to 100∘. For the 3H(d,n)4He reaction, the angular distribution is isotropic at and below the resonance [25]. Given these facts, the assumption that the neutrons emitted by the source are isotropic was made in the yield evaluation.
In order to look at the time variation of the neutron production rate by the source more closely, the neutron production rates for all the runs were renormalised to the same atomic beam energy at 29 keV. In other words, the rate in all of the =22 keV and 27 keV runs were scaled up by a factor corresponding to the difference in cross section at that atomic beam energy to that at 29 keV. The resulting plot is shown in Figure 11.
In Figure 11, it is clear how the neutron production rate in the source varied over time. The neutron production rate was gradually increasing initially. This is a clear indication of beam-target exchange, as tritium in the target gets into the discharge gas stream. The neutron production rate then began to decrease. This can be explained by the fact that the rate of hydrogen isotope exchange was reaching an equilibrium, and sputtering of the target became the dominant process. The target sputtering effect had caused the build-up of a thin film on the high voltage insulator in the acceleration section of the source. Under the normal operating condition, one end of this insulator is grounded whilst the other end is biased at -30 kV. With a thin conductive film build-up on the insulator, high voltage could no longer be maintained without breakdown. This build-up effect limited the lifetime of the source to 98.8 hours.
The neutron production rate of the source during calibration in the SNO detector was estimated. Using the highest data point in Figure 11, the maximum neutron generation rate was estimated to be less than (2.50.4)103 n s-1. The uncertainty here does not include the monoenergetic neutron and the secondary neutron contributions discussed above. However, the estimated rate quoted above should be seen as the upper limit of neutron production as it was estimated using the highest data point in the data. In Figure 12, the results of a Monte Carlo simulation of the SNO detector response to neutrons and gamma rays generated by the source are shown. This simulation was performed using the SNO Monte Carlo and analysis program SNOMAN [26]. In this simulation, fast neutrons generated by the source were assumed to be monoenergetic at 4.7 MeV. Full source and deployment capsule geometries were employed in this simulation, but neutron absorbers inside the source’s stainless steel deployment housing were not. This is equivalent to assuming the worst possible neutron leakage into the heavy water. A neutron production rate of 2,500 s-1 and a gamma-ray production rate of 0.6 s-1 were assumed. The spectra in the figure represent about 3 hours of run time in the SNO detector. From these figures, it is clear that the neutron production rate of the source is low enough for an accurate measurement of the 19.8-MeV photopeak.
8 Conclusions
A functional 19.8-MeV gamma-ray source using the 3H()4He reaction was built. This source met all the physical and operational requirements for energy calibration at the SNO detector. This is the first self-contained, compact and portable high energy (10 MeV) gamma-ray source of this type.
Techniques to fabricate high-quality scandium deuteride and tritide targets were developed. The tritiated target had a Sc:3H atomic ratio of 1:2.00.2.
In the testing of the source, 19.8-MeV gamma rays from the reaction were observed and found to be sufficient for calibrating the SNO detector. The neutron production rate by the source is also low enough that the neutron background would not mask the gamma-ray signal during calibration. Because of the time variation of its output, this source is not suitable for efficiency calibration.
The operational lifetime of the source was 98.8 hours. Operation was terminated by a thin conducting layer deposited on the high voltage insulator in the ion acceleration line, which caused a high voltage breakdown across the insulator. The origin of this layer was scandium sputtering off the target surface. A second source has been constructed with minor engineering changes to reduce this deposition effect.
Calibration of large water Čerenkov detectors at energies near the solar neutrino endpoint has been a difficult problem. This proof-of-principle experiment of the source opens a window for more convenient calibration standards in the future. One area in which the source can be improved is to implement a beam analyser to reduce the beam power on the target, and to reduce the neutron output of the source. This feature was not instrumented in this project because of stringent constraints on the physical size of calibration sources that can be deployed in the SNO detector.
References
- [1] The SNO Collaboration, “The Sudbury Neutrino Observatory”, accepted for publication in Nucl. Instr. Meth. (1999).
- [2] J.E. Perry, Jr., and S.J. Bame, Jr., Phys. Rev. 99 1368 (1955) .
- [3] K.I. Hahn, C.R. Brune, and R.W. Kavanagh, Phys. Rev. C51, 1624 (1995).
- [4] Donald C. McGilvery and Richard J.S. Morrison, Department of Chemistry, Monash University, Clayton, Victoria, Australia (1988).
- [5] A.W.P. Poon, Energy Calibration of the Sudbury Neutrino Observatory Using Monoenergetic Gamma-Ray Sources, Ph.D. Dissertation, The University of British Columbia, Vancouver, Canada (1998).
- [6] R.F. Christy and I. Duck, Nucl. Phys. 24, 89 (1961).
- [7] W.A. Fowler, G.R. Caughlan and B.A. Zimmerman, Annu. Rev. Astron. Astrophys., 5, 525 (1967); W.A. Fowler, G.R. Caughlan and B.A. Zimmerman, Annu. Rev. Astron. Astrophys., 13, 69 (1975); M.J. Harris, W.A. Fowler, G.R. Caughlan and B.A. Zimmerman, Annu. Rev. Astron. Astrophys., 21, 165 (1983); G.R. Caughlan, W.A. Fowler, M.J. Harris and B.A. Zimmerman, Atomic Data and Nuclear Data Tables, 32, 197 (1985).
- [8] J.F. Ziegler, The Stopping and Range of Ions in Matter version 96.01, IBM Research, 1996; J.P. Biersack and J.F. Ziegler, TRIM, IBM Research, (1989, unpublished).
- [9] E.R. Graves et al., Rev. Sci. Instr., 20, 579 (1949).
- [10] L.M. Jones et al., J. Vac. Sci. Technol., 17, 1225(1980).
- [11] H.L. Adair et al., Nucl. Instr. Meth., 200, 99 (1982).
- [12] T. Yanagi et al., Nucl. Instr. Meth., A234, 6 (1985).
- [13] K. Sumita, Nucl. Instr. Meth.,A282, 345 (1989).
- [14] J.H. Singleton and L.N. Yannopoulos, J. Vac. Sci. Technol., 12, 414 (1975).
- [15] M. Frisch, IBM Research, private communication (1994).
- [16] N.P. Kherani, Ontario Hydro Technologies test plan TL2.400.036 (1989, unpublished); M. Hooper, N.P. Kherani, and A.W.P. Poon, Ontario Hydro Technologies test plan TL2.400.036 amendment (1996, unpublished).
- [17] N.P. Kherani and W.T. Shmayda, Bulk Getters for Tritium Storage in Proc. Can. Nucl. Soc. 7th Annual Conference, Toronto (1986) 232.
- [18] N.P. Kherani, W.T. Shmayda and A.G. Heics, Z. Phys. Chem. 164 (1989) 1421.
- [19] R.J. Komar, Ph.D. thesis, Queen’s University at Kingston, Canada (1992).
- [20] S. Pai, W.F. Piel, D.B. Fossan, and M.R. Maier, Nucl. Instr. and Meth. A278 (1989) 749.
- [21] GEANT, CERN program library long writeup W5013 (1994, unpublished).
- [22] W. Del Bianco and G. Kajrys, Can. J. Phys. 58 (1980) 1496.
- [23] C. Wong, J.D. Anderson and J.W. McClure, Nucl. Phys. 71 (1965) 106.
- [24] M.E. Anderson and R.A. Neff, Nucl. Instr. and Meth., 99 (1972) 231.
- [25] T. Lauritsen and F. Ajzenberg-Selove, Nucl. Phys. 78 (1966) 1.
- [26] The SNOMAN authors, The SNOMAN User’s Manual, Version 3.01 (1998, unpublished).
| (MeV b) | (MeV-1) | (MeV-2) | |
| Fitted values | (1.300.40)10-6 | 2512 | 38.87.3 |
| Correlation | 1.00 | -0.99 | -0.65 |
| Matrix | -0.99 | 1.00 | 0.53 |
| -0.65 | 0.53 | 1.00 | |
| 0.22 | |||
| Isotope | Composition |
|---|---|
| 1H | (0.790.04)% |
| 2H | (0.120.01)% |
| 3H | (99.090.05)% |
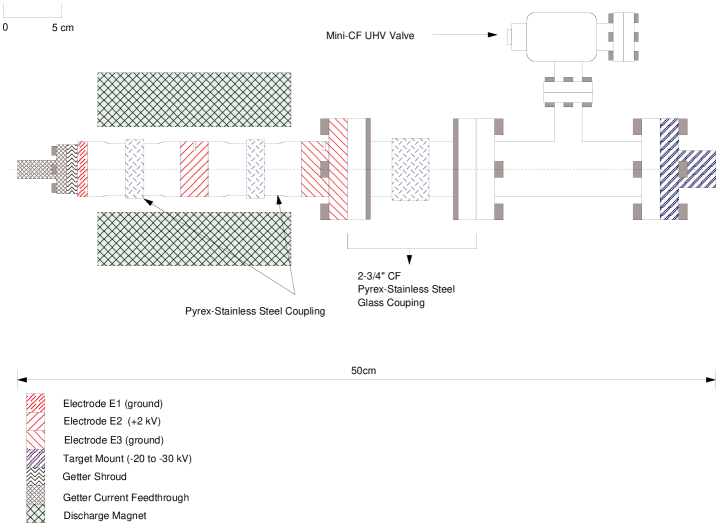
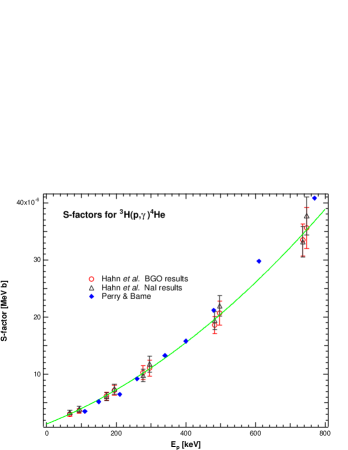
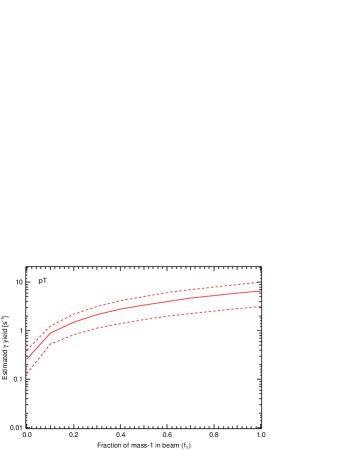
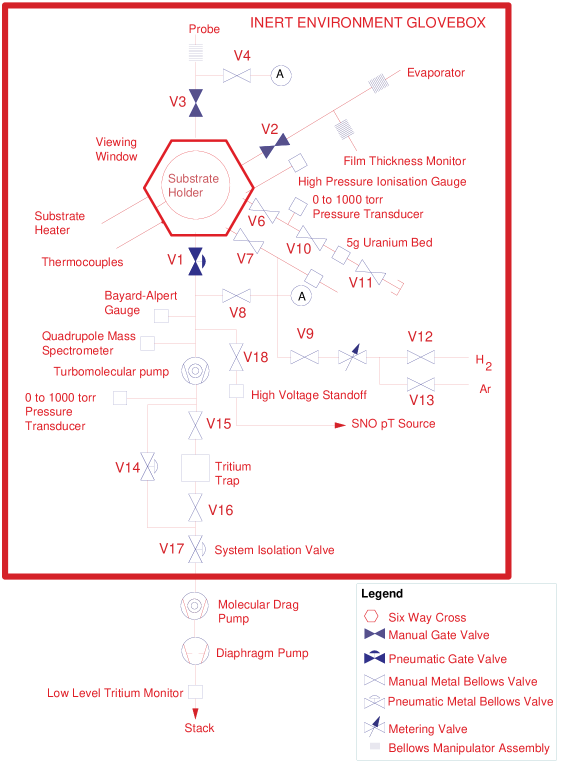
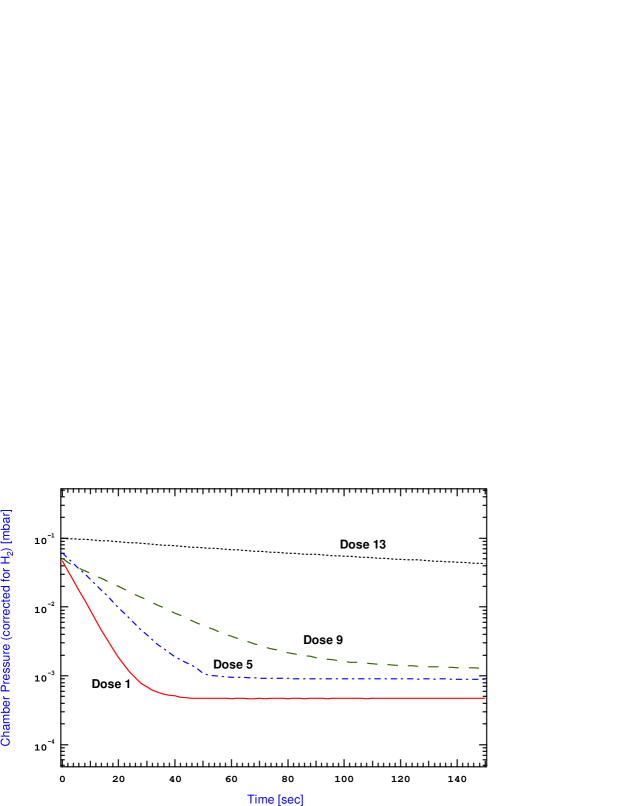
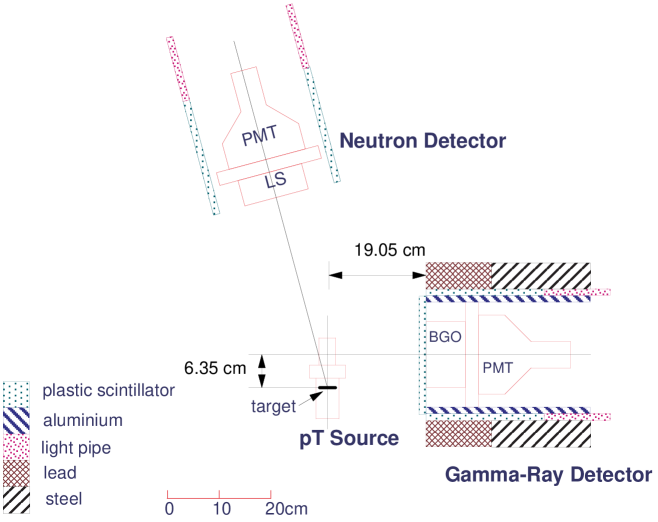
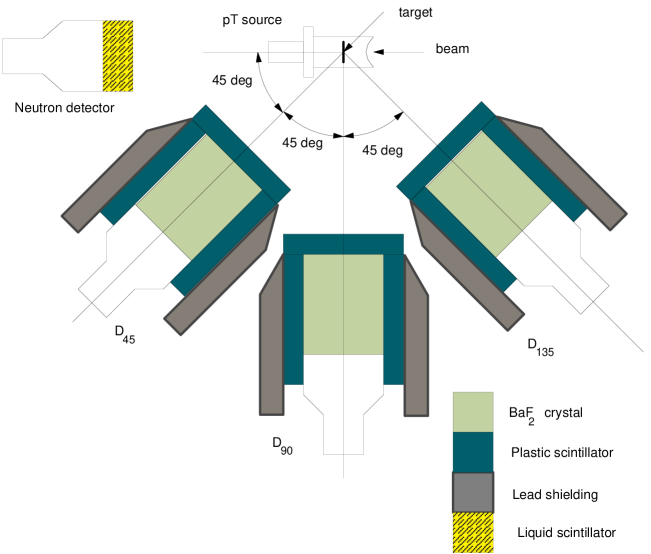
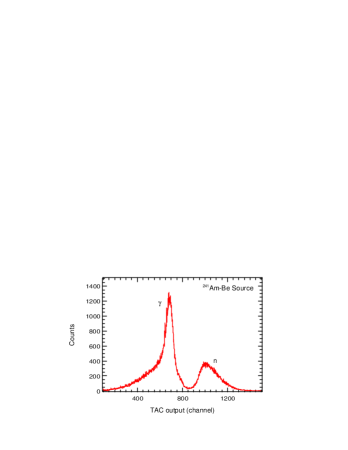
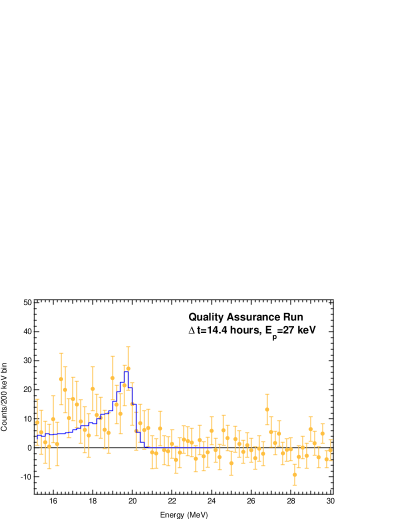
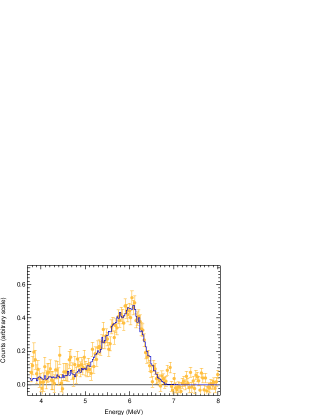
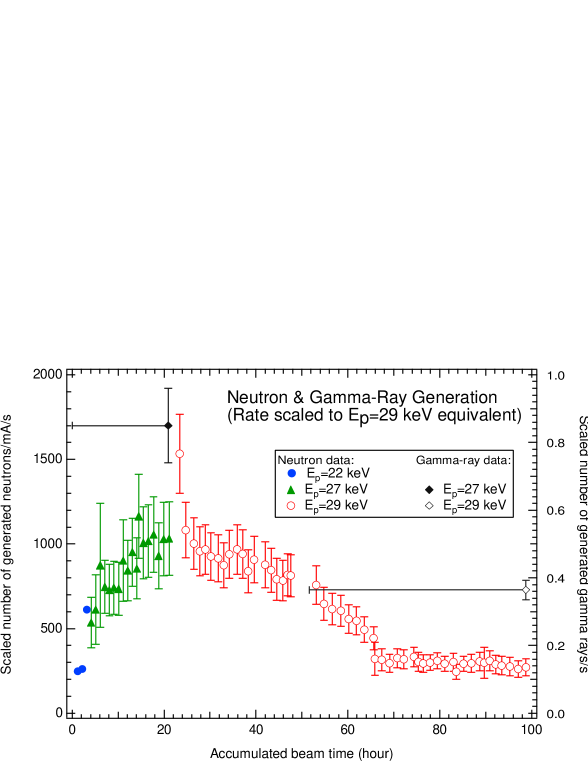

Table 1
minimisation results in fitting the S-factors from
Hahn et al.
Table 2
Isotopic composition of the tritium gas used in the target.
Figure 1
Cross sectional drawing of the source.
Figure 2
Extrapolated S-factors for the 3H()4He reaction. Measured S-factors by
Perry and Bame [2] and Hahn et al. [3] are
shown as data points in this plot. Hahn et al. used a BGO
detector and a NaI detector in their measurements, and the results for
these two detectors are shown separately here. The solid curve is the
fitted curve to the combined data in Hahn et al.
Figure 3
Estimated gamma-ray yield from the source. The yield is plotted
against the mass-1 fraction in a 50A, 27-keV beam.
Hydrogen isotopes in the beam and the target were assumed to be
completely mixed. The yield shown here should be treated as the upper
limit because target degradation was not taken into account in the
calculation. The dotted lines are the calculated uncertainties based
on the uncertainties in the physical parameters of the constructed
source and the cross section ([5]).
Figure 4
Schematic of the scandium tritide target evaporation vacuum system.
Most of the setup is enclosed in a dry nitrogen environment inside a
glovebox (from [16]).
Figure 5
Tritium pumping by the scandium film. The pumping curve for Doses 1,
5, 9 and 13 are shown here.
Figure 6
Top view of the BGO detector setup for the quality assurance testing of the source. The separation between the liquid scintillator (LS) and the target
of the source is about 36 cm.
Figure 7
Schematic of the BaF2 detector system. The three BaF2
detectors were oriented at 45∘ (D45), 90∘
(D90), and 135∘ (D135) to the beam direction, whilst
the neutron detector was oriented at 2∘ to the beam
direction. The separation between the centre of the target and the
front face of the BaF2 crystals was 35.6 cm for D90, and
25.4 cm for D45 and D135. The neutron detector was located
at 20.6 cm from the centre of the target.
Figure 8
Timing distribution of liquid scintillator pulses generated by
neutrons and gamma rays in a 9Be(,n)12C∗
source. Neutrons are cleanly separated from the gamma-rays using the
pulse shape discrimination scheme outlined in the text.
Figure 9
Background-subtracted BGO energy spectrum in the quality assurance run
at Queen’s University. The data points constitute the
background-subtracted energy spectrum. The histogram shown is a fit
using a response function for the BGO spectrometer generated by GEANT.
The measured yield of the source during its running at 27 keV is
(0.670.11) s-1. The excess near 16 MeV was due to
statistical fluctuation, as this was not observed in the later running
of the source.
Figure 10
Comparing GEANT generated gamma-ray line shape to measurement. The
data points correspond to the 6.13-MeV line from a calibrated
16O∗ de-excitation source. The solid histogram is the
GEANT generated line shape.
Figure 11
Scaled neutron and gamma-ray production by the source at
=29 keV. The rates were normalised to the current drawn from
the target power supply during the runs. Also, the production rates
for the =22 keV and 27 keV runs have been scaled to the
=29 keV level. The scaling was done by assuming a pure atomic
beam of protons or tritons since the contribution to the signals from
molecular ions are much smaller. The “error bars” on the
accumulated beam time for the gamma-ray results represent the time
intervals in which the mean production rates were calculated. The
gamma-ray yield could not be extracted reliably between the 20-th and
the 50-th hour of the source lifetime because a noise problem in the
electronics system, which was subsequently eliminated.
Figure 12
Monte Carlo simulated SNO photomultiplier tube array response to
neutrons and gamma rays that are generated by the source. The
abscissa value, , is the number of photomultiplier tube hits
in the SNO detector. The -to-energy calibration in this
Monte Carlo represents our best estimate, but not the calibrated
response of the SNO detector. In the pure D2O running scenario (top
panel), the peak centering at 50 is the 6.25 MeV
photopeak from 2H(n,)3H. In the salt running
scenario, neutron capture on 35Cl generates a gamma cascade with
a total energy of 8.6 MeV. This is the reason for the broader neutron
capture peak in the bottom panel. In these figures, a neutron
production rate of 2,500 s-1 and a gamma-ray production rate of
0.6 s-1 were assumed. The sharp “peak” in the bottom panel
arises from scaling of the Monte Carlo spectrum to correspond to the
neutron production rate above. The spectra represent about 3 hours of
run time in the SNO detector.