Estimation of Weighting Potential for a TPC
b CERN CH-1211, Geneve, Switzerland
supratik.mukhopadhyay@saha.ac.in, nayana.majumdar@saha.ac.in,
Rob.Veenhof@cern.ch)
Abstract
In this work, we have computed the three dimensional weighting potential, field and pad response function (PRF) of typical time projection chambers (TPC) using a recently formulated and developed boundary element method solver, namely, the nearly exact BEM solver. A realistic geometry of the device is found to have significant influence on the estimation of signal generation.
1 Introduction
Over the last three decades, the time projection chamber (TPC) [1] has been considered as one of the important and successful gas detectors, especially in accelerator based experiments. The signal in a TPC can be estimated using the Shockley-Ramo [2, 3] theorem following which the electric and weighting fields turn out to be two fundamental quantities.
In this work, we have computed the weighting potential of a typical TPC using a recently developed boundary element method (BEM) solver, namely, the nearly exact BEM (neBEM) solver [4, 5]. Weighting potential, field and pad response function of TPC-s of realistic geometries have been accurately estimated using this solver. Results for a two-dimensional strip detector for which an analytic solution exists (thereby neglecting the presence of the anode wires altogether) or those obtained by using elegantly derived semi-empirical expressions [6], cannot be considered to be accurate for all possible geometries. As is evident from our results, presence of the anode wires and three-dimensionality of the detectors do alter the weighting potential considerably.
In this regard, the finite element method (FEM) packages (commercial or otherwise) are known to perform poorly in spite of consuming large amount of computational resources. On the other hand, conventional BEM solvers are also known to suffer from several drawbacks. In the present formulation, many of the drawbacks of BEM have been removed and, as a result, the neBEM solver can be used very effectively to solve for problems related to estimating the electrostatic configuration of TPCs.
2 Background
According to the Shockley-Ramo theorem, the current induced at time on an electrode due to a charge at position can be evaluated as follows:
| (1) |
where represents the charge, is its velocity and is the weighting field at associated with the electrode under study. Similarly, PRF is also used for estimating signal induced on cathode pads. It is necessary to be able to compute the mentioned parameters to an acceptable accuracy in 3D. It may be mentioned here that the final aspects of signal generation can be very effectively modeled by Garfield [7].
3 Results and discussions
3.1 Comparison with analytical solutions
A simple closed-form expression for the weighting potential exists for a 2D strip detector with no gap between strips. It can be written as [8]
| (2) |
where
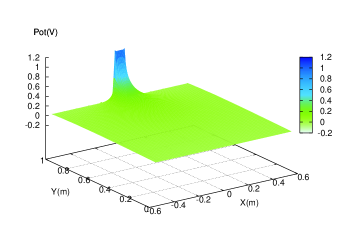
The surface plots of weighting potentials obtained using the neBEM solver have been presented in fig.1(a). Qualitatively, the comparison with the analytic result [8] is found to be very satisfactory.
3.2 Effect of the presence of anode wires
In order to estimate the effect of anode wires on the electrostatic configuration, we have included a plane of wires within the simple geometry considered above (termed wired).
The weighting potential along Y for the unwired simple detector naturally matches perfectly with the exact solution. The wired detector, however, has a significantly different weighting potential distribution throughout, the difference being very large near the anode wire (fig.1(b)). This is logical because the anode wire provides a new zero potential surface. This deviation creates a large electric field, Ey, near the anode wire which, naturally, influences the generated signal.
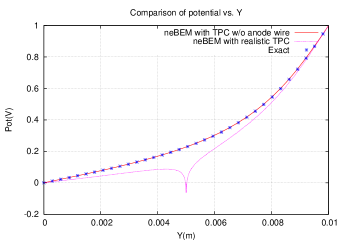
Thus, it is noted,that the naive use of analytic expressions may lead to non-negligible errors.
3.3 Computations for a realistic TPC
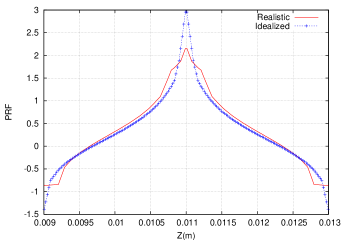
Next, we have considered a realistic TPC where the surface representation of the cathode wire plane has been corrected. We have also considered gaps between segments in this geometry. In the idealized TPC, we have ignored these gaps. As preliminary estimation, we have computed the one-dimensional PRF using the weighting field distribution and presented the results for the two TPCs in fig.2(a). It can be seen that omission of gaps between segments of the cathode plane can lead to small, but finite, error in estimating the PRF as well.
3.4 Three dimensional effects
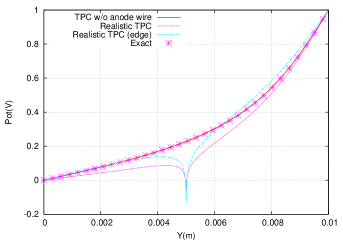
In fig.2(b), we show a comparison between the weighting potentials of a 2D strip detector (analytic solution), the same at the mid-plane of a realistic (anode wires added to the analytic geometry) TPC detector, in addition to the values obtained at the edges of the same realistic TPC detector. The significant amount of difference between the mid-plane and the edge values is immediately apparent. This difference emphasizes even more the importance of precise computation of electrostatic configuration for a TPC.
4 Conclusion
Accurate 3D weighting potential and fields have been calculated using the recently developed neBEM solver. Now, it should be easy for us to simulate the charge / signal induced on any electrode of a detector due to the passage of an ionizing particle passing through a detector by calculating the real field within the detector (can be done using the present solver) and the drift velocity (can be done using [7]).
References
- [1] C. D’Ambrosio, T. Gys, C. Joram, M. Moll and L. Ropelewski, CERN – PH/DT2, 2a/1, Particle Detectors – Principles and Techniques
- [2] W. Shockley, J Appl Phys 9, p.635 (1938)
- [3] S. Ramo, Proc. IRE 27, p.584 (1939)
- [4] S. Mukhopadhyay, N. Majumdar, Engg. Analysis Boun. Elem., 30, pp.687-696 (2006)
- [5] N.Majumdar, S.Mukhopadhyay, Nucl. Instr. Meth. Phys. Research, 566, pp.489-494 (2006)
- [6] E.Gatti, Nucl. Instr. Meth. Phys. Research, 163, pp. 83-92 (1979)
- [7] R.Veenhof, http://garfield.web.cern.ch/garfield
- [8] P. Rehak, D. Cline, E. Gatti, C. Heusch, S. Kahn, B. King, T. Kirk, P. Norton, V. Radeka, N. Samios, V. Tcherniatine, and W. Willis, Detector challenges for colliders in the 10-100 TeV range, BNL 67213 (2000)