All-optical delay of images using slow light
Abstract
Two-dimensional images carried by optical pulses (2ns) are delayed by up to 10 ns in a 10 cm cesium vapor cell. By interfering the delayed images with a local oscillator, the transverse phase and amplitude profiles of the images are shown to be preserved. It is further shown that delayed images can be well-preserved even at very low light levels, where each pulse contains on average less than one photon.
All-optical methods for delaying images may have great potential in image processing, holography, optical pattern correlation, remote sensing, and quantum information. For example, in many digital image processing applications, the amplitude and phase information of images must be preserved. Electronic conversion of optical images requires relatively intense optical fields and information is lost in analog to digital conversions. Alternatively, one could use a long free-space delay line; however, diffraction and physical space limitations impose serious restrictions on such a system. A small all-optical buffer in which the phase and amplitudes of the image are preserved would solve these problems.
In this work, we report on a series of several “slow light” experiments showing that two-dimensional images can be delayed while preserving the amplitude and phase information of the images. The system we use has several noteworthy characteristics. It requires no additional laser beams to prepare the slow light medium. This results in low background noise and a high signal-to-noise ratio in the delayed image, even at very low light levels. The transverse images can be delayed by many times the pulse length without affecting the phase stability of the image. This is demonstrated by interfering the images with a pulsed local oscillator and monitoring the interference pattern. The interference stability has almost no dependence on fluctuations in the group velocity in the slow light system, but only on the phase velocity, which is unaffected by a slow light medium. This property leads to stable and high fringe visibility when the delayed image interferes with a local oscillator even if the slow light medium has moderate thermal instabilities.
Slow light is the name given to the subfield of optics that deals with the slow group velocity (the velocity at which the energy travels) of a light pulse in a highly dispersive mediumboyd02 ; chiao02 . A dispersive medium has a frequency-dependent index of refraction, which occurs in any system having frequency-dependent absorption. The slow light medium used in the present experiments is a hot Cesium (Cs) vapor. Delay bandwidth products (the delay of the light signal in the medium multiplied by the bandwidth of the signal) in excess of 50 camacho06 can be achieved by spectrally tuning the signal between the two D2 hyperfine ground states.
While several methods for achieving slow light have been explored, the system discussed here is particularly attractive. For example, most slow light systems, such as electromagnetically induced transparency kasapi95 ; jain95 ; kash99 ; Budker99 ; hau99 ; liu01 ; turukhin02 , coherent population oscillations bigelow03 ; Zhao05 ; palinginis05 or spectral hole-burningcamacho06_2 , require additional light fields to prepare the medium. The use of additional light fields results in transverse spatial inhomogeneities in the group velocity of the medium. To the authors’ knowledge, the only previous studies of transverse images in a slow light medium were performed by Harris’ group kasapi95 ; jain95 . In the Cs system used here, the group velocity is the same in all directions. Also, this system has relatively low loss and minimal broadening of the pulse.
A brief overview of some of the most important theoretical elements will be given. A more detailed treatment of the propagation of a Gaussian light pulse through a medium with two widely spaced absorbing Lorentzian optical resonances may be found in previous work tanaka03 ; macke06 ; camacho06 ; zhu06 . Assuming two Lorentzian absorption resonances of equal strength, the complex index of refraction may be written as the sum of a free-space term (unity) and two distinct Lorentzian terms:
| (1) |
where each resonance has a strength , a spectral half-width , is the detuning from the midpoint between the two resonances, and 2 is the separation between the resonances. If the bandwidth of the input pulse is much less than the resonance spacing 2, we may expand the refractive index in a power series and keep only the first few terms. The real and imaginary parts of the index of refraction, responsible for pulse delay and absorption respectively, may then be written as
| (2a) | |||
| (2b) |
It can be seen that , which can be used to obtain a simple form for the group velocity. Combining this result with , where is the optical intensity absorption coefficient of the medium at the pulse carrier frequency, one obtains an approximate group velocity
| (3) |
If the medium is of length L, the resulting pulse delay in the medium is approximately
| (4) |
Several points are worth noting. First, the pulse delay is given entirely by the width of the optical resonances and the optical depth of the medium at the pulse center frequency, and is independent of the separation of the optical resonances. Second, the signal bandwidth is only limited by the frequency separation of the two optical resonances (e.g., 9.2 GHz in Cs), which can be very large. Third, the group velocity is isotropic in the sample. Fourth, while not treated here, the temporal broadening of the pulse in the delay medium is relatively small camacho06 , owing to the fact that the dispersive broadening dominates the absorptive broadening.
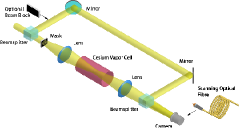
Consider the experimental setup represented in Fig. 1. Light pulses with a duration of 2 ns full width half maximum (FWHM), repeating every 7 ns, are used in the experiment. The pulses are generated by passing a CW laser beam through a fiber-coupled, high-speed electro-optic modulator (DC to 16 Gb/s). The laser frequency is set halfway between the two hyperfine ground state resonances of the D2 lines (852 nm wavelength) in Cesium. The pulses enter an unbalanced Mach-Zehnder interferometer with a free-space path mismatch of 5 ns. The pulses propagating in the long path are reference pulses (local oscillator) that are made to interfere with the pulses exiting from the slow light medium in the short path. In the short path, the pulses impinge on an amplitude mask, and are called image pulses. A 4.5-lines-per-millimeter test pattern was used as the mask. The hot Cs vapor is in the middle of a 4f imaging system, which consists of two identical 150 mm lenses. In a 4f imaging system the object is placed a focal length (150 mm) in front of the first lens, the distance between the two lenses is two focal lengths (300 mm), and the image is produced in the back focal plane of the second lens. The 4f system was used to eliminate the quadratic phase in the image plane. The group delays in the cell are varied by changing the vapor pressure through temperature control of the cell.
The image and reference pulses interfere via the second 50/50 beam splitter. One of the mirrors in the long path has a piezo-actuated mount allowing for precision translations of the mirror. Movements on the order of a few nm are possible allowing for control of the relative phase of the reference and image pulses at the beamsplitter. By translating the mirror through a phase shift of radians, it is possible to measure the fringe visibility. The interference images were measured on a CCD camera run in continuous mode (a CCD camera capable of gating pulses in a 2 ns pulse window was unavailable for the present study).
The experimental apparatus for the weak light fields experiment is considerably different from the macroscopic light fields experiment discussed above. Pulses of light of 4 ns FWHM duration, repeating every 330 ns, are created in the same way as the macroscopic light fields. However, the pulses are attenuated so that, on average, there is less than 1 photon per pulse impinging on the amplitude mask. The long arm of the Mach-Zehnder interferometer is blocked, leaving only a straightforward 4f imaging system and the slow light medium. To recreate the image, a scanning multimode fiber with a 62 m diameter core is used to collect the photons in the image plane. The multimode fiber is coupled to a single-photon counting module with 300 ps detector jitter (Perkin Elmer SPCM). The electronic signal from the detector is sent to a 16 ps resolution time-to-digital converter and is time-stamped. The multimode fiber is continuously scanned using computer-controlled translation stages with 20 nm resolution. The position of the the translation stages is recorded as a function of time. The clock of the computer-controlled translation stages is synchronized with that of the time-to-digital converter using the electronic pulse that is driving the electro-optic modulator. Thus, the 2-dimensional image is reproduced by binning the photon detection events into the 2-dimensional positions at which they were detected. Background counts (e.g., light from the room or detector dark counts) in the image are significantly reduced by only accepting time-binned data centered around the relative delay of the image, within a time window that is determined by the parameters of the pulse. This can be done in postprocessing of the image by looking at the temporal histogram of arrival times. The interferometer was not used in the weak fields experiment for the practical reason that the relatively large interferometer was not phase stable for the entire scan duration.
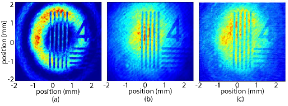
Consider the results for the macroscopic image interference shown in Fig. 2. In Fig. 2(a), the Cs cell temperature is set to give 5 ns of delay, which matches the arrival time of the image pulses at the second beamsplitter to that of the reference pulses. The situation in which both pulses arrive at the beamsplitter simultaneously will be referred to as“temporally matched”. The intensity along the two paths is balanced for maximum interference. The phase of the local oscillator is set to give a dark fringe in the center of the image. Several radians of phase shift across the image can be observed. The only regions that do not experience interference are the image points of the dark patterns of the amplitude mask. Since there is no light in the delayed image at those points, the local oscillator creates a constant background where the dark regions of the amplitude mask are imaged. Hence, at the center of the dark fringe the inverse image is created. An interference visibility of 90 % 1 % was observed for the temporally matched pulse regime. The pulses from the two arms of the Mach-Zehnder interferometer are then misaligned in time, so as to arrive at the beamsplitter at different times. This is accomplished by either removing the cell or by tuning the delay of the pulse. In both cases the observed visibility dropped, as seen in Figs. 2 b) and c), respectively. The images show the same number of phase shifts as the temporally matched pulses but the interference visibility (after balancing the intensity in each arm) is 6% for cell removal and 15% for delay tuning, far lower than the 90% visibility for the temporally matched case. As a note, there is always a small amount of CW light leaking through the electro-optic modulator, which has a 100:1 extinction ratio. The CW light is the primary culprit in giving the nonvanishing interference visibility when the pulses are temporally mismatched. The amount of CW light can be much greater than 1% of the total light since it is constantly “on”, which can lead to a much larger integrated CW signal. In the interference experiment, the CW background is about 5%. The CW background light can be removed by using a camera that is able to gate around a 2 ns window in a fashion similar to that of the low light-level experiment.
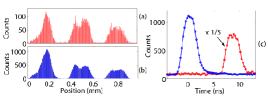
The experimental results for the weak field images are shown in figures 3 through 5. Figs. 3(a) and (b) show a delayed and non-delayed one-dimensional image (a bar test pattern) where each pulse impinging on the image mask contains, on average, 0.5 photons. The images are measured by scanning an optical fiber in a line across the image plane for a total duration of 36 seconds. A histogram of the photon arrival times is made for each incremented position of the fiber (an effective pixel) as it scans across the image (shown in Fig. 3(c)). The measured image is the convolution of the image with the fiber core. For these scans, the laser frequency is set halfway between the optical resonances and the temperature of the cell is set to give 9 ns of delay (shown in red). The process is repeated but with the laser frequency tuned far from either resonance, which gives almost no delay (shown in blue). Approximately 99% of extraneous counts from background light and detector dark counts are removed by constructing the images using only those photons which arrive in a 4 ns time window (out of the entire 330 ns window) centered on the middle of the pulse arrival time distribution. An analysis of the undesirable counts led to an estimate of approximately 2 extraneous counts per spatial bin shown in Fig. 3, which is in good agreement with the image noise.
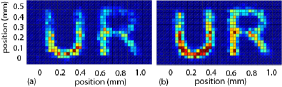
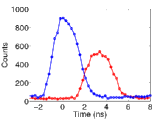
Figure 4 shows the delay of a two-dimensional image comprised of the letters “UR” representing the researchers’ institution. In this part of the experiment, each pulse contains, on average, 0.8 photons before arriving at the image mask. The image is constructed by raster scanning a fiber across the image plane in a total time of approximately 48 seconds. The time-binned filtering technique described above was also used to remove background counts from the two-dimensional images. A histogram of the photon arrival times for the two dimensional images of Fig. 4 is shown in Fig. 5., showing the delayed image pulses. Even though every photon used to construct the image is delayed by approximately 3 ns, the image is preserved with high fidelity.
A few comments about the results are in order. First, the propagation through the medium is a classical effect, meaning that its behavior does not change in going from classical fields to quantum fields. A formal demonstration of the preservation of quantum fields was not undertaken in the present study. However, the preservation of amplitude and phase as well as the low noise characteristics imply that this system can be an integral part of quantum image buffering. The development of a highly multimode quantum image buffer is a much different goal than that of the preservation of two state systems that have been recently studied (qubits)liu01 ; phillips01 ; Kocharovskaya01 ; turukhin02 ; bajcsy03 ; Yanikdec04 . Second, the homogeneous linewidth of the cesium atoms ultimately determines the upper limit in the absolute delay of our slow light system. However, much narrower resonances could achieve a much larger upper limit of the delay at the expense of the usable signal bandwidth.
In conclusion, it is shown that a transverse image can be delayed in a slow light buffer. The buffer is shown to be able to delay the image by many pulse widths, while also preserving its amplitude and phase characteristics. The image is interfered with a pulsed local oscillator. When the local oscillator and image pulse are temporally overlapped, high visibility fringes with 90% visibility are observed, demonstrating the preservation of phase information after a 5 ns pulse delay. When the local oscillator and image pulse are temporally misaligned, low visibility fringes are observed, demonstrating the pulsed nature of the imaging system. The slow light system is then used to delay an image using weak-light pulses. Pulses with less than one photon on average are used to image an amplitude mask. The image of the mask is reproduced with high fidelity and low noise, demonstrating 9 ns pulse delays of images at very weak light levels.
This research was supported by DOD PECASE, DARPA Slow Light, NSF, and the Quantum Imaging MURI.
References
- (1) R. W. Boyd et al., Progress in Optics (Elsevier, 2002), p. 497.
- (2) R. Y. Chiao et al., Optics and Photonics News 13, 26 (2002).
- (3) R. M. Camacho et al., Phys. Rev. A 73, 063812 (2006).
- (4) A. Kasapi et al., Phys. Rev. Lett. 74, 2447 (1995).
- (5) M. Jain et al., Phys. Rev. Lett. 75, 24, 4385 (1995).
- (6) M. M. Kash et al., Phys. Rev. Lett. 82, 5229 (1999).
- (7) D. Budker et al., Phys. Rev. Lett. 83, 1767 (1999).
- (8) L. V. Hau et al., Nature 397, 594 (1999).
- (9) C. Liu et al., Nature 409, 490 (2001).
- (10) A. Turukhin et al., Phys. Rev. Lett. 88, 023602 (2002).
- (11) M. S. Bigelow et al., Science 301, 200 (2003).
- (12) X. Zhao et al., Optics Express 93, 7899 (2005).
- (13) P. Palinginis et al., Optics Express 13, 9909 (2005).
- (14) R. M. Camacho et al., Phys. Rev. A 74, 033801 (2006).
- (15) H. Tanaka et al., Phys. Rev. A 68, 053801 (2003).
- (16) B. Macke et al., Phys. Rev. A 73, 043802 (2006).
- (17) Z. Zhu et al., Optics Express 14, 16, 7238 (2006).
- (18) D. F. Phillips et al., Phys. Rev. Lett. 86, 783 (2001).
- (19) O. Kocharovskaya et al., Phys. Rev. Lett. 86, 628 (2001).
- (20) M. Bajcsy et al., Nature 426, 638 (2003).
- (21) M. F. Yanik et al., Phys. Rev. Lett. 93, 233903 (2004).