Justice in the Shadow of Self-Interest
An Experiment on Redistributive Behavior††thanks: Presented at the 2nd Polish Seminar on Econo- and Sociophysics, Cracow, 21-22 April 2006
Abstract
By means of laboratory experiment I examine the relation between fairness judgments made ‘behind the veil of ignorance’ and actual behavior in a model situation of income inequality. As the evidence shows, when material self-interest is at stake vast majority of subjects tends to abandon the fairness norm. Rather small regard for efficiency is present in the data. Furthermore, as low income players go through a sequence of games against high earners and experience changes in income disparity, the history effect proves to override structural characteristics of the redistribution game.
PACS numbers: 87.23.Ge, 89.65.-s, 89.65.Gh
1 Introduction
For good or for ill, income redistribution is one of the key functions assumed by modern governments. The underlying motive for it, as it is prevalently professed, is either a sympathy for the plight of the destitute, or a need to curtail the unjustifiable inequalities though, to be sure, it is far from common agreement what a justifiable division of income actually amounts to. To make matters all the more harder to analyze and judge, redistribution takes on so diverse forms that in some cases it may be nigh impossible to determine the net effect of income transfers. To give just one example, state-financed higher education, for a big part of it, is a vehicle for transfering funds from lower to higher income families [2]. Now the aim of this paper is not to disentangle all the intricacies of the redistributive machinery but rather to scrutinize the link between fairness judgments about income division and actual behavior in model situation of income disparity under controllable conditions of laboratory experiment. In doing so, I follow the ever widening path of research on income redistribution conducted under the general heading of bargaining games in experimental economics (see [3, 4, 5, 6, 7]). Readers interested in theoretical analysis of the phenomenon are referred to [8] and particularly [2].
The basis for this paper is the experiment I conducted in May 2005. The experiment consisted of two parts, pretest and experimental proper. All in all, 84 students participated in the first common meeting, and of this number 72 proceeded to subsequent experimental sessions. In total 12 six-person sessions were held and each subject participated in one.
The aim of the first common meeting was twofold. First, all participants were requested to fill a questionnaire on economic and political issues, as well as they were asked to make certain decisions dealing with division of money. Second, they were to earn money by performing tasks assigned to them. As I ventured on a study of redistributive behavior and its relation to fairness judgments, it was crucial that subjects’ initial payoffs were earned in such a way as to make the evaluation of fair distribution possible. I took pains to ensure that 1) task would be reasonably easy to perform yet 2) require various degrees of effort; 3) performance could be explicitly measured, and 4) subjects should be able to assess their effort’s worth. It is especially uncommon in vast experimental literature that condition 4 is met. The usual way to endow human subjects with initial incomes in all sorts of bargaining games is either by random rule, or according to persons’ scores on some kind of a test. In former case payoffs result from sheer luck, either good or bad. In latter case one may attribute them to subjects’ performances yet it is at best unclear why particular payoff scheme should be employed, which leaves much room for subjects’ unelicited disapproval of a scheme actually enforced by the researcher. In my experiment gainful task consisted in decoding one, two or four fixed-size fragments of Chronica Polonorum by Gall the Anonym (in its Polish translation, to be sure). Encryption method was a straightforward injection from the character set to a set of special symbols or ideograms, and a suitable ‘dictionary’ was provided at the top of each sheet. Participants’ evaluation of task’s worth was elicited by means of ‘request for quotation’ technique, i. e. all subjects were requested to quote, independently and in secret, their prices for decoding one, two and four sheets, and the lowest quoters were to get extra jobs for prices they named. As a matter of fact, 92% of the ‘full-time’ subjects quoted prices below the ones actually implemented and thus we may conclude that, save 6 exceptions out of 72, subjects had no intrinsic reason to be dissatisfied with initial payoffs they earned.
2 Decisions behind the veil of ignorance
Before each experimental subject actually learned whether he was to decode one, two or four sheets, as well as before he was told that a recompense for decoding each single sheet was 15 PLN, he had been requested to do the following:
Consider three persons, of whom Person A solved one sheet, Person B solved two sheets, and Person C solved four sheets. Suppose you have a total of 105 PLN to distribute among these three persons. How much would you pay to A, B and C respectively?
As subjects were yet unaware of their own income positions, their judgments were not marred by self-interested considerations and we may regard them as indicative of their true justice preferences. Since actual payoffs were fixed at a piecework basis it was important whether subjective fairness norms also posited a proportional 15-30-60 PLN division, and if not, what kind of bias they showed. In order to grasp it, I represented payoff scale as a weightless second-class lever of length 4 held in equilibrium by vertical force applied at the end of it. Amounts of work (1, 2, 4) were rendered as points on the lever arm at distances 1, 2, and 4 from the fulcrum respectively, and corresponding ‘fair’ payoffs were represented as loads attached to the arm at those points. The proportionality () of a given fair payoff vector was then defined as the ratio between the moments of force around the fulcrum produced by ‘fair loading’ and ‘proportional loading’ (the latter quantity being units). To be sure, proportional fairness produces =1 whereas every transfer from lower to higher income person increases value of and vice versa. As the results show, piecework solution () is a single self-evident fairness rule, supported by 42 out of 72 ‘full-time’ subjects (58%)111Of course other payoff vectors, e.g. 17-27-61 PLN, may yield as well but it was not the case with our subjects. . Other choices go both ways reaching minimum at .92 (for 20-35-50 division) and maximum at 1.11 (for 10-20-75). We dare say that actual support for proportionality could be even higher, had the total disposable lump sum been set at eg. 70 PLN thus making proportional division (10-20-40) somewhat more conspicuous for non-mathematically oriented subjects.
After making their choices on 105 PLN division, subjects were told what was the actual price for decoding each single sheet and they were asked to open envelopes (handed out to them at the very beginning) in which they were to find either one, or two, or four sheets of text to be decrypted on the spot. It was also made clear to the participants that all payments (15 PLN show-up fee included) should be realized only at the end of each of the forthcoming experimental sessions.
3 The redistribution game
3.1 Stage game
Redistribution game involves two players with unequal initial incomes222Players’ initial incomes could also be equal but then there would be no incentive for any redistribution whatsoever. The game could also be easily transformed to include more than two players, though in our experiment we employed only its two-person version. For a detailed analysis of infinitely repeated two-person redistribution game see my article [9].. For convenience sake from now on I will refer to the players as H and L (H for high and L for low income). Game consists of two consecutive parts. First, both members of the ‘dyad society’ are to democratically establish the rate of redistributive income tax which benefits L at the expense of H. Effective tax rate is an average of the rates simultaneously and independently proposed by both players and may be anything from 0 to 100%. However, fiscal transfer entails executive cost defined as a percentage of total tax revenues and thus fiscal redistribution always leads to efficiency loss. To present redistributive tax mechanism formally, let us denote players’ initial payoffs as and , their tax votes as and , and the fiscal cost as C. Players’ after-tax payoffs are then given by the following formula:
where and . As one may easily calculate, H suffers from any positive taxation, while L benefits iff his initial payoff is small enough, viz. . In my experiment three types of ‘dyad societies’ were formed, depending on subjects’ earnings, namely: 30-15 PLN, 60-30 PLN, and 60-15 PLN, and there were two possible levels of executive cost: 10 or 30%. Under any of these conditions, player L benefits from the operation of tax mechanism. Obviously, as far as strict material interest is concerned, optimal decision is for L to vote 100% and for H to vote 0% which results in 50% tax rate. Thus tax system may also be perceived as a tool with which L may take over some part of H’s initial income, while at the same time part of H’s income is lost due to executive cost. L’s gain and H’s harm from 50% tax redistribution for each combination of the type of dyad and the cost level actualized in the experiment are presented in Table 1. The efficiency of fiscal transfer, or a portion of money taken from H by means of tax system which finds its way to L, is given by /.
| Type of dyad | 30-15 PLN | 60-30 PLN | 60-15 PLN | |||
| Fiscal Cost | 10% | 30% | 10% | 30% | 10% | 30% |
| L’s gain at 50% tax [] | 2.63 | .38 | 5.25 | .75 | 9.38 | 5.63 |
| H’s harm at 50% tax [] | 4.88 | 7.13 | 9.75 | 14.25 | 13.13 | 16.88 |
| Efficiency of tax transfer | 54% | 5% | 54% | 5% | 71% | 33% |
After fiscal transfers have been realized, players have an option to pass some portion of their after-tax income to each other (again, decisions are taken simultaneously with no communication between players). These voluntary transfers are costless as there is no need to employ resources to force anyone to do what one is willing to do on one’s own. Now the final payoffs from the game are:
where is the lump sum given by player i to player j.
Let be the amount that L is capable of taking over from H by voting and thus boosting tax rate to , and let be the amount lost by H as a consequence. To see dilemmatic nature of the game, suppose H considers a free transfer to L, , such that while L chooses between tax vote of 0 and 1.
| Values in cells are final payoffs , | |||
|---|---|---|---|
| 0 | |||
| 0 | , | , | |
| 1 | , | , | |
As Table 2 reveals, both players have dominant strategies: for L it is to vote , while for H it is to donate nothing, . Both players, however, should be better off if L voted and H donated . This feature of the redistribution game makes it a semblance of asymmetric continuous prisoner’s dilemma.
3.2 Experimental procedure
All in all, 12 experimental sessions were held, each of them including six subjects: two low earners of 15 PLN (S1), two medium earners of 30 PLN (S2), and two high earners of 60 PLN (S4)333Total size of a single group had to be limited for technical reasons. . After having been acquainted with the workings of redistributive tax mechanism, subjects underwent a four-round trial game, and then proceeded to four ‘real’ twelve-round games (single round being the stage game described in the previous paragraph). Subjects’ initial incomes at the beginning of each round were equal to what they had earned during the pre-experimental meeting. To be sure, S1s in all their games occupied L position, S4s were in H position all the time, while S2s were in H position when playing against S1, and in L position when playing against S4.
All games were played in local computer network and subjects could not communicate with each other, except they were being informed on a current basis about decisions made by the other player444Program was waiting until both subjects made their decisions and only then their choices were revealed to each other. . All the time they also had in view gradually updated history panel with data on their own as well as their partner’s tax votes, after-tax incomes, free transfers and resulting final incomes for each completed round. It was made explicitly known to the subjects that their ultimate payoff from the experiment (in cash) would be an average over all rounds’ final payoffs so each decision they were to make would bear financial consequences both for them and their partners.
Each subject played four 12-round redistribution games, going through all four partner-cost configurations. Depending on order of partners and order of fiscal costs, there were four possible histories for each type of player. By way of example, low income player’s history of games could be one of the following (fiscal cost in parentheses):
-
1.
[S1-S4 (10%) S1-S4 (30%)] [S1-S2 (10%) S1-S2 (30%)]
-
2.
[S1-S4 (30%) S1-S4 (10%)] [S1-S2 (30%) S1-S2 (10%)]
-
3.
[S1-S2 (10%) S1-S2 (30%)] [S1-S4 (10%) S1-S4 (30%)]
-
4.
[S1-S2 (30%) S1-S2 (10%)] [S1-S4 (30%) S1-S4 (10%)]
Thus subject’s partners, according to their income levels, were ordered either decendingly (histories 1 or 2) or ascendingly (histories 3 or 4). The same is the case with the cost order within the doubleheaders555There was no change of partners within the doubleheader, though subjects were not informed that they played two consecutive games against the same person. In the listing above, the-same-partner games are rendered by means of square brackets. : subjects with history 1 or 3 experienced growing cost, while subjects with history 2 or 4 experienced diminishing cost. Important feature of this scheme is that S1-S4 (as well as S1-S2) games are played under two much different circumstances. In history conditions 1 and 2, we have inexperienced S1 matched with equally inexperienced S4. However, in history conditions 3 and 4, when it comes to S1-S4 doubleheader, S1 has already had experience of playing against S2 in first two games—and the same holds true for S4 who has already been playing against S2 in his first two games. In this manner, we may examine the impact of history on redistributive behavior. Mutatis mutandis, all things said above apply to medium and high earners as well.
4 Results
4.1 Justice considerations
First thing to be noticed in the empirical data on redistribution game is a vast disregard for efficiency manifest in mean tax votes made by lower earners of the dyads, which is in stark contradiction with the data one typically gets in survey studies. Basically, respondents claim that no transfer should be made if the efficiency loss exceeds 20-30% [7]. Now if you recall Table 1, the most efficient game in our set was 60-15 PLN under 10% fiscal cost, and in this very case efficiency loss amounted to no less than 29%. In all other cases transfers were even less efficient, with extreme at 60-30 PLN and 30-15 PLN under 30% fiscal cost, in which outrageous 95% of the transfer was bound to be lost. Now subjects’ actual behavior in redistribution game amply demonstrates the difference between ‘cheap talk’ and decisions made when one’s monetary interest is at stake. Table 3 shows mean tax votes, final incomes and free transfers from H to L (corrected for the amount L sent back) obtained in the first two games, viz. before the change of partners took place.
| Type of dyad | 30-15 PLN | 60-30 PLN | 60-15 PLN | |||
| Fiscal Cost | 10% | 30% | 10% | 30% | 10% | 30% |
| Higher earner’s mean tax vote (%) | 1.33 | 2.22 | 1.77 | 1.79 | 4.43 | 5.12 |
| Lower earner’s mean tax vote (%) | 56.73 | 40.92 | 58.82 | 53.99 | 78.55 | 74.79 |
| Higher earner’s final income (PLN) | 26.80 | 26.29 | 51.91 | 49.72 | 48.76 | 46.21 |
| Lower earner’s final income (PLN) | 16.90 | 15.80 | 35.36 | 32.76 | 23.14 | 19.80 |
| Mean free transfer from H to L (PLN) | .38 | .64 | 2.18 | 2.34 | .35 | .30 |
| Number of games | 12 | 11* | 12 | 12 | 11* | 12 |
* Data from one game was lost due to technical problems.
Of the three types of dyads, only in 30-15 PLN condition there was a significant impact of fiscal cost on L’s voting behavior—under heavier cost his tax claim was lesser by 16 percentage points (Wilcoxon’s matched-pairs signed-ranks test, p=0.042). Still, even here under the extremely inefficient 30% fiscal cost, meaning that only 1 grosz finds its way to the low-income voter out of every 20 taken from the high earner, L’s average tax vote exceeded 40%. It is also to be noted that where tax transfers are extremely inefficient (30-15 and 60-30 PLN dyads under 30% cost) one may expect free transfers from H to contribute more to L’s welfare than tax redistribution does. Indeed, in the 30-15 dyads low earners ultimately increased their payoff by 0.80 PLN (from initial 15.00 to 15.80) but lion’s share of that increase, 0.64 PLN, was due to free transfers on part of the ‘rich’. And it is quite similar with 60-30 dyads in which 2.34 out of 2.76 PLN increase came from H, leaving only 0.42 PLN for workings of the tax system.
Certainly, it is also a clearly evident trait in the data that larger relative income disparity makes the appetite for redistribution harder to resist. In 60-15 PLN dyad, mean tax vote by L was at least 20 percentage points higher than in the other two types of dyads. This is true both for 10 and 30% fiscal cost, though only under 30% cost the difference turns out to be statistically significant (Kruskal-Wallis test, p=0.03).
However inefficient subjects’ choices might have been, they might have still reflected their a priori distributive justice preferences. As far as L’s choices are concerned, they might have affected H’s payoffs in two ways: diminish them by positive tax vote and/or increase them by means of a free transfer. What we are going to do now is calculate what H’s final payoff would be if it depended solely upon L’s decisions (i.e. if H had not reduced his own payoff either by a non-zero tax vote, or by a non-zero free transfer). Then we should compare the resulting sum with L’s beliefs, elicited behind the veil of ignorance, on what his opponent’s fair payoff should be.
Suppose there was enough money to defray ‘fair’ payoffs for both of them while H’s ‘fair’ payoff did not exceed his actual initial income. The former condition guarantees that in order to abide H’s ‘fair’ payoff, L did not have to give up a bit of his own ‘fair’ payoff, while the latter condition ensures that following L’s fairness rule demanded of him no more than preserving status quo. As a matter of fact, was H’s ‘fair’ payoff smaller than his initial income in the game, fairness rule would even allow a certain dose of tax redistribution. Under such circumstances, if L’s actions had driven his partner’s payoff below the ’fair’ level, then it would clearly indicate that some other considerations, be it self-interest or envy, have been at work here that ultimately turned out to override any regard for fairness. Now in 29 out of total 35 games that were played as first in a series of four, the sum of initial incomes was actually greater or equal to the sum of L’s and H’s ‘fair’ payoffs as perceived by L, and in none of these games H’s ‘fair’ payoff exceeded his initial income. As results show, in 23 out of those 29 games subjects in L position (79%) violated their own fairness rules. In 60-15 PLN dyads, which offered strongest material incentives for L to exploit tax system, majority of low earners went as far as diminishing H’s ‘fair’ payoff by more than 10 PLN.
4.2 History effect
In previous paragraph we analyzed only first-partner games. Let us now examine how first-partner experience affected voting behavior of 15 PLN earners in their second-partner games. When we consider all 15-60 games, half of them was played with no experience at all, and half of them was played after both L and H had already played a doubleheader against 30 PLN earners. Similarly, half of all 15-30 games were played by inexperienced subjects, while the other half was played by subjects who had already been through a doubleheader vs. 60 PLN earners. Now, as the evidence shows, impact of history is virtually overwhelming.
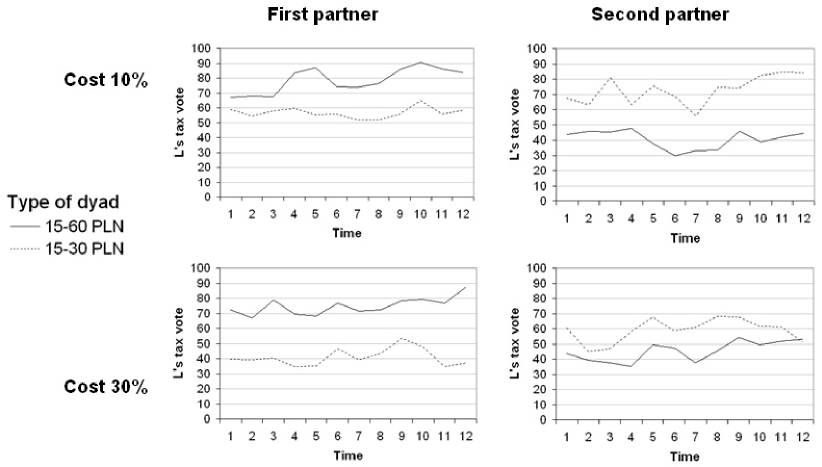
In first-partner games, as it was mentioned before, larger income disparity resulted in low earners’s greater demand for tax redistribution, and it was especially visible under 30% fiscal cost. Now the results from the second-partner games are in striking contrast to this: appetite for redistribution grows substantially in 15-30 games and it lessens in 15-60 games so that eventually the relation between income disparity and demand for fiscal redistribution is reversed. A plausible explanation of the phenomenon is that in terms of inertia present in social systems. In spite of a significant change in environment, subjects tended to inherit, to some extent, their behavior from before the change. Low earners who played their first two games against subjects four times richer than themselves learned that aggressive tax voting pays off and their moral reluctance to exploit the better-off party, if any reluctance they had indeed, must have been weakened. Thus when in the last two games they were confronted with subjects merely twice richer, it was relatively easier for them to forego fairness considerations and act on their self-interest. The reverse is true in case of low income players whose first experience was with 30 PLN earners: it was neither so beneficial to indulge in tax redistribution, nor it seemed so much justified to exploit subjects whose initial income was medium rather than high. In this manner low earners, so to say, learned to contain their appetite for redistribution at the expense of the richer party, and it was relatively easier for them to stick to the fairness rule once they came up against 60 PLN Croesus. However plausible this a posteriori explanation may seem, it is still surprising that the history effect was so powerful as to completely override the incentives inherent in the structure of the games.
5 Concluding remarks
The outright dominance of self interest over a priori justice considerations is readily observable in the contrast between choices made behind the veil of ignorance and those made in the course of the game. Subjects in lower income position were taking advantage of redistributive fiscal mechanism even in face of the gravest efficiency loss. It is a rather sorry information for those who would like to infer people’s attitudes towards tax system from their responses to survey questions.
As far as dynamics of redistribution are concerned, we may sketch two broad conclusions. First, substantial amount of inertia is present in social system, and one should not expect immediate shift in behavioral patterns even under heavy structural change. Second—as risky as real-life generalizations made on the basis of a controlled laboratory experiment may be—it seems that while in societies with growing income inequalities constituencies may for some time stick to moderate redistribution typical for earlier periods, in societies where stark inequalities exist it may hardly be expected that income equalization should lead to decrease in actual demand for redistribution.
The research and writing of this paper has been financed by the Polish Ministry of Education and Science as a part of the project 1 H02E 046 28.
References
- [1] A. Seville, J. Tooley, The Debate on Higher Education, The Inst. of Econ. Aff. Studies in Educ. no.5 (1997).
- [2] G. Tullock, Economics of Income Redistribution, Kluwer-Nijhoff, Boston The Hague London (1983).
- [3] R. Eichenberger, F. Oberholzer-Gee, Public Choice 94, 191 (1998).
- [4] E.E. Rutström, M.B. Williams, J. Econ. Beh. & Org. 43, 75 (2000).
- [5] J.-R. Tyran, R. Sausgruber, A Little Fairness May Induce a Lot of Redistribution in Democracy, Univ. St. Gallen Disc. Pap. 30 (2002).
- [6] L. Mittone, Ethical Altrusim and Redistribution: An Experimental Approach, CEEL Working Papers 0301 (2003).
- [7] S.R. Beckman, J.P. Formby, W.J. Smith, http://www.econ.cudenver.edu/beckman/Research/LEAKY2003.pdf, (May 2003)
- [8] H.P. Young, Equity: In Theory and Practice, Princeton Univ. Press (1994).
- [9] S. Czarnik, Stud. Log. Gramm. Rhet. 20, 149 (2004).