Analysis of price diffusion in financial markets using PUCK model
Takayuki Mizunoa, Hideki Takayasub, and Misako TakayasuaaDepartment of Computational Intelligence & Systems Science,
Interdisciplinary Graduate School of Science & Engineering,
Tokyo Institute of Technology, 4259-G3-52 Nagatsuta-cho, Midori-ku, Yokohama 226-8502, Japan
bSony Computer Science Laboratories Inc., 3-14-13 Higashigotanda, Shinagawa-ku, Tokyo 141-0022, Japan
Abstract
Based on the new type of random walk process called the Potentials of
Unbalanced Complex Kinetics (PUCK) model, we theoretically show that the
price diffusion in large scales is amplified times, where
is the coefficient of quadratic term of the potential. In short time
scales the price diffusion depends on the size of the super moving
average. Both numerical simulations and real data analysis of Yen-Dollar
rates are consistent with theoretical analysis.
pacs:
89.65.Gh, 05.40.Fb, 05.45.Tp
††preprint: APS/123-QED
I Introduction
Crashes and uncontrollable hikes can often occur in financial markets. Such
changes of the prices confuse the market and damage the economy because they
start abruptly in many cases. Therefore, techniques to measure the
probabilistic risk of sudden change in the prices have been studied using
tick-by-tick data [1]. Recently, it was empirically found that change of
prices can be approximated by the Fokker-Planck equation and the new type of
random walk in a potential field [2,3,4,5]. The potential field is
approximated by a quadratic function with its center given by the moving
average of past market prices. This random walk model is called the
Potentials of Unbalanced Complex Kinetics (PUCK) model in which the
potential slowly changes in the market [3,4]. In this paper, we focus on the
diffusion properties of this random walk process and calculate the diffusion
coefficient which is helpful for estimating the market risk.
We first review an empirical derivation of the PUCK model. We next show
that the statistically steady condition of price fluctuations depends on the
potential field, and clarify relationships between the price diffusion and
the potential field. We finally demonstrate that the price diffusion in
short time scales depends on the size of moving average, however, large
scale diffusion properties are independent of the moving average. In the
paper, we used all the Bid record (about 20 million ticks) of the exchange
rates for Yen/Dollar that were traded by the term from 1989 to 2002 to find
the firm statistical laws.
II Empirical derivation of PUCK model
Prices in financial markets always have violent fluctuation in a short time
scale. We first eliminate the uncorrelated noise from the
price in order to reduce the statistical error. We next investigate
the dynamics of the price.
We can perform this noise elimination process by introducing an optimum
moving average :
(1)
(2)
where is a price, is an uncorrelated noise and
gives the weight factors where the time is measured by ticks. The weight
factors are calculated by using Yule-Walker equation [6,7,8]. In a case of
Yen-Dollar rate, the weight factor follows an exponential function
whose characteristic decay time is about 30 seconds [6].
We investigate a behavior of the optimum moving average
obtained by eliminating the uncorrelated noise from the price
. We introduce a super moving average defined
by
(3)
In financial markets, it is found that the following relationship between
and holds for a certain range of
[2],
(4)
where the mean of noise is zero. The Eq.(4) means that the price
change can be approximated by a random walk in a quadratic potential field
whose center is given by the moving average of past prices. It is known that
the potential coefficient has a long autocorrelation [3,4].
III Statistically steady condition of price fluctuations in the PUCK
model
We focus on Eq.(4) with the case of a constant because the coefficient
is known to change slowly in financial markets. Eq.(4) is transformed
as follows,
(5)
This is a type of AR process for price difference when is a constant. We
can estimate the conditions of to make the AR process being
statistically steady. Eq.(5) is transformed by the following determinant,
(6)
where
(7)
If , the time
series of is in a weakly steady
state because becomes independent of the initial value of .
This condition is fulfilled when the absolute values of all eigenvalues of
are less than 1. For example, when the time series of is statistically steady if the potential
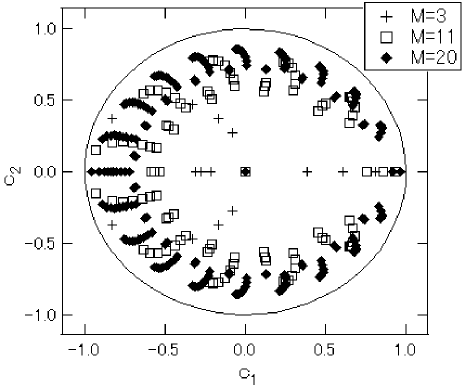
coefficient satisfies . When the eigenvalues
of are given by
(8)
Solving the steady state condition we find that the potential coefficient
should be in the range of for . Numerically
calculating the eigenvalues for as shown in Fig.1 we find
that the time series of is
statistically stationary if the potential coefficient is in the following
range,
(9)
Outside the condition of Eq.(9), the range of price fluctuations increases
indefinitely depending on the time .
IV Diffusion of prices in market potential field
As the potential coefficient has a long autocorrelation, we can
calculate the future price diffusion using Eq.(4). This prediction is
crucial in order to evaluate the risks of market. We clarify statistical
laws of price diffusion described by Eq.(4) using both simulations and
theoretical analysis.
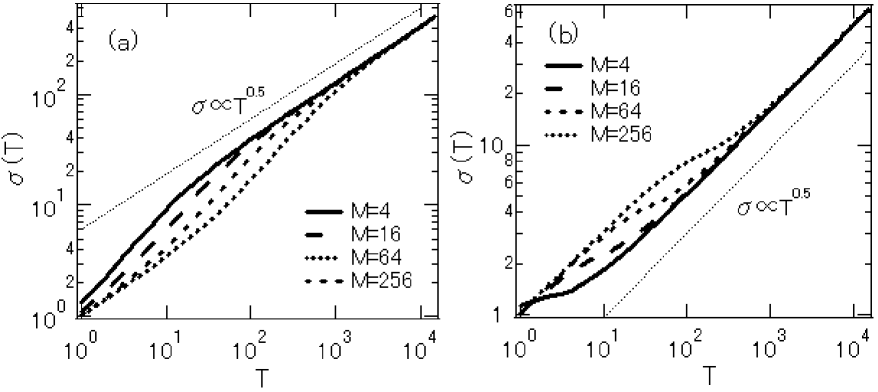
By simulating Eq.(4) for the case of is a constant, we investigate
the standard deviation on a time scale defined by
(10)
In Fig.2 we plot for , , , when and . Here, is the Gaussian random number whose standard
deviation is 1. The time scale where the Hurst exponent converges 0.5
depends on . For example, the time scale is about when ,
while the time scale is around when
We can estimate the standard deviation in the long time
scale limit. The variance of change of optimum moving average price
is given by
(11)
By introducing a rough approximation
(12)
we have the following simple formulation after some calculation,
(13)
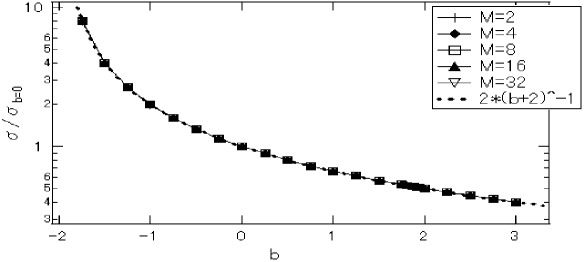
where , and is the standard deviation when . In this long time scales,
the standard deviation of the price is amplified times by
the potential field. In Fig.3 we show relationships between the potential
coefficient and the ratio of standard deviation when by
simulating Eq.(4) for , 4, 8, 16, 32. We can confirm that the price
diffusion of numerical simulations follows Eq.(13) independent of in the
long time scale. From Eq.(13) we can theoretically find that in the long
time scales the price diffusion is independent of , independent of ,
.
V Diffusion of Yen-Dollar rates
From dataset of real market prices, we can estimate the value of , and
presume the best value of by comparing the price diffusion of numerical
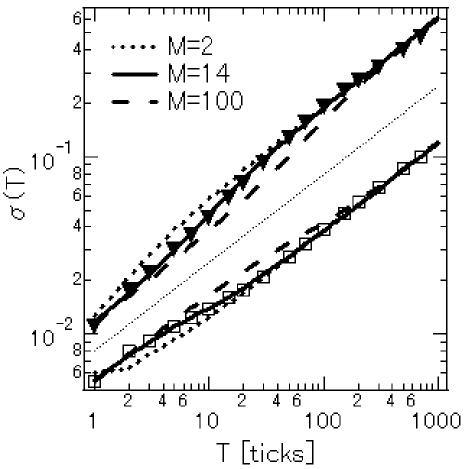
simulations to real price diffusion. Fig.4 shows the diffusions of
Yen-Dollar rates from 3:35 to 8:35 and from 9:25 to 23:25 in 11/9/2001, the
day of terrorism. The rates were stable till 8:35 and it became quite
unstable after 9:25. The rates until 8:35 follow a slow diffusion in short
time scales, namely, the market has an attractive potential . As
shown in Fig.4, we can recreate the rate diffusion in all time scales by
simulating Eq.(4) with and ticks. We next focus on the
unstable rates after 9:25 that follow a fast diffusion in short time scales.
When and ticks, the price diffusion of numerical
simulation is also consistent with the rate diffusion. The price diffusion
depends on in the short time scales, although the price diffusion is
independents of in the long time scales. Therefore, if ticks,
there are gaps between the price diffusion of numerical simulations and the
rate diffusion in the short time scales as shown in Fig.4. In other real
markets, we can also estimate the best value of from such
characteristics of price diffusion.
VI Discussion
We can approximate the change of market prices by the random walk in a
potential field. The potential field is well approximated by a quadratic
function with its center given by the moving average of past prices. The
random walk process is called the PUCK model. By analyzing the model, we
clarified that the statistically steady condition of price fluctuations
depends on the potential coefficient , and we also theoretically proved
that the price diffusion in the long time scales is amplified times, independent of the size of super moving average. In short
time scales the price diffusion depends on . We can estimate the best
value of in real financial markets by observing this dependence. We
recreated the diffusion of Yen-Dollar rates in all time scales by the PUCK
model. The potential coefficient is helpful to measure the probabilistic
risk of sudden change in the prices. We may be able to build better
financial options that offset the risk by applying the price diffusion of
the PUCK model.
Acknowledgements.
This work is partly supported by Research Fellowships of the Japan Society
for the Promotion of Science for Young Scientists (T.M.). The authors
appreciate H. Moriya of Oxford Financial Education Co Ltd. for providing the
tick data.
References
(1)[1] J. P. Bouchaud and M. Potters, Theory of financial risks, Cambridge
university press, 2000.
(2)[2] M. Takayasu,T. Mizuno, T. Ohnishi, and H. Takayasu, Temporal
Characteristics of Moving Average of Foreign Exchange Markets, in Practical
Fruits of Econophysics (Springer Verlag, Tokyo. 2006) 29-32.
(3)[3] M. Takayasu, T. Mizuno and H. Takayasu, Potentials of Unbalanced Complex
Kinetics Observed in Market Time Series, physics/0509020.
(4)[4] M. Takayasu, T. Mizuno and H. Takayasu, Potential Force Observed in
Market Dynamics, Physica A, to appear.
(5)[5] R. Friedrich, How to Quantify Deterministic and Random Influences on the
Statistics of the Foreign Exchange Market, PRL 84, 5224-5227, 2000.
(6)[6] T. Ohnishi, T. Mizuno, K. Aihara, M. Takayasu, H. Takayasu, Statistical
properties of the moving average price in dollar-yen exchange rates, Physica
A 344, pp.207-210, 2004.
(7)[7] T. Mizuno, M. Takayasu, and H. Takayasu, Modeling a foreign exchange
rate using moving average of Yen-Dollar market data, in Practical Fruits of
Econophysics (Springer Verlag, Tokyo. 2006) 57-61.
(8)[8] T. Ohnishi, T. Mizuno, K. Aihara, M. Takayasu, H. Takayasu, Systematic
tuning of optimal weighted-moving-average of yen-dollar market data, in
Practical Fruits of Econophysics (Springer Verlag, Tokyo. 2006) 62-66.
Figure 1: The eigenvalues of matrix . The and are
real and imaginary parts of . The pluses are for
when . The squares show for when . The diamonds express for when .
The circle indicates .
Figure 2: Standard deviation of price changes in the time scale
. The heavy lines show price diffusions of numerical simulation for (top), 16(second), 64(third), 256(bottom). Here, in (a)
and in (b). The standard deviation of is 1. The guideline
indicates .
Figure 3: Relationship between potential coefficient and standard deviation
ratio / when
the time scale . Theory (dashed line) and numerical simulations
for (plus), 4(diamond), 8(square), 16(black triangle), 32(white
triangle).[4]
Figure 4: Diffusion of Yen-Dollar rates. The squares and triangles show the
diffusion from 3:35 to 8:35 and from 9:25 to 23:25 in 11/9/2001. The top 3
lines are the numerical simulation of Eq.(4) for , 14, 100 ticks when
. The standard deviation of is 0.0115 yen/dollar. The
bottom 3 lines show the numerical simulation for , 14, 100 ticks when
. The standard deviation of is 0.0054 yen/dollar. The straight
line expresses the normal diffusion with the slope 0.5.