Diffuse reflection of a Bose-Einstein condensate from a rough evanescent wave mirror
Abstract
We present experimental results showing the diffuse reflection of a Bose-Einstein condensate from a rough mirror, consisting of a dielectric substrate supporting a blue-detuned evanescent wave. The scattering is anisotropic, more pronounced in the direction of the surface propagation of the evanescent wave. These results agree very well with theoretical predictions.
pacs:
03.75.Nt, 32.80.Lg, 34.50.-s1 Introduction
The study of the interactions between ultra cold atoms and surfaces is of major interest in the context of Bose-Einstein condensation on microchips [1, 2]. One motivation is to understand the limitations on integrated matter wave devices due to imperfect surface fabrication or finite temperature. For example, it has been shown that the quality of the wires used in microfabricated chips is directly linked to the fragmentation effects observed in Bose-Einstein condensates (BECs) trapped near a metallic wire [3]. Moreover, the thermal fluctuations of the current in a metallic surface induce spin flip losses in an atomic cloud when the distance to the surface is smaller than m typically [4].
Dielectric surfaces and evanescent waves have also been explored for producing strong confinement. They have the advantage of a strong suppression of the spin flip loss mechanism compared to metallic structures [5]. With such a system, one can realize mirrors [6], diffraction gratings [7], 2D traps [8] or waveguides [9]. Experiments involving ultra cold atoms from a BEC at the vicinity of a dielectric surface have recently made significant progress, leading for instance to the realization of a two dimensional BEC [10], to the study of atom-surface reflection in the quantum regime [11], and to sensitive measurements of adsorbate-induced surface polarization [12] and of the Van der Waals/Casimir-Polder surface interaction [13].
In this paper, we present experimental results and a related theoretical analysis of Bose condensed Rubidium atoms interacting with the light field of an evanescent wave above a dielectric slab. The evanescent wave is detuned to the blue of an atomic transition line and provides a mirror for a BEC that is released from a trap and falls freely in the gravity field of the earth. After the bounce off the mirror, we observe a strong scattering of the atomic cloud (diffuse mirror reflection) that is due to the roughness of the slab surface where the evanescent wave is formed [14]. In our case, the phase front of the reflected matter waves is significantly distorted because the effective corrugation of the mirror is comparable to where is the incident de Broglie wavelength and the angle of incidence. This is similar to early experiments with evanescent waves [14] and with magnetic mirrors [15]. We mention that later experiments achived a significantly reduced diffuse reflection (Arnold et al[16]) and were even able to distinguish a specularly reflected matter wave (Savalli et al[17]). The key result of our experiment is that we can quantitively confirm the theoretical analysis developed by Henkel et al[18], combining independent measurements of the dielectric surface and the bouncing atoms.
2 Setup
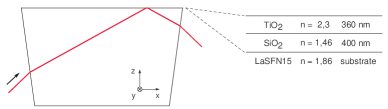
The evanescent wave is produced by total internal reflection of a Gaussian laser beam at the surface of a dielectric prism. As shown in Fig.1, the surface of the prism is coated by two dielectric layers, a TiO2 layer on top of a SiO2 spacer layer. This coating forms an optical waveguide that resonantly enhances the evanescent field above the top layer [20]; we have designed this configuration for the study of two-dimensional atom traps [21]. The incident angle of the laser beam is fixed by the resonance condition for a waveguide mode; for the transverse electric (or s) polarization we use, the incident angle is (at the TiO2/vacuum interface, index ). The resulting exponential decay length of the light field is nm, and is the light intensity.
The mirror light is produced by a laser diode of power 40 mW detuned 1.5 GHz above the atomic D2 line ( or ). The Gaussian beam is elliptical and produces on the surface a spot with waist diameters of m along and m along (see coordinate axes in Fig.1). A measurement of the reflection threshold for the atom beam, taking into account the van der Waals attraction toward the surface (Landragin et al. in Ref.[6]), gives access to the light intensity at the surface in the spot center: . This value is lower than expected from the design of the dielectric coating; we attribute this to the losses due to the roughness of the deposited TiO2 layer (see Figure 5 below and the discussion there).
3 Atom bounce
3.1 Data
The experiment proceeds as follows: approximately atoms are confined in the hyperfine ground state in a Ioffe Pritchard (IP) type magnetic trap, 3.6 mm above the evanescent mirror [21]. The magnetic trap is cigar shaped, being its long axis. Oscillation frequencies are, respectively, and in the radial directions ( and ). The atoms are evaporatively cooled to below the condensation threshold and about atoms are released at by switching off the magnetic trapping fields. These atoms reach the mirror after free fall at ms and bounce on it with a velocity (normal incidence , de Broglie wavelength ). Around the bouncing time , the mirror laser is switched on for ms. Limiting this time window prevents near-resonant photon scattering during free fall or after reflection.
The atoms are detected by absorption imaging either before or after reflection. During free fall, the cloud expands along the radial directions because potential and interaction energy is released, but its width along remains nearly constant. The analysis of pictures taken before reflection gives access to the following parameters: fraction of condensed atoms , kinetic temperature of thermal cloud nK, initial Thomas-Fermi size along of the condensed fraction m and Thomas-Fermi velocity width along : . The condensate velocity width along is very small, thus non directly measurable. However, it can be inferred from the knowledge of and the oscillation frequencies in the magnetic trap, using the solution for an expanding BEC [22]; we get . The observation of the center of mass motion during free fall permits us to calibrate the pixel size knowing gravity’s acceleration and to infer the initial position and velocity of the cloud. The magnetic field switching process communicates a small acceleration to the atoms along , resulting in a horizontal velocity (see Figure 2).
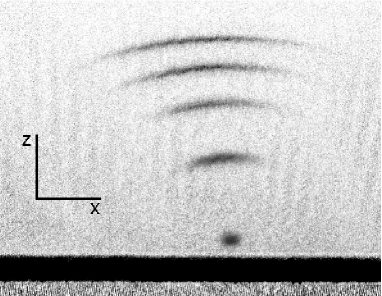
After reflection, the absorption images change dramatically (figure 2). The atoms occupy the surface of a scattering sphere, hence an elastic, but strongly diffuse scattering occurs. For , the cloud width along increases from its initial value due to an additional velocity spread . The velocity Gaussian radius at deduced from the pictures is . Taking into account the initial velocity width before reflection, the spread due to diffuse reflection is , that is where is the recoil velocity for Rb. This corresponds to an angular (rms) spread .
The effect of diffuse reflection along is more subtle to analyze, as this axis is aligned with the direction of observation. However, it is possible to extract information about from the picture. If for instance the scattering were totally isotropic, with , the atomic cloud should extend asymmetrically towards at a given position , as the projection of a spherical shell onto a plane extends towards the inner part of the circle (see figure 4). If on the contrary the scattering would take place only along , the cloud width along at a given position should be very small, with a symmetric shape.
3.2 Simulation
To get some insight into what happens along , we performed a numerical simulation of the atomic reflection. The simulation calculates individual classical atomic trajectories. The initial positions and velocities are chosen to mimic the experimentally measured parameters: 40% of the atoms are “condensed” and are described by the initial 3D Thomas-Fermi velocity and position distribution. (We neglect the position spread along and because its contribution to the cloud size after a few ms of time of flight is very small.) The remaining 60% of the atoms are distributed according to gaussian profiles for velocity and position, with widths inferred from the knowledge of temperature and trap parameters. Position and velocity of the cloud centre are fixed to the experimental values as well.
The mirror is modelled as an instantaneous diffuse reflector. This assumption is reasonable as the typical time spent in the evanescent wave is small, s. After reflection, the atomic velocity is modified to describe both specular reflection (inversion of vertical velocity) and scattering. A random horizontal velocity is added to the reflected velocity with a gaussian distribution. We take a radius , as measured experimentally, and run simulations with varying . The component of the velocity is adjusted in order to preserve kinetic energy (the scattering process is elastic, total energy is conserved). The simulation also takes into account spontaneous emission. For our parameters, the atom spontaneously emits on average 0.13 photons per bounce [23]. We randomly draw the number of photons from a Poisson distribution and add a recoil of in a random direction in velocity space for each emission event. After calculation of all atomic trajectories, the atomic density profile is integrated along as in the experimental pictures. We finally apply a Gaussian blur filter (width m along and m along ) to mimic the finite resolution of the experimental imaging system that we calibrated independently.
3.3 Anisotropic scattering
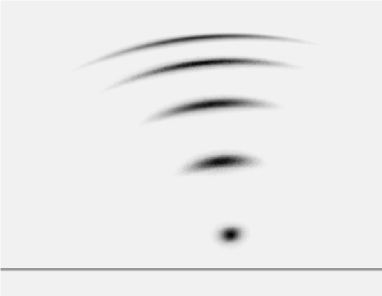
The qualitative agreement between the experimental and simulated pictures is very good as can be seen on figure 3. To be more quantitative for the possible values of the velocity spread , we analyze the central part of the cloud. For each time of flight, a region of size 0.8 mm 1.5 mm along and respectively, centred on the maximum density of the cloud and identical for experimental and simulated pictures, is isolated and an integration of the signal is performed along . We are left with a cut of the cloud along , averaged over 0.8 mm along . The experimental profile is compared to the simulated one, for different choices of after the bounce. Results are shown on figure 4 for a time of flight 59 ms.
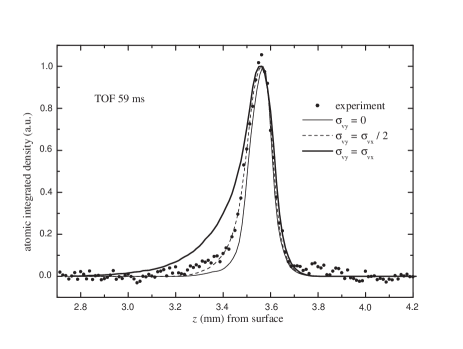
The experimental data clearly exclude an isotropic diffuse reflection (figure 4, bold line). They also are different from the pure one dimensional scattering case (thin line): what fits best of all is a model intermediate between these two extremes, i.e. the scattering is only half as strong along compared to . The atom mirror thus has an angular reflection characteristic that is elongated in the direction parallel to the (real part of the) wave vector of the evanescent wave. Spontaneous emission plays only a minor role for our parameters, but we found that the agreement with the experimental density profiles is improved by taking it into account, in particular on the lower left wing of the peak.
3.4 Mirror corrugation
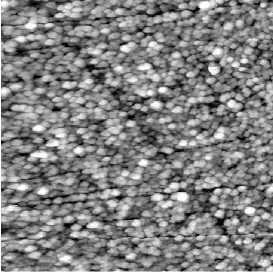
For a theoretical prediction of the anisotropic mirror reflection, we use the theory of Ref.[18] where the diffuse scattering is attributed to the interference between the evanescent wave and light diffusely scattered from the rough glass surface. Within this theory, one can compute the width of the momentum distribution of the reflected atoms provided the power spectrum of the surface roughness is known. This power spectrum is a quantitative measure of the surface quality and has been measured with an atomic force microscope (AFM). A typical m2 portion of the surface of the coated prism is shown in figure 5. One sees the top face of pillar-like structures which are typical for epitaxially grown TiO2 on a substrate. The AFM data yield a surface roughness nm (the rms spread of the measured surface profile). A Fourier transform of the AFM image gives access to the power spectrum . (We use capitalized boldface letters for two-dimensional vectors in the mirror plane.) It is found to be isotropic (a function of only) and well fitted in the wave vector range by a power law with a low-frequency cut-off (see figure 6)
| (1) |
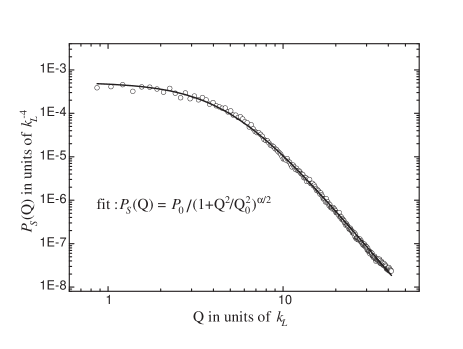
The fit gives access to the parameters , and . In terms of this power spectrum, the rms surface roughness is given by
| (2) |
and the fitted parameters yield nm, in excellent agreement with the value directly deduced from the rms spread of the AFM data.
3.5 Diffuse reflection theory and comparison to the data
We now show that the diffuse reflection we observe can be understood within the theory of Ref.[18]. We note first that the cloud is so dilute at the bounce that a single-atom picture is sufficient to capture the physics [24]. For a fixed incident momentum near normal incidence, the reflected wave function can be written in the form of a plane wave with a randomly modulated phase front:
| (3) |
where is a normalization factor and . (The dependence on the angle of incidence is actually negligible for our parameters [18].) The phase depends on the ‘impact position’ on the mirror, i.e., the projection of r onto the mirror plane. We perform an ensemble average over the realizations of the rough surface and compute the atomic momentum distribution from the (spatial) Fourier transform of the ‘atomic coherence function’ (Sec. 6 of Ref.[18])
(We take , assuming the roughness to be statistically homogeneous.) The variance of the phase shift can be found from the following formula (Eqs.(6.15) and (5.16) of Ref.[18])
| (5) |
where is the “atomic response function” given in Eq.(5.15) of Ref.[18]. For the parameters of our experiment, we find that the phase shift has a variance large compared to unity. In this regime, Ref.[18] has shown that the reflected atomic velocity distribution approaches a Gaussian shape whose width along the -direction, for example, is given by
| (6) |
This expression gives the additional broadening of the incident velocity distribution due to the diffuse mirror reflection. We perform the integration of Eq.(6) numerically, with the roughness power spectrum determined previously from the AFM images (Eq.(1)). For simplicity, we calculate the response function using scalar light scattering from the topmost interface only, ignoring the actual layered structure. We believe that this approximation is sufficient, at least for describing the scattering in the -direction: as shown in Ref [18], the atom does not change its magnetic sublevel if it scatters in this direction and if the evanescent wave is linearly polarized. These conditions are met here so that both atom and light can be described by scalar wave fields.
Within the theoretical model outlined above, the velocity spread along the propagation direction of the evanescent wave is found to be . This value is in very good agreement with the experimental value . This is a very satisfying result because the theory only contains, within the approximations we made, parameters that are based on independent measurements. We believe that this is the first quantitative demonstration of evanescent wave scattering in the diffuse regime.
3.6 Discussion of the anisotropy
We also compute the anisotropy of the reflected atoms and find a ratio , in good agreement with the value () extracted from the experimental data. As discussed in Ref.[18], this anisotropy arises from the fact that diffuse reflection occurs predominantly by Bragg transitions where a photon is absorbed from the evanescent wave (with wave vector ) and another photon is emitted into a diffusely scattered mode that emerges at grazing incidence into the vacuum half-space (or the inverse process). If these scattered modes are distributed isotropically in the mirror plane on a circle of radius , the ratio of the rms spreads would be . Taking , which corresponds to scattered modes emerging at grazing incidence, we again find an anisotropy ratio of . This agreement is not very surprising since the rough surface has a power spectrum much broader than the photon wavenumber (Fig.6). Within this simple calculation, however, we can also get a quick estimate of the impact of the dielectric coating. The choice corresponds to resonant scattering into waveguide modes in the TiO2 layer and leads to a ratio which cannot be excluded experimentally.
4 Conclusion
In conclusion, we have observed the diffuse reflection of an ultracold atomic beam from an evanescent wave. The wave propagates on the rough surface of a dielectric prism, and light scattering leads to an atom mirror showing a significantly nonspecular reflection. The angular broadening of the reflected atoms, as well as their anisotropic angular distribution in the mirror plane, are in good agreement with a theory developed by Henkel et al. [18]. It is remarkable that this agreement does not imply any free parameters since we independently measured the spectrum of the surface roughness with an AFM. In our experiment, using a BEC has mainly practical advantages. Indeed, as we mentioned above, everything can be understood within a single-atom picture, and after diffuse scattering, spatial coherence is seriously reduced, as is discussed in Ref.[18] and investigated in Ref.[25]. Nevertheless, the BEC provides crucial advantages because we achieve a very clean situation. Apart from a very low velocity spread , a BEC has a negligible size when impacting the evanescent wave surface. This removes the need to take into account the mirror curvature due to the gaussian spot profile; the contribution of the initial size to the cloud width after reflection is negligible; and the losses given the finite size of the mirror (the waist of the reflected laser beam) are minimal. In fact, with a freely falling, ultracold, but thermal gas, the finite mirror size would lead to strongly reduced signal.
References
- [1] Hänsel W, Hommelhoff P, Hänsch T W and Reichel J 2001 Nature 413 498–501
- [2] Folman R, Krüger P, Schmiedmayer J, Denschlag J H and Henkel C 2002 Adv. At. Mol. Opt. Phys. 48 263–356
- [3] Fortágh J, Ott H, Kraft S and Zimmermann C 2002 Phys. Rev. A 66 041604(R) Leanhardt A E, Shin Y, Chikkatur A P, Kielpinski D, Ketterle W and Pritchard D E 2003 Phys. Rev. Lett. 90 100404 Schumm T, Estève J, Figl C, Trebbia J B, Aussibal C, Nguyen H, Mailly D, Bouchoule I, Westbrook C and Aspect A 2005 Eur. Phys. J. D 32 171–80
- [4] Jones M P A, Vale C J, Sahagun D, Hall B V and Hinds E A 2003 Phys. Rev. Lett. 91 080401 Harber D M, McGuirk J M, Obrecht J M and Cornell E A 2003 J. Low Temp. Phys. 133 229–38 Rekdal P K, Scheel S, Knight P L and Hinds E A 2004 Phys. Rev. A 70 013811
- [5] Henkel C and Wilkens M 1999 Europhys. Lett. 47 414–20 Henkel C, Pötting S and Wilkens M 1999 Appl. Phys. B 69 379–87
- [6] Balykin V I, Letokhov V S, Ovchinnikov Y B and Sidorov A I 1988 Phys. Rev. Lett. 60 2137–40 Kasevich M A, Weiss D S and Chu S 1990 Opt. Lett. 15 607–609 Aminoff C G, Steane A M, Bouyer P, Desbiolles P, Dalibard J and Cohen-Tannoudji C 1993 Phys. Rev. Lett. 71 3083–6 Landragin A, Courtois J Y, Labeyrie G, Vansteenkiste N, Westbrook C I and Aspect A 1996 Phys. Rev. Lett. 77 1464–7
- [7] Christ M, Scholz A, Schiffer M, Deutschmann R and Ertmer W 1994 Opt. Commun. 107 211–7 Brouri R, Asimov R, Gorlicki M, Feron S, Reinhardt J, Lorent V and Haberland H 1996 Opt. Commun. 124 448–51 Szriftgiser P, Guéry-Odelin D, Arndt M and Dalibard J 1996 Phys. Rev. Lett. 77 4–7 Cognet L, Savalli V, Horvath G Z K, Holleville D, Marani R, Westbrook N, Westbrook C I and Aspect A 1998 Phys. Rev. Lett. 81 5044–5047
- [8] Ovchinnikov Y B, Shul’ga S V and Balykin V I 1991 J. Phys. B: Atom. Mol. Opt. Phys. 24 3173–8 Gauck H, Hartl M, Schneble D, Schnitzler H, Pfau T and Mlynek J 1998 Phys. Rev. Lett. 81 5298–301 Hammes M, Rychtarik D, Engeser B, Nägerl H C and Grimm R 2003 Phys. Rev. Lett. 90 173001
- [9] Dekker N H, Lee C S, Lorent V, Thywissen J H, Smith S P, Drndić M, Westervelt R M and Prentiss M 2000 Phys. Rev. Lett. 84 1124–7
- [10] Rychtarik D, Engeser B, Nägerl H C and Grimm R 2004 Phys. Rev. Lett. 92 173003
- [11] Pasquini T A, Shin Y I, Sanner C, Saba M, Schirotzek A, Pritchard D E and Ketterle W 2004 Phys. Rev. Lett. 93 223201 Pasquini T A, Saba M, Jo G, Shin Y, Ketterle K, Pritchard D E, Savas T A and Mulders N 2006, “Low velocity quantum reflection of Bose-Einstein condensates” preprint cond-mat/0603463.
- [12] McGuirk J M, Harber D M, Obrecht J M and Cornell E A 2004 Phys. Rev. A 69 062905
- [13] Lin Y J, Teper I, Chin C and Vuletić V 2004 Phys. Rev. Lett. 92 050404 Harber D M, Obrecht J M, McGuirk J M and Cornell E A 2005 Phys. Rev. A 72 033610 Obrecht J M, Wild R J, Antezza M, Pitaevskii L P, Stringari S and Cornell E A 2006, “Measurement of the Temperature Dependence of the Casimir-Polder Force” preprint physics/0608074.
- [14] Landragin A, Labeyrie G, Henkel C, Kaiser R, Vansteenkiste N, Westbrook C I and Aspect A 1996 Opt. Lett. 21 1581–3 In these experiments, some indications for anisotropic scattering after reflection of thermal atoms on an evanescent wave mirror were observed (C. Westbrook and A. Landragin, private communication).
- [15] Hinds E A and Hughes I G 1999, J. Phys. D: Appl. Phys. 32 R119–46
- [16] Arnold A S, MacCormick C and Boshier M G 2002, Phys. Rev. A 65 031601
- [17] Savalli V, Stevens D, Estève J, Featonby P D, Josse V, Westbrook N, Westbrook C I and Aspect A 2002 Phys. Rev. Lett. 88 250404
- [18] Henkel C, Mølmer K, Kaiser R, Vansteenkiste N, Westbrook C I and Aspect A 1997 Phys. Rev. A 55 1160–78
- [19] Perrin H, Colombe Y, Mercier B, Lorent V and Henkel C 2005 J. Phys.: Conf. Ser. 19 151–7; doi:10.1088/1742-6596/19/1/025, preprint quant-ph/0509200
- [20] Kaiser R, Lévy Y, Vansteenkiste N, Aspect A, Seifert W, Leipold D and Mlynek J 1994 Opt. Commun. 104 234
- [21] Colombe Y, Kadio D, Olshanii M, Mercier B, Lorent V and Perrin H 2003 J. Opt. B: Quantum Semiclass. Opt. 5 S155–63
- [22] Castin Y and Dum R 1996 Phys. Rev. Lett. 77 5315–9 Kagan Y, Surkov E L and Shlyapnikov G V 1996 Phys. Rev. A 54 R1753–6
- [23] This value is deduced from an integration of the number of scattered photons along the mean classical atomic trajectory, calculated from the known evanescent wave parameters. We neglect the variation of the spontaneous emission rate at the vicinity of the surface. This assumption is reasonable as the classical turning point is rather far from the surface (). See Henkel C and Courtois J-Y 1998 Eur. Phys. J. D 3 129–153.
- [24] Bongs K, Burger S, Birkl G, Sengstock K, Ertmer W, Rzazewski K, Sanpera A, and Lewenstein M 1999 Phys. Rev. Lett. 83 3577; Busch T, private communication
- [25] Estève J, Stevens D, Aussibal C, Westbrook N, Aspect A and Westbrook C I 2004 Eur. Phys. J. D 31 487–91