Effect of a thin optical Kerr medium on a Laguerre-Gaussian beam
Abstract
Using a generalized Gaussian beam decomposition method we determine the propagation of a Laguerre-Gaussian (LG) beam that has passed through a thin nonlinear optical Kerr medium. The orbital angular momentum per photon of the beam is found to be conserved while the component beams change. As an illustration of applications, we propose and demonstrate a z-scan experiment using an beam and a dye-doped polymer film.
Laguerre-Gaussian (LG) modes were discovered soon after the invention of the laserKogelnik:1966 . A LG beam with angular mode number and transverse radial mode number can be written as:
| (1) |
where is the beam waist radius, is the Rayleigh length, is the beam radius at z, and is an associated Laguerre polynomial. For a given LG beam mode, (or ) alone is sufficient to characterize the relative amplitude and phase of the electric field of the beam. When multiple beams are involved, it is often necessary to specify the waist locations of each beam. For convenience we use the notation to describe a LG beam unambiguously, where is the waist location on the z axis and C is a complex constant that gives the amplitude and the initial phase.
The fundamental Gaussian beam has been the most commonly studied LG mode in both theory and experiment. However recently higher order LG beams, especially those with higher angular mode number , are attracting more attention. When , the LG beam possesses well defined orbital angular momentum of per photonAllen:1992 , zero on-axis intensity due to the phase singularity, and helical phase fronts. These properties make high-order LG beams useful in many applications such as optical manipulation of microscopic particlesPaterson:2001 , quantum information processingMair:2001 ; Barreiro:2003 , orbital angular momentum sortingWei:2003 and imagingTorner:2005 , nonlinear wave mixingCourtial:1997 , optical vorticesRozas:1997 and vortex solitonsKivshar:1998 , scatteringSchwartz:2005 , and interferenceSztul:2006 . In the present work, we develop a theory for the propagation of an LG beam after it passes through a thin nonlinear optical Kerr medium. The results of our calculation can be used for z-scan measurements using beam and optical limiting geometries.
The index of refraction of an optical Kerr medium depends on the intensity of the incident beam and the nonlinear refractive index ,
| (2) |
where is the linear refractive index. Consider a nonlinear Kerr-type sample that is placed at the position in a LG beam . Assume the sample is “thin” such that the change of the diameter of the beam due to either linear diffraction or nonlinear refraction can be neglected within the sample. Such two requirements are satisfied if and , respectively, where d is the sample thickness, and is the nonlinear phase distortionSheik:1990 . The electric field at the exit surface of the sample can be expressed asSheik:1989 ; Sheik:1990
| (3) |
where is the linear absorption coefficient, and
| (4) |
where
| (5) |
is a constant proportional to the maximum nonlinear phase change in the sample at the focus . When the incident beam is a beam, .
We generalize the so-called “Gaussian decomposition” method Weaire:1979 to analyze the propagation of a beam that traverses a nonlinear sample. The exponential in Eq. (3) can be expanded in a Taylor series as
| (6) |
The complex electric field of the incident beam after it passes through the sample can be written as a summation of the electric fields of a series of LG beams of different modes as
| (7) |
where and are the waist location and the Rayleigh length, respectively, of the corresponding beam mode and is the amplitude and phase of the component beam. These parameters are determined by letting in Eq. (7) and making use of Eqs. (3) and (6).
and where Z is defined as , and
and and are determined through
where x is an arbitrary real variable. Our theoretical results are embodied in Eq. (7).
It is worth noting that all the component LG beams have the same angular mode number as that of the incident beam, which reflects the conservation of the photon’s orbital angular momentum. Therefore the effect of the Kerr material on the incident LG beam is to generate LG beams of different radial modes. These results are important in applications that leverage mode sensitivity.
The expression in Eq. (7) is especially useful when the nonlinear phase distortion is small enough so that only a few terms in the summation are needed to make a good approximation. To illustrate, assume that the incident beam is a beam and the maximum nonlinear phase distortion in the sample at position Z is
| (8) |
It is sufficient to keep the first two terms in the Eq. (6) and neglect the higher order terms, yielding
| (9) |
This outgoing electric field includes the generated and beam.
It is interesting to calculate the on-axis normalized Z-scan transmittance Sheik:1989 ; Sheik:1990
| (10) |
which characterizes the on axis light power transmitted though a small aperture placed in the far field. Applying Eq. (9) we find
| (11) |
The last term can be dropped if .
The same procedures can be applied to LG beams of other modes. As a special case, when the incident beam is , we get the same result as in Ref. Sheik:1990, , i.e.
| (12) |
when .
Result (12) was first reported as the theory supporting the Z-scan technique, a highly sensitive technique to measure the optical nonlinearities using a beamSheik:1990 . In a Z-scan, one measures the trace of the normalized transmittance as a function of the nonlinear sample position z, from which is determined by fitting Eq. (12) or more practically, through the relation (derived from Eq. (12)), where is the difference between the peak (maximum) and the valley (minimum) of the trace (e.g., the dotted curve in Figure 2). then gives through Eq. (5).
Similarly, Eq. (11) shows the relationship between and , suggesting that it is possible to do a Z-scan experiment using the beam to measure the nonlinearity of a thin samples. We demonstrate this on a disperse-red-1 doped poly(methyl methacrylate) (DR1/PMMA) thin sampleZhang:2002 . The experiment also tests the validity of our theory.
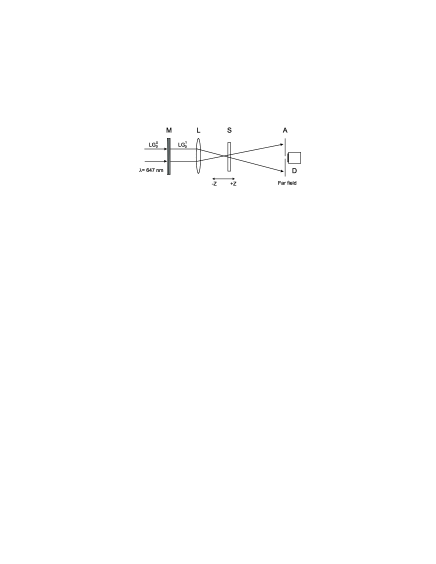
Figure 1 shows a schematic diagram of the setup. A beam of 647 nm wavelength from a krypton laser is converted into a beam by a computer generated binary phase mask Heckenberg:2002 . The beam is then focused by a lens to the desired Rayleigh length (2.4 cm). The power of the incident beam is 65 W. A 1.4 mm-thick 2% w/w DR1/PMMA sample is placed near the beam waist. The nonlinearity of DR1/PMMA is due to photo-induced trans-cis-trans isomerization of DR1 molecules followed by reorientation in the direction perpendicular to the polarization of the incident laser beam. It can be treated as an optical Kerr effect when the intensity is low and the exposure time is short enough to avoid saturation of the refractive index change. We use a shutter (not shown) to control the total exposure time (3 seconds). A small aperture is placed on axis of the beam in the far field. The power passed through the aperture is recorded by a detector as a function of sample position as well as the exposure time . The normalized transmittance is obtained by dividing the power recorded by the detector at time s by that at time s. A fresh sample spot is used for each exposure to avoid history effects. Nonlinear absorption is determined to be negligible with an open aperture Z-scan. The “thin” sample approximation is satisfied under the above experimental conditions.
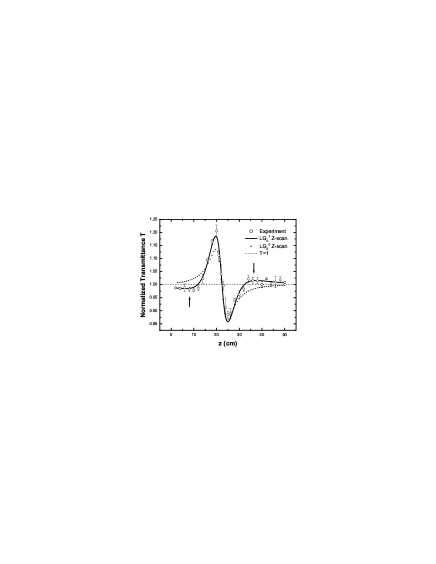
Figure 2 shows the results. The circles are the experimental data. The solid curve is the best fit using Eq. (11) with as the parameter. The dotted curve is the best fit using Eq. (12), included as a Z-scan trace for comparison. The dashed line is to indicate the line where .
The shape of the Z-scan curve using the beam differs from the traditional one using the beam in that the former has an extra peak and valley (indicated in the figure by the arrows). The extra valley brings down the tail of the major peak below and the extra peak brings up the tail of the major valley beyond . The experimental data clearly shows these features and fits our theory well. On the other hand, the tails in the Z-scan trace never cross the line and do not fit the data. Thus our theory provides the only good theory, supporting its validity. The appearance of the additional structure of our theory is a consequence of the component beam in Eq. (9). Although the amplitude of these features is much smaller than the major ones, it has significance in other applications such as optical limiting, which will be discussed in a future publication.
Just as the traditional Z-scan, the Z-scan provides sensitive measurements of optical nonlinearities. The value of is fitted to be (or ) using the data in Figure 2. With this we calculate cm2/W, which is consistent with the value measured using the traditional Z-scan. Besides using the fitting method, we can also estimate using the difference between the major peak and valley, . An important difference between the two Z-scan measurements is that in the Z-scan experiment the detector is placed at the beam center where the intensity is the weakest due to the screw phase dislocation while in the Z-scan experiment the center intensity is the strongest. As a result the former shows a much bigger deviation from the normal value if any phase or intensity distortion that destroys the symmetry of the beam profile is present. This suggests that the Z-scan experiment is more sensitive to changes of the of the sample.
In conclusion, we have calculated the propagation of a Laguerre-Gaussian beam after it passes through a thin nonlinear optical Kerr medium. Applications, such as the Z-scan experiment using a beam described here, has advantages over traditional measurements using a beam. These results can be applied to many other thin film applications such as optical limiting and nonlinear beam interactions.
We acknowledge NSF (ECS-0354736), the Summer Doctoral Fellows Program provided by Washington State University, and Wright Patterson Air Force Base for generously supporting this work.
References
- (1) H. Kogelnik and T. Li, Appl. Opt. 5, 1550 (1966).
- (2) L. Allen, M. Beijersbergen, R. Spreeuw, and J. Woerdman, Phys. Rev. A 45, 8185 (1992).
- (3) L. Paterson, M. P. MacDonald, J. Arlt, W. Sibbett, P. E. Bryant, and K. Dholakia, Science 292, 912 (2001).
- (4) A. Mair, A. Vaziri, G. Weihs, and A. Zeilinger, Nature 412, 313 (2001).
- (5) S. Barreiro and J. W. R. Tabosa, Phys. Rev. Lett. 90, 133001 (2003).
- (6) H. Wei, X. Xue, J. Leach, M. J. Padgett, S. M. Barnett, S. Franke-Arnold, E. Yao, and J. Courtial, Opt. Commun. 223, 117 (2003).
- (7) L. Torner, J. P. Torres, and S. Carrasco, Opt. Express 13, 873 (2005).
- (8) J. Courtial, K. Dholakia, L. Allen, and M. J. Padgett, Phys. Rev. A 56, 4193 (1997).
- (9) D. Rozas, C. T. Law, and G. A. J. Swartzlander, J. Opt. Soc. Am. B 14, 3054 (1997).
- (10) Y. S. Kivshar, J. Christou, V. Tikhonenko, B. Luther-Davies, and L. M, Pismen, Opt. Commun, 152, 198 (1998).
- (11) C. Schwartz and A. Dogariu, Opt. Lett. 30, 1431 (2005).
- (12) H. Sztul and R. Alfano, Opt. Lett. 31, 999 (2006).
- (13) M. Sheik-Bahae, A. A. Said, and E. W. Van Stryland, Opt. Lett. 14, 955 (1989).
- (14) M. Sheik-Bahae, A. A. Said, T. H. Wei, D. J. Hagen, and E. W. Van Stryland, IEEE J. Quantum Electron. 26, 760 (1990).
- (15) D. Weaire, B. Wherrett, D. Miller, and S. Smith, Opt. Lett. 4, 331 (1979).
- (16) W. Zhang, S. Bian, S. I. Kim, and M. G. Kuzyk, Opt. Lett. 27, 1105 (2002).
- (17) N. R. Heckenberg, R. McDuff, C. P. Smith, and A. G. White, Opt. Lett. 17, 221 (1992).