On the universality of the scaling of fluctuations in traffic on complex networks
Abstract
We study the scaling of fluctuations with the mean of traffic in complex networks using a model where the arrival and departure of “packets” follow exponential distributions, and the processing capability of nodes is either unlimited or finite. The model presents a wide variety of exponents between and for this scaling, revealing their dependence on the few parameters considered, and questioning the existence of universality classes. We also report the experimental scaling of the fluctuations in the Internet for the Abilene backbone network. We found scaling exponents between and that do not fit with the exponent reported in the literature.
Recently, the theory of complex networks has started to cope with the problem of dynamics on networks. After much work devoted to the understanding of the network topology revnewman , the physics community has begun to develop models to uncover the phenomena observed in the dynamics on complex networks. Some stylized models of traffic flow in complex networks prlnostre ; tadic ; yamir ; zhao ; singh ; goh ; santos ; munoz ; ashton ; barthelemy can be used to gain intuition about complex networks dynamics, and to determine the leading parameters of the dynamic processes related to the network topology.
The main results obtained up to now concerning traffic flow in complex networks, are related to the determination of bounds for this flow to become congested. Nevertheless, traffic on real complex networks, as for example the Internet, is not driven by congestion processes but by large fluctuations of the ”normal” traffic behavior. In the case of the Internet, the understanding of the physical laws governing the nature of traffic is crucial because its implications in design, control and speed of the whole network leland93 .
In a couple of recent articles, Menezes and Barabasi propose a model to understand the origin of fluctuations in traffic processes in a number of real world systems, including the Internet, the world wide web, and highway networks menezes04a ; menezes04b . All of these systems can be represented at an abstract level as networks in which packets travel from one node to another, packets being real data packets or bits in the Internet, files in the world wide web, and vehicles in road networks. In particular, the authors considered the relationship between the average number of packets processed by nodes during a certain time interval, and the standard deviation of this quantity. They find that there are two classes of universality in this relationship for real systems. In the Internet, scales as , whereas scales as for the world wide web and highway networks. Based on a stylized model of random walkers throughout the network, they conclude that this difference is due to the fact that the dynamics of the Internet is dominated by “internal noise” whereas the dynamics of the world wide web and highway networks is dominated by the demands of users, that is “external noise”. In the abstraction process proposed by the authors, they overlook what is probably one of the most important factors in the dynamics of traffic on networks—the limited capacity of nodes to handle packets simultaneously, which results in packet-packet interactions and, eventually, in large fluctuations or even network congestion prlnostre ; tadic .
In this Letter we show that simple considerations regarding the persistence of packets flowing the network, the limitation of nodes to handle information, and the time window where statistics are performed, account for different scalings of the fluctuations in traffic on complex networks. The main results obtained are: (i) Maintaining the total traffic on the network constant, different scaling laws arise depending on the relation between the ratio of packet input and the steps these packets perform before disappear; (ii) The time window affects the scaling exponent of the fluctuations in such a way that, for a small enough time window the scaling trivially satisfies always, no matter the dynamic process. When the time window is large enough, the rest of parameters will provide the precise scaling between and where refers to the scaling exponent ; (iii) The effect of the packet-packet interaction (queue system) account for different scaling exponents as well; (iv) We find that within this framework there is not enough evidence for deriving universality classes. We have checked the scaling for data flowing on the Abilene backbone network, and show that the scaling exponent is different from .
To understand the origin of the scaling relations for the fluctuations in networks, let us consider the behavior of a single node—for example, a toll plaza in a highway—trying to satisfy demands from users—vehicles arriving to the toll–. As we learn from queueing theory allen , two stochastic processes fully determine the behavior of the node: (i) the arrival process by which new packets arrive to the node, and (ii) the service process by which the node satisfies the demands of the users, that is, forwards the packets. The most common queue model corresponds to the M/M/1 queueing system, where the randomness of the packets generation assumes a random (Poisson) arrival pattern footnote1 and the service distribution assumes a random (exponential) time footnote2 .
Taking into account these considerations, we propose to model the traffic process in a complex network of nodes as queue systems of type M/M/1, and a random walk simulation of packets movement on the network. The arrival process of packets to the network is controlled by a Poisson distribution with parameter , each packet enters the network at a random selected node. Once the packet arrives to the node enters a queue. The delivery of the packets in the queue is controlled by an exponential distribution of service times with parameter . In our model, the packets will perform random steps in the network before disappearing, being then a measure of the persistence of packets in the network. This dynamics is performed in continuous time, assuming that the time expended by packets traveling through a link is negligible.
The system achieves a stationary state whenever the arrival rate of packets at each node is lower than or equal to the delivery rate, otherwise the system congests. The arrival rate at each node is topology dependent and follows a distribution whose mean is where is the algorithmic betweenness of node . is defined as the relative number of paths in the network that go through node given a specific routing algorithm prlnostre . As a direct consequence, the node with maximum algorithmic betweenness determines the onset of congestion. We will focus on the average number of packets processed by nodes during a certain time interval , and the standard deviation of this quantity.
Selecting a value of , we will always observe the scaling , regardless of other parameters. Due to the value of selected, the nodes will deliver either one packet or none, at each time interval. Suppose that during a number of intervals of length the node deliver a packet whereas it does not deliver during a number of intervals , where n is the number of samples for the statistics. In this situation we also have . Therefore, the average and the standard deviation read
| (1) | |||
which can be simplified to
| (2) |
But, in the current scenario, the average flow is and then we recover the scaling law. Otherwise, this argument cannot be applied, and the scaling value will be influenced by the rest of parameters of the model.
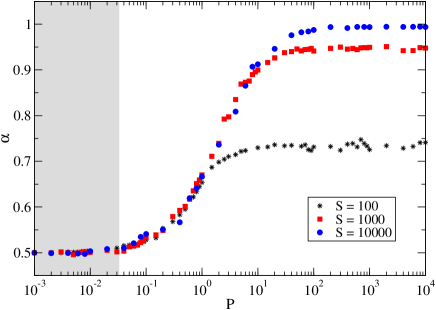
In Fig.1 we show the behavior of the scaling exponent as a function of the time intervals length over which the averages were taken, for a fixed . We observe (shadowed area) that the exponent is always when the interval length is small enough. Indeed, from the data used the exponent stands for values of .
Let us now assume that the sampling of the data is performed at intervals of length . In this case, we expect the scaling of fluctuations in the system, beyond the effect of the sampling process, to be revealed. We analyze the behavior of the system varying the rate of injection of packets into the system and the number of steps each node performs before it disappears. We first consider that the service rate . In this case, the effect of queues is minimized and then no interaction between packets is accounted for. The total traffic , number of packets flowing through the network per unit time, is determined by the Poisson process with mean .
Keeping the total traffic mean fixed, we can control the variability of the local traffic incoming to a node by varying the values of and proportionally. In Fig 2. we show the scaling exponent transition between and . This plot recovers the results depicted in menezes04a , although the explanation should be reconsidered in the new scenario. The transition of exponent from to is obtained here simply by increasing the number of steps the packet performs on the network while maintaining the mean value of the total traffic (i.e. decreasing proportionally the injection ratio ). This contradict the interpretation in menezes04a because increasing the number of steps in the network increases ”internal traffic” while decreasing the injection of packets is a decrement of ”external” traffic in this scenario. Nevertheless both results are coherent at this point concerning the scaling of fluctuations. Our interpretation of this transition is the following: for the same total traffic on the network, the nature of fluctuations is related to the number of steps the packets perform on the network. When the number of steps is small enough the behavior of fluctuations is akin a random deposition process independent of the topology of the network, . When the number of steps in the network grows, the topology induces dynamical correlations that affect the scaling of fluctuations via the algorithmic betweenness, .
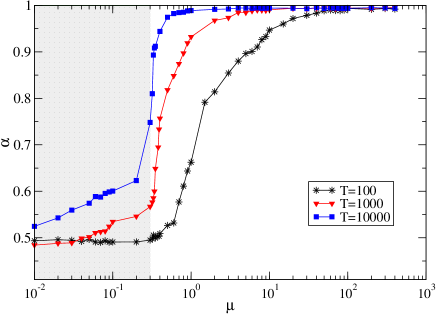
We extend the simple model where queues are neglected, to the more realistic situation when queues are persistent. The introduction of queues in the system, in our model, is controlled by the parameter (rate of service). The possible values of are constrained by the onset of congestion i.e. , otherwise congestion appears at those nodes with , because of the arrival of more packets than those that can be delivered. We investigate those values of near the onset of congestion to reveal the effect of queues in the scaling properties of the system. When congestion occurs, the queues corresponding to those nodes with will have always more packets that those than can be delivered in a period . That means that the number of packets delivered by these nodes will be controlled exclusively by the service rate , i.e. the variance scaling with respect to the mean flow at these nodes will be again fitted by corresponding to the exponential service distribution. Close to the onset of congestion we approach the situation where the scaling exponent should be recovered, however the possibility that in some periods of time the queues will be unoccupied increases as we go away from the congested regime, thus a new transition in the scaling exponent as a function is expected. In Fig. 3 we plot the scaling exponent transition as a function of for a fixed value of . In this situation the onset of congestion is determined by the critical value . Note that for values below some nodes of the network collapse and then gradually the rest of the nodes in the network. In this region, shadowed area of Fig. 3 the system enters the congestion regime progressively. The transition on the scaling exponent depicted in Fig. 3 is also affected by the time window size , we plotted the transition for , and . We observe that as increases, the transition becomes sharper. Indeed in the limit of we conjecture that the transition could be discontinuous, and could reflect a first order phase transition stanley as observed in other traffic models yamir2 , although we can not claim that this discontinuity will occur sharply from to .

Up to now, we have show that a simple traffic model where the injection of packets to the system follows a Poisson distribution, can account for different scaling exponents depending on the parameters , , and the time period were the statistics are performed. These results lead us to suspect that the scaling of fluctuations in real systems must be affected by these parameters as well. This cast doubts on the universality predicted in menezes04a . Indeed, this non-universality has been also claimed in the exponent of fluctuations when studying the data flow between stocks in NYSE market eisler . To corroborate our doubts about universality on the scaling of fluctuations in complex networks, we have studied the Internet traffic between routers of the Abilene backbone network footnote3 that are part of the data also used in menezes04a . We collected data from the 112 available router interfaces (links). We gather information of the number of packets that exit through each router interface between September 15th and November 15th of 2005, at intervals of 5 minutes. The scaling shows exponents that range from to , significantly different from the exponent presented in menezes04a . The interpretation of these exponents in the context of our stylized model is that the Abilene backbone is far from the onset of congestion for the interface with maximum algorithmic betweenness, and seems compatible with the mean rate of utilization of the interfaces in this backbone that is usually below .
Summarizing, we have presented a simple model of traffic in complex networks that capture the essential parameters governing the dynamical process. The model shows a scaling relationship between and whose exponent depends on the parameters considered as well as on the time window in which the statistics are performed. Moreover we have shown that the corresponding exponent for the scaling of fluctuations in the Internet Abilene backbone network is different from as stated in previous works, corroborating by exclusion that the universality on the scaling of fluctuations in complex networks should be questioned.
Acknowledgements.
We thank R. Guimerà for inspiration, discussion and helpful comments. We also thank M. Boguna, L. Danon, A. Diaz-Guilera, Y. Moreno and M.A. Serrano for helpful discussion and comments. This work has been supported by DGES of the Spanish Government Grant No. BFM-2003-08258.References
- (1) M. E. J. Newman, SIAM Review, 45, 2, 167-256 (2003).
- (2) R. Guimera, A. Díaz-Guilera, F. Vega-Redondo, A. Cabrales and A. Arenas, Phys. Rev. Lett., 89, 248701 (2002).
- (3) B. Tadic, S. Thurner and G.J. Rodgers, Phys. Rev. E 69, 036102, (2004).
- (4) P. Echenique, J. Gomez-Gardenes, and Y. Moreno, Phys. Rev. E 70 056105 (2004).
- (5) L. Zhao, Y.C. Lai, K. Park, and N. Ye, Phys. Rev. E 71 026125 (2005).
- (6) B.K. Singh and N. Gupte, Phys. Rev. E 71 055103 (2005).
- (7) K.I. Goh, J.D. Noh, B. Kahng, and D. Kim, Phys. Rev. E 72 017102 (2005).
- (8) M.C. Santos, G.M. Viswanathan, E.P. Raposo, and M.G.E. da Luz Phys. Rev. E, 72, 046143, (2005).
- (9) L. Donetti, P.I. Hurtado, and M.A Munoz, Phys. Rev. Lett., 95, 188701 (2005).
- (10) D.J. Ashton, T.C. Jarrett, and N.F. Johnson, Phys. Rev. Lett., 94, 058701 (2005).
- (11) M. Barthelemy and A. Flammini, preprint physics/0601203 (2005).
- (12) W.-E. Leland, M.-S. Taquu, W. Willinger, and D.-V. Wilson, ACM/SIGCOMM Comp. Comm. Rev. 23, 183-193 (1993).
- (13) M. A. de Menezes and A.-L. Barabási, Phys. Rev. Lett., 92, 028701 (2004).
- (14) M. A. de Menezes and A.-L. Barabási, Phys. Rev. Lett., 93, 068701 (2004).
- (15) A.O. Allen, Probability, Statistics and Queueing Theory with computer Science Applications, Academic Press, Inc., (1990).
- (16) Recent studies broido show that backbone traffic appears to be well described by Poisson packet arrival.
- (17) T. Karagiannis, M. Molle, M. Faloutsos and A. Broido, IEEE INFOCOM, (2004).
- (18) The communication process in the case of a M/M/1 queuing system for each node in a complex network is well described by the so-called Jackson networks jackson
- (19) J.R. Jackson, Oper. Res., 5, 518-251 (1957).
- (20) A.-L. Barabási, and R. Albert, Science 286, 509 512 (1999).
- (21) H. E. Stanley, Introduction to Phase Transitions and Critical Phenomena. New York: Oxford University Press, (1971).
- (22) P. Echenique, J. Gomez-Gardenes, and Y. Moreno, Europhysics Letters , 71, 325 (2005).
- (23) Z. Eisler, J. Kertesz, S.-H. Yook and A.-L. Barabási, Europhys. Lett., 69, 664 670 (2005).
- (24) This information is publicly available at http://abilene.internet2.edu.