Magnetometry with millimeter-scale anti-relaxation-coated alkali-metal vapor cells
Abstract
Dynamic nonlinear magneto-optical-rotation signals with frequency- and amplitude-modulated laser light have been observed and investigated with a spherical glass cell of 3-mm diameter containing Cs metal with inner walls coated with paraffin. Intrinsic Zeeman relaxation rates of Hz and lower have been observed. Favorable prospects of using millimeter-scale coated cells in portable magnetometers and secondary frequency references are discussed.
pacs:
33.55.Ad,33.55.Fi,07.55.GeI Introduction
The state of the art in compact atomic frequency references is represented by devices about 100 cm3 in volume, dissipating several watts of power Com , and maintaining relative frequency stability of about 10-11 over one day. Current atomic magnetometers can achieve high sensitivity (see, for example, Refs. Alexandrov (2003), Budker et al. (2000); Kominis et al. (2003)) but are typically large and nonportable or cumbersome to carry. Recently, physics packages for highly compact clocks Knappe et al. (2004); Lutwak et al. (2004) and magnetometers Schwindt et al. (2004) have been developed that are based on microelectromechanical systems (MEMS) micromachining techniques and promise to allow even further reduction of the size and power of these types of instruments.
Until now, all of these compact devices have been based on alkali-vapor cells containing a buffer gas. However the use of anti-relaxation coated cells in such devices may have a number of benefits, including a reduced sensitivity to field gradients and a significantly narrower resonance linewidth at very small size scales (see, for example, Ref. Kitching et al. (2002)).
With anti-relaxation coatings, polarized alkali atoms (Cs, Rb, K) can experience multiple wall collisions (up to ) without depolarization. Recent experimental investigations Budker et al. (2005); Guzman et al. (2005) have explored Zeeman and hyperfine relaxation in rubidium- and potassium-metal-vapor cells with different paraffin coatings. The characteristic cell dimensions in those works were 3 to 10 cm.
Here we investigate nonlinear magneto-optical signals with millimeter-scale paraffin-coated cells with cesium. We verify the scaling of the relaxation properties with cell size for millimeter-scale cells and discuss the practical aspects of magnetometric measurements with such cells.
We have found the 3-mm cells appropriate for small-scale magnetometers (and, probably, clocks), and verified that the intrinsic Zeeman-relaxation rate at a given alkali-vapor pressure scales approximately as , where is the characteristic dimension of the cell, for cell sizes varying by 1.5 orders of magnitude. We also compared nonlinear magneto-optical rotation (NMOR) signals using two different types of laser modulation – frequency modulation (FM NMOR Budker et al. (2002a)) and amplitude modulation – AM NMOR. We find that the AM NMOR signals are comparable to the FM NMOR signals in terms of width and signal strength, suggesting that the method of choice may depend on the ease of implementation in a particular experiment or device. Finally, the NMOR signals observed in this work at relatively high light power show evidence of conversion between alignment created in atoms by the laser light and other polarization moments such as orientation.
II The cell
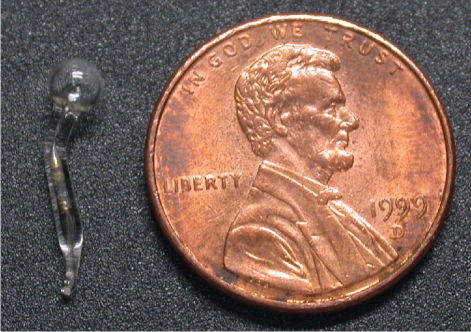
The cell used for the measurements reported here is shown in Fig. 1. The general technology for cell preparation and application of the paraffin coating is described in Ref. Alexandrov et al. (2002). The cell was made by glass-blowing techniques and is of an approximately spherical shape, with an outer diameter of about 3 mm and wall thickness of about 0.2 to 0.3 mm. A cesium-metal sample is placed in a stem (made at the same time as the cell) that is connected to the cell via a thin capillary about 0.2 mm in diameter and about 2 mm in length. The broader section of the stem on the side of the capillary opposite to the cell contains Cs metal and is about 6 mm long.
III Apparatus, procedure, and results
Most of the measurements reported here were performed by the FM NMOR technique Budker et al. (2002a). Recent reviews of nonlinear magneto-optics of resonant vapors are given in Refs. Budker et al. (2002b); Alexandrov et al. (2005). The vapor cell at room temperature was mounted within a cylindrical double-layered magnetic shield. We used a distributed-feedback (DFB) laser producing up to 10 mW of cw light, tuned to the Cs D1 line (with wavelength in vacuum of nm). The laser beam was attenuated, passed through a Glan polarizer, and directed through holes in the magnetic shield through the vapor cell. The light beam was apertured to about 2 mm in diameter before entering the cell. The curvature of the cell caused the transmitted light beam to diverge. This divergence was compensated by installing a 2.5 cm-diameter anti-reflection coated lens with a focal length of 2.5 cm at a distance of 0.15 cm after the cell. The light after the lens exited the magnetic shield and was analyzed with a Wollaston polarizer and a balanced photoreceiver whose output was connected to a digital-signal-processing lock-in amplifier. The laser frequency was sinusoidally modulated by dithering the junction current, and the synchronous signal due to optical rotation was detected.
From auxiliary absorption measurements, we estimated the Cs-vapor density in the cell to be approximately cm-3. This density is an order of magnitude lower than the saturated density of Cs at room temperature, in our experience, a not-too-uncommon occurrence in paraffin-coated cells (the density can usually be brought closer to the saturated density by reheating the stem; however, this was not needed here, as the signals were sufficiently strong even with this low alkali-vapor density). A solenoid was installed within the innermost magnetic shield and was used to set or scan the magnetic field applied to the cell directed collinearly with the light-propagation direction (the Faraday-rotation geometry). In a typical measurement, we would tune the central frequency of the laser to a particular value near the resonance, set the modulation frequency and amplitude, and record the output of the lock-in amplifier as a function of the magnetic field.
An example of such an FM NMOR scan is shown in Fig. 2. For this scan, the light power transmitted through the cell was W, and the modulation frequency of the laser was set to kHz, with the peak-to-peak frequency-modulation depth of MHz. The upper trace on the figure shows the quadrature (out-of-phase) output of the lock-in amplifier, while the lower trace (which is vertically offset for clarity) represents the in-phase output. As usual in FM NMOR experiments, there is a dispersively shaped resonance in the in-phase component that appears near zero magnetic field, as well as dispersively shaped resonances that appear when , where is the Larmor-precession frequency, is the Landé factor of the ground-state hyperfine component ( for the Cs states, respectively), is the Bohr magneton, and is the magnetic field. Absorptively shaped quadrature resonances also appear when . The origin of all these features is well understood qualitatively Budker et al. (2002a), and they are reproduced in an analytical calculation with a model system Malakyan et al. (2004).
We use the scans such as the one shown in Fig. 2 to determine the Zeeman-relaxation rate . To do this, we fit the resonances to appropriately phased Lorentzians and determine their width . The width corresponds to the separation between the minimum and the maximum of the dispersively shaped features in the in-phase signals. We then evaluate the relaxation rate from . The rate has a contribution due to light-power broadening. In order to find the intrinsic light-independent relaxation rate, we take data at several low light-power levels, and extrapolate to zero light power (Fig. 3). The data shown in Fig. 3 were taken over a period of less than an hour on one day. The intrinsic relaxation rate obtained from these data is Hz (corresponding to the resonance width as a function of the magnetic field of 0.07 mG). On a different day (on which the scan of Fig. 2 was taken), we observed smaller intrinsic relaxation rates, down to 10 to 15 Hz. We attribute this variation to the change in the equilibrium vapor density in the cell. Indeed, previous work Budker et al. (2005); Graf et al. (2005) has produced evidence that wall relaxation of polarized atoms in paraffin-coated cells is strongly dependent on the vapor density in the cell.
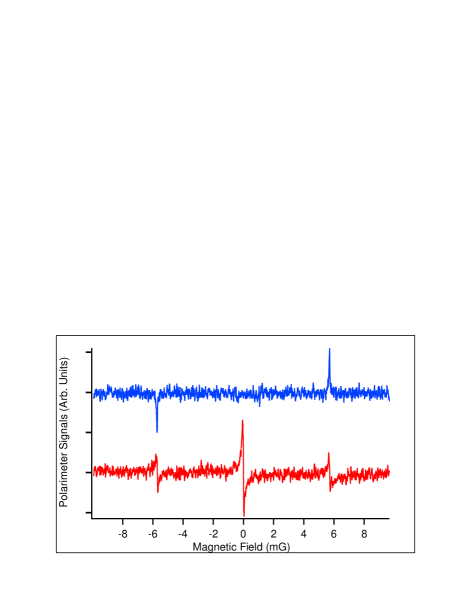
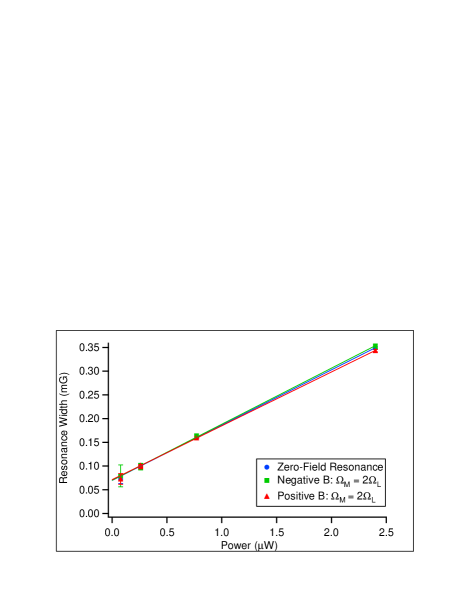
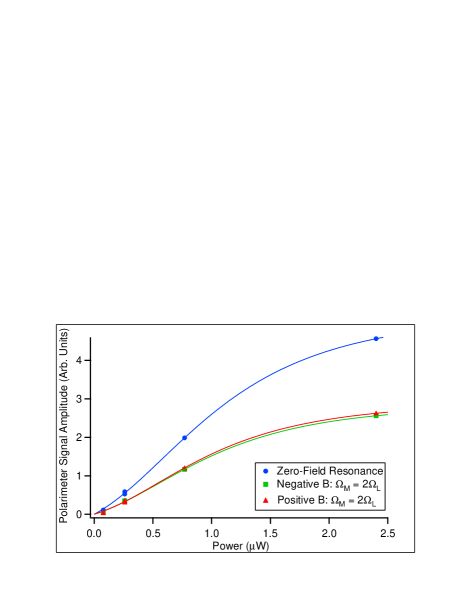
Figure 4 shows the dependence of the signal size vs. light power. The data points correspond to those in Fig. 3. The power dependence of the signal in the low-power limit is expected to be quadratic because the signal is proportional to the light power times the angle of the nonlinear light-polarization rotation, which is in turn proportional to the power. As seen in Fig. 4, significant deviations from this asymptotic low-power behavior occur at essentially all light powers where data were taken, and certainly at W, where the dependence appears linear. Similar saturation behavior was seen in earlier work on FM NMOR with Rb Yashchuk et al. (2003).
Further details of the investigation of FM NMOR in this system are given in the Appendices.
IV Specifics of magneto-optics with small coated cells; estimate of sensitivity
The results described above show that strong nonlinear magneto-optical-rotation signals appropriate for use in magnetometers can readily be obtained in millimeter-scale paraffin-coated vapor cells (Fig. 9 shows a spectral scan where the signals have been normalized, so the first-harmonic amplitudes of the optical rotation are presented). We point out that Cs has an advantage for use in magnetometers based on atomic alignment (and higher polarization moments) because its hyperfine structure is fully resolved (due to large upper-state hyperfine splitting of MHz in the state and smaller Doppler width compared to lighter alkali atoms). As will be discussed in more detail in Ref. Guzman et al. (2005), there is considerable suppression of nonlinear magneto-optical rotation when upper-state hyperfine structure is not fully resolved (a particularly strong suppression, by two orders of magnitude compared to cesium, in the case of potassium).
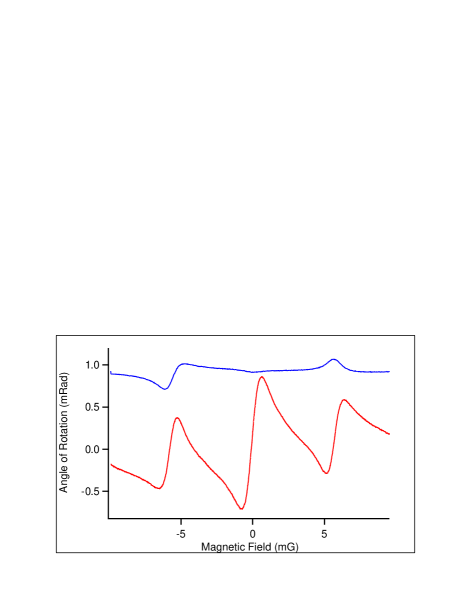
A concern in using small cells in magneto-optical work is the effect of optical imperfection of glass-blown cells and the curvature of the cell’s surfaces. We found that, although we needed to use a lens to correct for the cell’s curvature, this does not present a serious problem. We also found that, presumably due to stress-induced birefringence in the glass, linearly polarized light acquired significant ellipticity (up to rad) upon propagation through the cell. Ellipticity could lead to offsets in the polarimeter signals due to self-rotation Rochester et al. (2001). We have also observed that the ellipticity causes phase shifts for nonzero B-field resonances and an asymmetry between positive and negative B-field resonances at relatively high light powers (Fig. 9). We were able to affect and largely compensate these distortions by placing a quarter-wave plate before the cell and adjusting it to compensate the ellipticity. This problem could be eliminated completely through the use of planar, microfabricated cells as described in Liew et al. (2004). These cells have windows made from thin, flat glass wafers and are expected to have significantly less birefringence than the cell used in this experiment.
While no systematic optimization or characterization of the magnetometer performance was attempted in the present work, we have measured that the setup in the present incarnation is a magnetometer with a sensitivity to low frequency (Hz) variations in the magnetic field of pT/. For this measurement, the response of the system was determined by stepping the frequency of the laser-frequency modulation by 1 or Hz and measuring the voltage change at the in-phase output of the lock-in amplifier. This gives the slope as a function of frequency, which is then converted to a slope as a function of magnetic field. Noise was evaluated by connecting the output of the lock-in amplifier to a spectrum analyzer. The magnetic sensitivity was measured with laser power of nW, peak-to-peak frequency-modulation amplitude of MHz, and the laser center frequency tuned to maximize the slope, MHz from the transition.
V Nonlinear magneto-optical rotation with amplitude-modulated light (AM NMOR)
We have also briefly explored an alternative technique to FM NMOR, where instead of frequency modulating the laser synchronously with the Larmor precession, laser-light amplitude is modulated instead (AM NMOR). In fact, this technique of synchronous optical pumping is similar to that described in the pioneering work of Bell and Bloom Bell and Bloom (1961). Important differences with the early work include that we pump transverse atomic alignment rather than a combination of longitudinal alignment and orientation, and that we synchronously detect optical rotation rather than transmission (see review article Alexandrov et al. (2005) for a discussion of various dynamic nonlinear magneto-optical processes and references to related work).
To achieve amplitude modulation of the laser power, the light beam was passed through a commercial acousto-optical modulator-deflector (AOM) operated at the acoustic frequency of MHz. The drive of the AOM could be controlled by applying a TTL signal from a function generator. To compare AM and FM NMOR signals, we recorded both types of signals at the same modulation frequency, and otherwise similar experimental conditions (Fig. 5). For the AM data shown, we used square-wave (on/off) modulation of the laser power with a duty cycle.
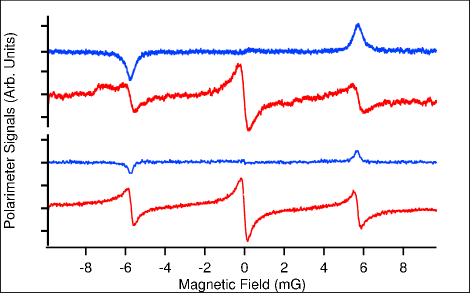
Comparison of the AM and FM NMOR data shown in Fig. 5 shows that both modulation methods produce similar signals.
An interesting result of the comparison is that the quadrature signals are more significantly suppressed with respect to the in-phase signals in the case of FM NMOR. We hypothesize that this is due to less efficient conversion of the induced atomic alignment into other polarization multipoles due to a factor-of-two lower average light power to which the atoms are exposed in the AM case. In general, the AM and FM NMOR spectra are different. Consequently, the relative merits of the two methods for magnetometry will have to be assessed by a careful investigation and separate optimization of various parameters involved in the measurement (light power, tuning of the central light frequency, AM duty cycle, etc.). This work is in progress elsewhere Gawlik et al. (2005).
As seen in Fig. 5, the AM NMOR signals are noisier than their FM NMOR counterparts, particularly in the case of the in-phase signal. The origin of this is not presently understood. We suspect that this is due to elevated sensitivity to laser-frequency noise, a point that requires further study.
VI Conclusion
We have conducted measurements of nonlinear magneto-optical-rotation signals with frequency- and amplitude-modulated light (FM and AM NMOR) with millimeter-scale paraffin-coated Cs cells. The results indicate that such cells are promising for the development of small-scale magnetometers. While no systematic optimization or characterization of the magnetometer performance was attempted in the present work, the measured sensitivity of pT/ suggests that sub-picotesla magnetometry might be possible with highly miniaturized devices. Since atomic magnetometers and clocks are essentially similar devices, we also expect that coated cells with volumes comparable to the one studied in this work could find application in secondary frequency standards.
Acknowledgements
The authors are grateful to E. B. Alexandrov, M. Auzinsh, W. Gawlik, J. S. Guzman, L, Hollberg, D. F. Kimball, S. Pustelny, S. M. Rochester, J. Zachorowski, and V. V. Yashchuk for helpful discussions. This work was supported by the ONR-MURI grant No. FD-N00014-05-1-0406, by the National Science Foundation, by the Director, Office of Science, Office of Basic Energy Sciences, Nuclear Science Divisions, of the U.S. Department of Energy under contract DE-AC03-76SF00098, by a CalSpace Minigrant, and by the Microsystems Technology Office of the Defence Advanced Research Projects Agency (DARPA). This work is a partial contribution of NIST, an agency of the United States government, and is not subject to copyright.
Appendix I. FM NMOR Spectra
We have investigated the spectra of FM NMOR signals for different modulation amplitudes and light powers (Fig. 6). In order to remove the contributions to the spectra that do not have sharp resonant character with respect to magnetic field, we have subtracted spectra recorded at the minimum and maximum of the negative-B feature. The nonresonant contributions were typically at a level of the resonant signal. These contributions are related to such effects as etaloning on the optical elements, residual misbalance of the polarimeter, etc.
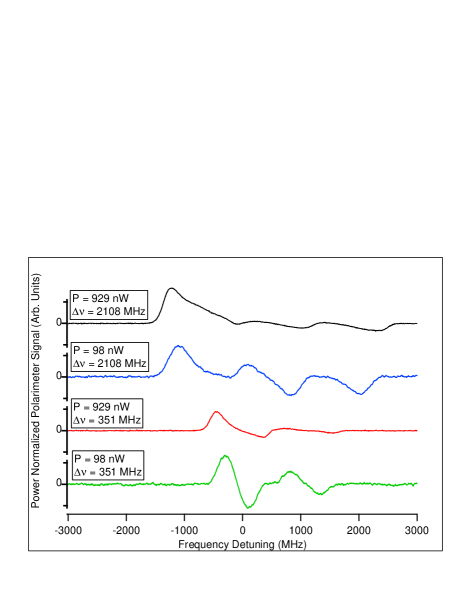
The plots in Fig. 6 indicate some variations in the shape of the spectrum from low to high powers, and a more dramatic variation with the modulation amplitude. While the spectrum for low frequency-modulation amplitudes is composed of dispersively shaped features corresponding to the different hyperfine components of the transition, the high-modulation-amplitude spectra are mostly absorptively shaped. Qualitatively, this is because at low modulation amplitudes, the spectrum is similar to the derivative of the non-modulated NMOR (see Ref. Budker et al. (2002a)), while at high modulation amplitudes, the peaks occur when the central frequency of the laser is detuned in such a way that the the laser frequency is in resonance with the atoms at either the maximum (positive peaks) or the minimum (negative peaks) of its frequency excursion. This, in a sense, is equivalent to low-duty cycle (short-pulse) interaction of the laser light with the atoms synchronous with the Larmor precession. The peaks corresponding to a given hyperfine component are of opposite signs for positive and negative detuning because optical rotation is maximal at opposite phases of the laser-frequency modulation.
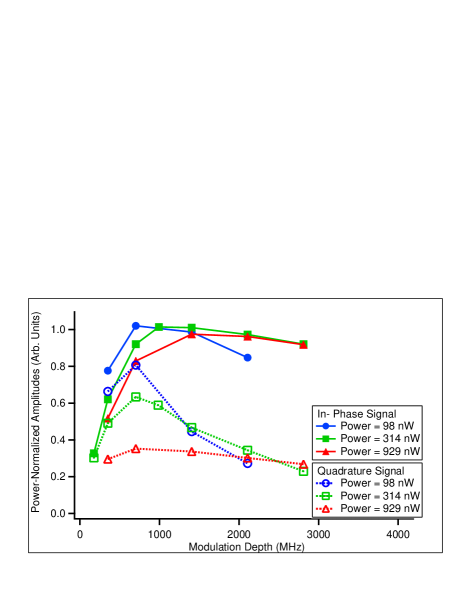
For practical applications of FM NMOR, it is important to optimize various parameters of the system, including light power, central laser-frequency detuning, modulation amplitude, etc. The figure of merit for the magnetometer performance depends on the signal size and resonance linewidth. While a full optimization was not attempted here, Fig. 7 shows the dependence of the maximum signal on the modulation amplitude at different light powers. To obtain this dependence, the modulation frequency was fixed, and the central laser frequency was scanned to obtained spectra similar to those shown in Fig. 6. The plots in Fig. 7 show the amplitudes of the largest (low-frequency; see Fig. 6) peaks in the spectra normalized by light power.
Figures 6 and 8 show the parts of the FM NMOR spectra corresponding to the transition group. We have also recorded spectra for the transition group. The signals for the transition are several times smaller than those for , while the signals for the transition can hardly be seen at all at our sensitivity. A similar distribution of the FM-NMOR-signal strength over the hyperfine components of the D1 transition was observed in Rb Budker et al. (2002a).
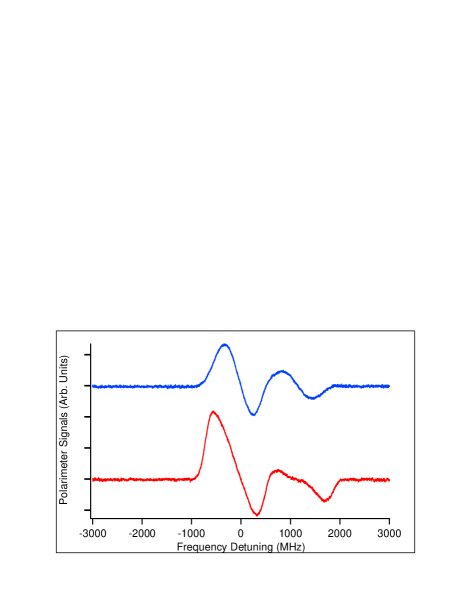
Appendix II. Evidence for polarization-moment conversion
At low powers, the quadrature and in-phase signals have similar spectra; however, at higher powers, significant deviations are observed (Fig. 8). The differences between the in-phase- and quadrature-signal spectra may be due to the conversion of laser-induced atomic alignment into orientation and other, higher, polarization moments (see reviews Budker et al. (2002b); Alexandrov et al. (2005) and references therein). Such conversion occurs due to the combined action of the magnetic field and the ac electric field of the light on the polarized atoms.
As a result of such polarization-moment conversion, components of polarization are created that do not undergo Larmor precession (for example, orientation directed along the magnetic field). Such polarization components would not contribute to the synchronous signals we detect if unmodulated probe light were used for detection. (They would contribute to time-independent optical rotation of the probe.) In the present case, however, the pump and probe light are the same and are both modulated. Thus, this “static” rotation also acquires a time dependence that is in phase with the laser-frequency modulation. Since the spectra of optical rotation for different polarization multipoles are, in general, different, it is not surprising that these differences also manifest themselves in the differences between the in-phase and quadrature spectra.
Evidence for conversion of laser-induced alignment into other polarization multipoles also comes from the fact that, while the amplitudes of the in-phase and quadrature signals for the nonzero B-field resonances are the same at low light powers, the relative size of the quadrature signals decreases greatly at higher light powers. For example, the quadrature-signal amplitudes are about a factor of five smaller than the in-phase ones for the light power of W (see Fig. 9). This trend is also seen in the comparison of the quadrature and in-phase amplitudes shown in Fig. 7.
References
- (1) See, for example, the Accubeat AR-100B Rubidium Frequency Standard; Frequency Electronics FE-5658A; Kernco Dark Line Atomic Clock; Stanford Research Systems PRS10 Rubidium Frequency Standard; Symmetricom X-72 Precision Rubidium Oscillator; Temex iSource+ Low Cost HPFRS; reference is for technical clarity and does not imply endorsement by NIST.
- Alexandrov (2003) E. B. Alexandrov, Physica Scripta T105, 27 (2003).
- Budker et al. (2000) D. Budker, D. F. Kimball, S. M. Rochester, V. V. Yashchuk, and M. Zolotorev, Physical Review A (Atomic, Molecular, and Optical Physics) 62, 043403 (2000).
- Kominis et al. (2003) I. K. Kominis, T. W. Kornack, J. C. Allred, and M. V. Romalis, Nature 422, 596 (2003).
- Knappe et al. (2004) S. Knappe, V. Shah, P. D. D. Schwindt, L. Hollberg, J. Kitching, L. A. Liew, and J. Moreland, Applied Physics Letters 85, 1460 (2004).
- Lutwak et al. (2004) R. Lutwak, J. Deng, W. Riley, M. Varghese, J. Leblanc, G. Tepolt, M.Mescher, D. K. Serkland, K. M. Geib, and G. M. Peake, in 36th Annual Precise Time and Time Interval (PTTI) Meeting (Washington, DC, 2004).
- Schwindt et al. (2004) P. D. D. Schwindt, S. Knappe, V. Shah, L. Hollberg, J. Kitching, L. A. Liew, and J. Moreland, Applied Physics Letters 85, 6409 (2004).
- Kitching et al. (2002) J. Kitching, S. Knappe, and L. Hollberg, Applied Physics Letters 81, 553 (2002).
- Budker et al. (2005) D. Budker, L. Hollberg, D. F. Kimball, J. Kitching, S. Pustelny, and V. V. Yashchuk, Physical Review A 71, 012903 (2005).
- Guzman et al. (2005) J. S. Guzman, J. E. Stalnaker, V. V. Yashchuk, and D. Budker, Investigation of zeeman and hyperfine relaxation of potassium in anti-relaxation-coated cells (2005), in preparation.
- Budker et al. (2002a) D. Budker, D. F. Kimball, V. V. Yashchuk, and M. Zolotorev, Physical Review A (Atomic, Molecular, and Optical Physics) 65, 055403 (2002a).
- Alexandrov et al. (2002) E. B. Alexandrov, M. V. Balabas, D. Budker, D. English, D. F. Kimball, C. H. Li, and V. V. Yashchuk, Physical Review A 66, 042903/1 (2002).
- Budker et al. (2002b) D. Budker, W. Gawlik, D. F. Kimball, S. M. Rochester, V. V. Yashchuk, and A. Weis, Reviews of Modern Physics 74, 1153 (2002b).
- Alexandrov et al. (2005) E. B. Alexandrov, M. Auzinsh, D. Budker, D. F. Kimball, S. M. Rochester, and V. V. Yashchuk, Journal of the Optical Society of America B-Optical Physics 22, 7 (2005).
- Malakyan et al. (2004) Y. P. Malakyan, S. M. Rochester, D. Budker, D. F. Kimball, and V. V. Yashchuk, Physical Review A 69, 013817 (2004).
- Graf et al. (2005) M. T. Graf, D. F. Kimball, S. M. Rochester, K. Kerner, C. Wong, D. Budker, E. B. Alexandrov, and M. V. Balabas, Physical Review A (2005).
- Yashchuk et al. (2003) V. V. Yashchuk, D. Budker, W. Gawlik, D. F. Kimball, Y. P. Malakyan, and S. M. Rochester, Physical Review Letters 90, 253001 (2003).
- Rochester et al. (2001) S. M. Rochester, D. S. Hsiung, D. Budker, R. Y. Chiao, D. F. Kimball, and V. V. Yashchuk, Physical Review A (Atomic, Molecular, and Optical Physics) 63, 043814/1 (2001).
- Liew et al. (2004) L. Liew, S. Knappe, J. Moreland, H. G. Robinson, L. Hollberg, and J. Kitching, Appl. Phys. Lett. 84, 2694 (2004).
- Bell and Bloom (1961) W. Bell and A. Bloom, Physical Review Letters 6, 280 (1961).
- Gawlik et al. (2005) W. Gawlik, L. Krzemien, S. Pustelny, D. Sangla, J. Zachorowski, M. T. Graf, A. O. Sushkov, and D. Budker, Nonlinear magneto-optical rotation with amplitude-modulated light: Amor (2005), physics/0510207.