Ultraslow light in inhomogeneously broadened media
Abstract
We calculate the characteristics of ultraslow light in an inhomogeneously broadened medium. We present analytical and numerical results for the group delay as a function of power of the propagating pulse. We apply these results to explain the recently reported saturation behavior [Baldit et al., Phys. Rev. Lett. 95, 143601 (2005)] of ultraslow light in rare earth ion doped crystal.
pacs:
42.65.-k, 42.50.GyThe usage of a coherent field to control the optical properties of a medium has led to many remarkable results such as enhanced nonlinear optical effects Tewari_PRL_86 ; Harris_PRL_90 , electromagnetically induced transparency (EIT) Harris_PT_97 , lasing without inversion Kocharovskaya_JETP_88 ; Kocharovskaya_PR_92 ; Agarwal_PRA_91 , ultraslow light Hau_Nat_99 ; Kash_PRL_1999 ; Budker_PRL_99 ; Turukhin_PRL_2002 ; Ku_OL_04 , storage and retrieval of optical pulses Lukin_PRL_01 and many others Zibrov_PRL_96 ; Kang_PRL_04 ; Deng_PRL_03 ; Stenner_Nature_2003 . Most of these effects rely on quantum interferences which are created by the application of a coherent field. The coherent field opens up a new channel for the process under consideration. This interference effect produces the EIT dip or a hole in the absorption profile. The ultraslow light emerges as the EIT dip could be very narrow. It has been realized that in principle one could also use two level nonlinearities in presence of a strong pump. For a homogeneously broadened medium a hole can emerge if the transverse and longitudinal relaxation times are quite different. Under these conditions the hole has a width of the order of and this is being referred to as the effect of coherent population oscillation Schwartz_APL_67 . Bigelow et al. did experiments in this regime using ruby as the material medium which can be modelled as a homogeneously broadened system Bigelow_PRL_2003 ; Bigelow_SCI_2003 . Some studies on slowlight in inhomogeneous broadened medium exist Kocharovskaya_prl_01 ; Agarwal_PRA_03 . In an earlier paper the present authors had considered the case of inhomogeneously broadened gaseous medium where the Doppler effect is important Agarwal_PRA_03 . We considered the case of saturation absorption spectroscopy. This leads to the well known hole in the Doppler profile. The width of this hole was of the order of which is about two times . In the inhomogeneously broadened gaseous medium the group index of the order of was obtained. The recent experiment of Baldit et al. reports group delays of the order of 1.1 s in rare earth ion doped crystal which has strong inhomogeneous broadening Baldit_PRL_05 . In this case all the relaxation times are quite different - ms; s; inhomogeneous line width GHz. The width of the whole is essentially determined by and hence one gets very large delays. Baldit et al. did present a theoretical model based on homogeneous broadening of the medium where as to obtain agreement with experiments inhomogeneous broadening is to be included as alluded by them footnote1 .
In this paper, we consider a system of inhomogeneously broadened two level atoms interacting with co-propagating pump and probe fields. We use the well known susceptibility Mollow_PRA_1972 and average it over the inhomogeneous distribution to calculate the group index. We derive a number of analytical results and show how these can be used to understand the experimental results of Baldit et al. For example we show that in the limit of very small detuning of the probe from the pump the group delay goes as for large S. The group delay also peaks at about S=0.9. The value of group delay increases as the detuning increases. We further present detailed numerical results.
In order to understand the experimental results of Baldit et al, we consider a two level system as shown in figure 1.
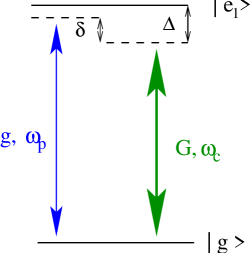
Here we define all fields as
| (1) |
where is the slowly varying envelope of the field. The pump field at frequency and the probe field at frequency are co-propagating through the medium. The linear susceptibility is obtained by solving the density matrix equations for the two level system of figure 1, that is by calculating the density matrix element to the first order in the probe field but to all orders in the co-propagating pump field. The dynamics of population and polarization of the atoms in the two-level configuration are given by
| (2) | |||||
where and are the longitudinal and transverse relaxation times respectively. The density-matrix elements in the original frame are given by , and . The detunings and the Rabi frequencies are defined by
| (3) |
where is the dipole matrix element. The susceptibility can be obtained by considering the steady state solution of Eq.(2) to the first order of and write the solution as
| (4) |
The eg element of will yield the linear susceptibility at the frequency as can be seen by combining Eqs.(2) and (4):
| (5) |
where is the density of the atoms of the medium. The saturation parameter is defined as the ratio of the control field intensity and the saturation intensity. The average response of the susceptibility is given by
| (6) |
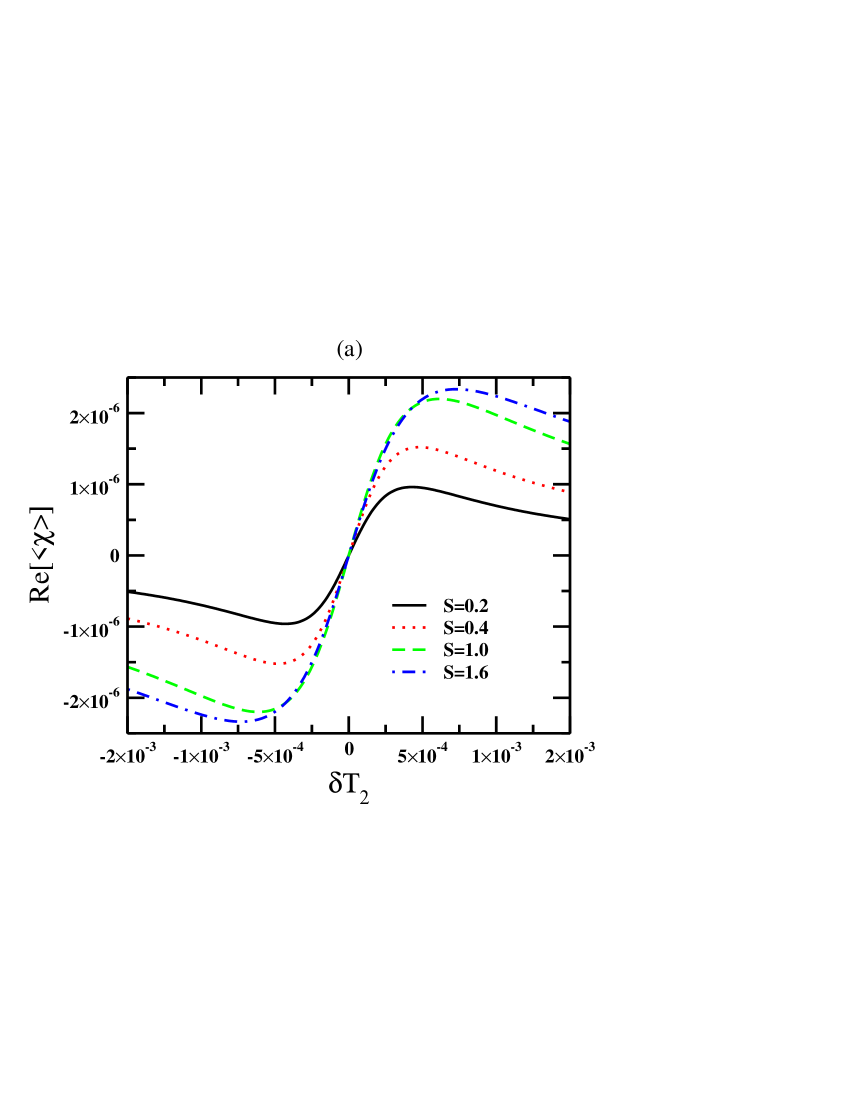
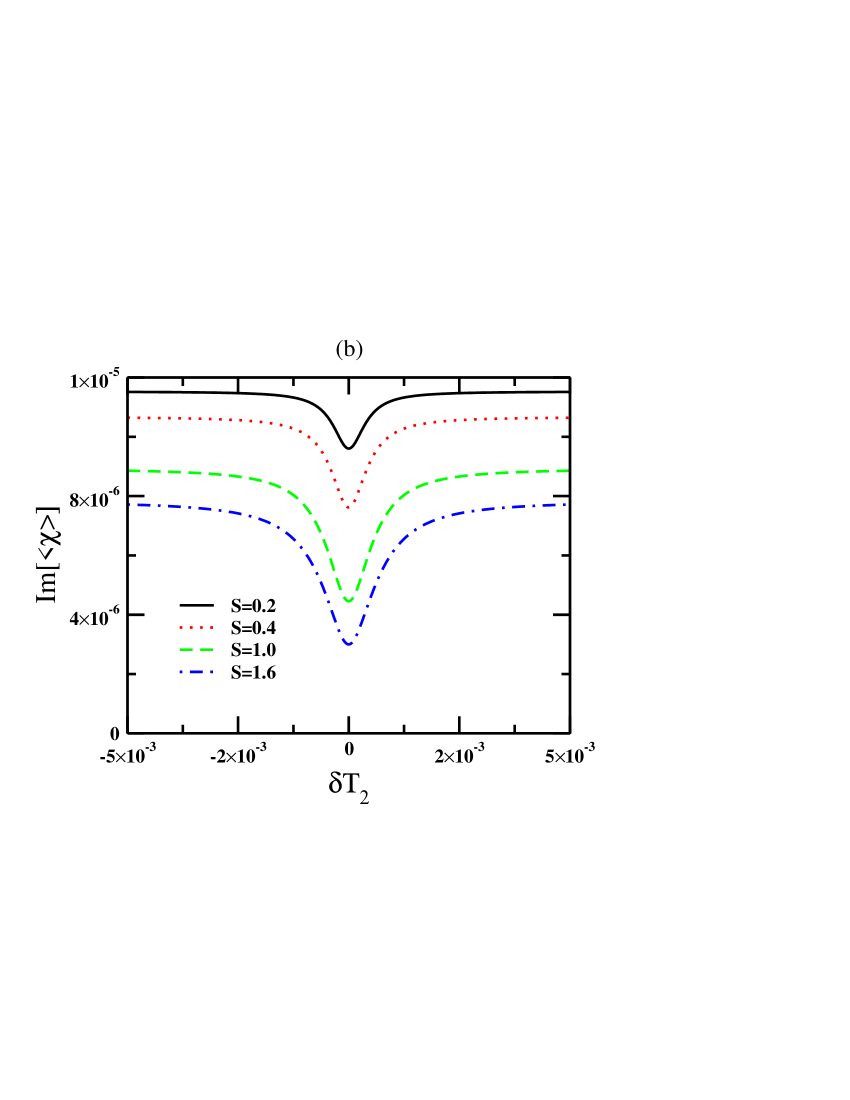
where is the central frequency of the atomic transition . Here we consider the frequency of the control field is tuned to the line center . We present the behavior of real and imaginary parts of the susceptibility as a function of the detuning of the probe field in Fig. (2). The real part of susceptibility gives normal dispersion. It is clear from Fig. (2a) that the slope of normal dispersion attains maximum when S which leads to ultra slow light. The imaginary part of exhibits the absorption dip which becomes deeper with the increase in the intensity of the control field as shown in Fig. (2b). The spectral width of absorption dip depends on the intensity of the control field. This dip is associated with coherent population oscillationSchwartz_APL_67 .
|
|
In order to compare with experimental results of Baldit et al. we need to know the group index which is defined by
| (7) | |||||
where
| (8) |
We denote the integration with respect to has been denoted by . The unsaturated inhomogeneous absorption coefficient of the two level atomic system is defined as
| (9) |
In the limit of very small detuning of the probe from the pump, the analytical expression for the group index for inhomogeneous case can be expressed as
| (10) |
It is clear from the above expression that the group index varies as for large value of . The group index attains the maximum value at . In case of homogeneously broadened two level system the group index is given by Baldit_PRL_05
| (11) |
where is the homogeneous absorption coefficient. For homogeneous two level system the group index varies as at large S and peaks at S=0.5.
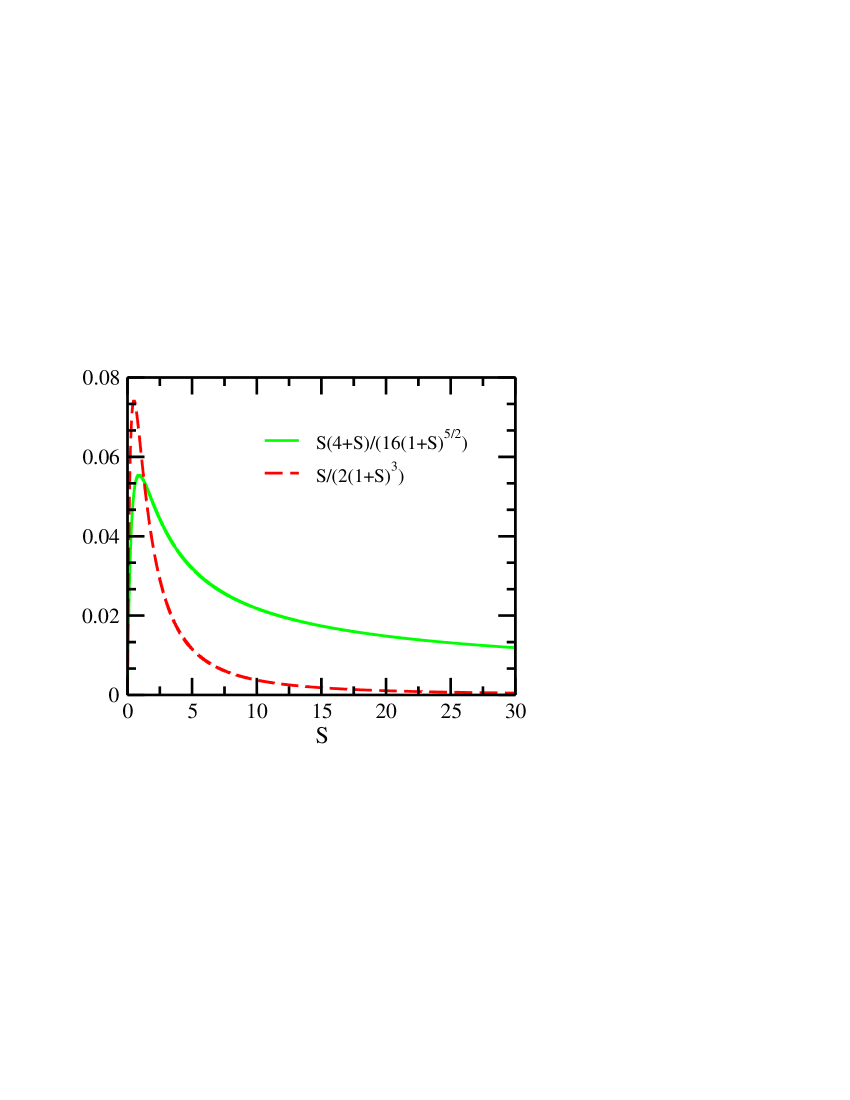
At large S, the group index for a two level system falls much slowly for an inhomogeneous medium as compared to the homogeneous case as shown in Fig. (3). We thus find an important difference between inhomogeneously and homogeneously broadened two level systems. Note that the ratio between inhomogeneous and homogeneous unsaturated absorption coefficient is . The behavior so obtained is consistent with the experimental observation. Figure (4) shows the variation of group index as function of the intensity of the control field at different probe detuning.
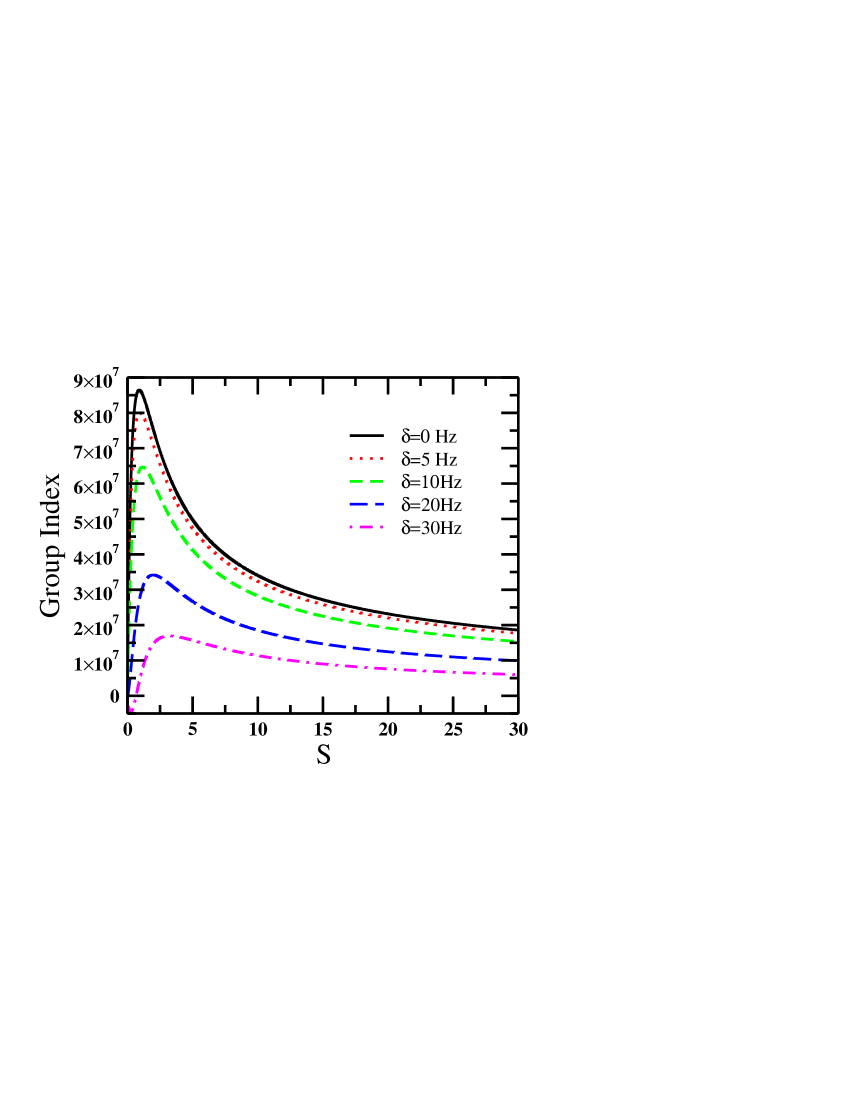
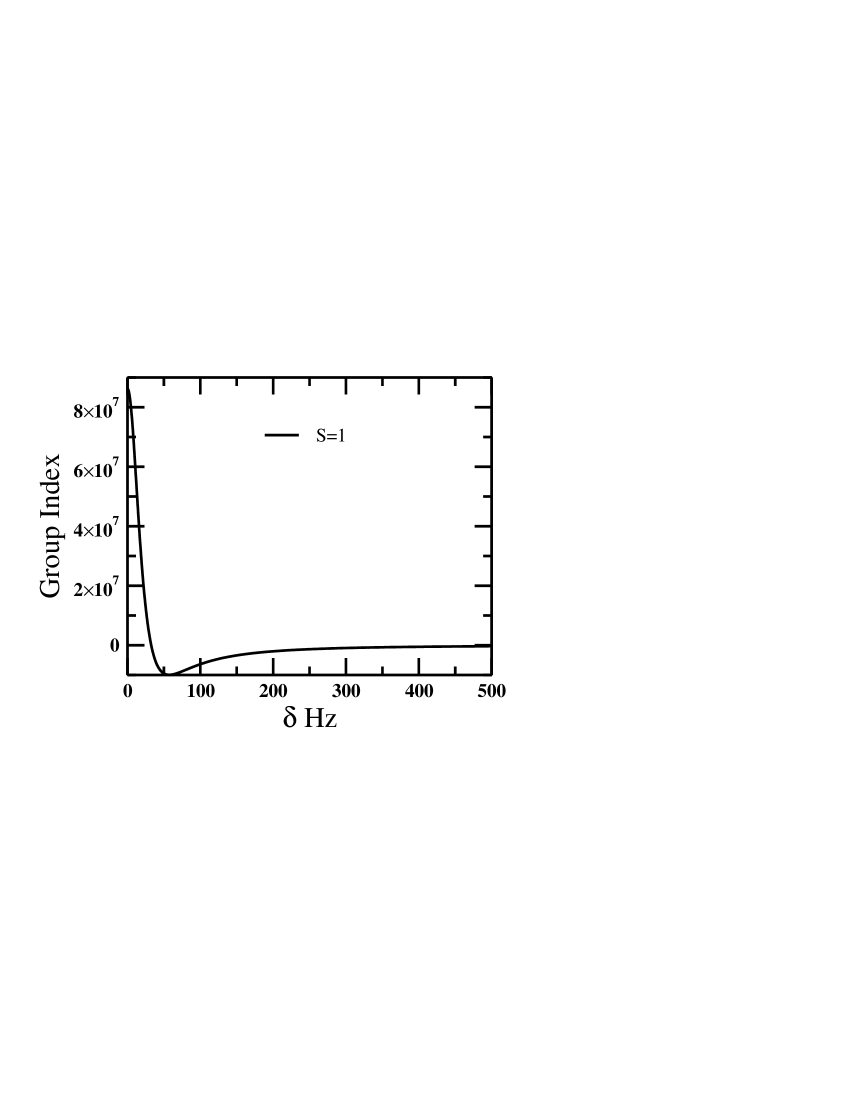
As the detuning of the probe field is increased the peak of the group index shifts toward higher S. The maxima of the group index for Hz occurs at which corresponds to the group velocity m/s which is higher than what is reported. Further the figure (5) shows the variation of the group index calculated from the Eq. (7) with the detuning of the probe field for saturation parameter S=1.
In conclusion, we have discussed the characteristics of ultraslow light in an inhomogeneously broadened medium. Our numerical and analytical results enable to understand the nature of the experimental results of Baldit et al. However the results derived here are applicable to any system which can be modelled by inhomogeneously broadened two level system.
References
- (1) S.P. Tewari and G.S. Agarwal, Phys. Rev. Lett. 56, 1811 (1986).
- (2) S.E. Harris, J.E. Field, and A. Imamŏglu, Phys. Rev. Lett. 64, 1107 (1990); K.-J. Boller, A. Imamŏglu, and S.E. Harris, Phys. Rev. Lett. 66, 2593 (1991); J.E. Field, K.H. Hahn, and S.E. Harris, Phys. Rev. Lett. 67, 3062 (1991).
- (3) S.E. Harris, Phys. Today 50, 36 (1997).
- (4) O. Kocharovskaya and Ya.I. Khanin, JETP Lett. 48, 630 (1988); S.E. Harris, Phys. Rev. Lett. 62, 1033 (1989); M.O. Scully, S.-Y. Zhu, and A. Gavrielides, Phys. Rev. Lett. 62, 2813 (1989).
- (5) O. Kocharovskaya, Phys. Rep. 219, 175 (1992); M.D. Lukin, P.R. Hemmer, and M.O. Scully, Adv. At. Mol. Opt. Phys. 42, 347 (2000).
- (6) G.S. Agarwal, Phys. Rev. A44, R 28 (1991).
- (7) L.V. Hau, S.E. Harris, Z. Dutton, and C.H. Behroozi, Nature (London)397, 594 (1999).
- (8) M.M. Kash, V.A. Sautenkov, A.S. Zibrov, L. Hollberg, G.R. Welch, M.D. Lukin, Y. Rostovtsev, E.S. Fry, and M.O. Scully, Phys. Rev. Lett. 82, 5229 (1999).
- (9) D. Budker, D.F. Kimball, S.M. Rochester, and V.V. Yashchuk, Phys. Rev. Lett. 83, 1767 (1999).
- (10) A.V. Turukhin, V.S. Sudarshanam, M.S. Shahriar, J.A. Musser, B.S. Ham and P.R. Hemmer, Phys. Rev. Lett. 88, 023602 (2002).
- (11) P.C. Ku, F. Sedgwick, C.J. Chang-Hasnain, P. Palinginis, T. Li, H. Wang, S.W. Chang, and S.L. Chuang, Opt. Lett. 29, 2291 (2004).
- (12) D.F. Phillips, A. Fleischhauer, A. Mair, R.L. Walsworth, and M.D. Lukin, Phys. Rev. Lett. 86, 783 (2001).
- (13) A.S. Zibrov, M.D. Lukin, L. Hollberg, D.E. Nikonov, M.O. Scully, H.G. Robinson, and V.L. Velichansky, Phys. Rev. Lett. 76, 3935 (1996).
- (14) H. Kang and Y. Zhu, Phys. Rev. Lett. 91, 093601 (2003); H. Kang, G. Hernandez, and Y. Zhu, Phys. Rev. Lett. 93, 073601 (2004).
- (15) L. Deng and M. G. Payne, Phys. Rev. Lett. 91, 243902 (2003).
- (16) M.D. Stenner, D.J. Gautheir, and M.A. Neifeld, Nature (London)425, 695 (2003).
- (17) S. E. Schwartz and T.Y. Tan, Appl. Phys. Lett. 10, 4 (1967); M. Sargent III, Phys. Rep. 43, 223 (1978); R.W. Boyd, M.G. Raymer, P. Narum, and D.J. Harter, Phys. Rev. A24, 411 (1981); A. D.Wilson-Gordon, Phys. Rev. A48, 4639 (1993).
- (18) M.S. Bigelow, N.N. Lepeshkin, and R.W. Boyd, Phys. Rev. Lett. 90, 113903 (2003).
- (19) M.S. Bigelow, N.N. Lepeshkin, and R.W. Boyd, Science 301, 200 (2003).
- (20) O. Kocharovskaya, Y. Rostovtsev, and M.O. Scully, Phys. Rev. Lett. 86, 628, (2001).
- (21) G.S. Agarwal and T. N. Dey, Phys. Rev. A, 68, 063816 (2003).
- (22) E. Baldit, K. Bencheikh, P. Monnier, J.A. Levenson and V. Rouget, Phys. Rev. Lett. 95, 143601 (2005)
- (23) There are important differences between the Doppler broadened gaseous medium and solid state medium like rare earth ion doped crystal. These differences arise from the way the susceptibilities are to be averaged over inhomogeneous distribution.
- (24) B.R. Mollow, Phys. Rev. A 5, 2217 (1972).